
Executives have a clear mandate: make selective bold moves, embrace AI and advanced analytics, and play for long-term advantage.
For many companies, the goal of creating value from mergers and acquisitions has been elusive. BCG has long studied M&A activity by year to understand evolving trends and to identify what the activity means for value creation in the short and long terms.
Since the beginning, our annual M&A report has presented analyses of buy-side and sell-side transactions tracked in our BCG M&A database, which now comprises more than 1 million deals dating back to 1980. This year’s report examines how periods of uncertainty present opportunities for dealmakers who possess the capabilities to pursue targeted acquisitions and disciplined geographic expansions. It also considers how companies can create value from cross-border transactions by skillfully navigating regional complexities, regulatory challenges, and cultural integration. Collectively, our M&A reports offer a longitudinal view of the market’s evolution and the methods that successful dealmakers use to create value.
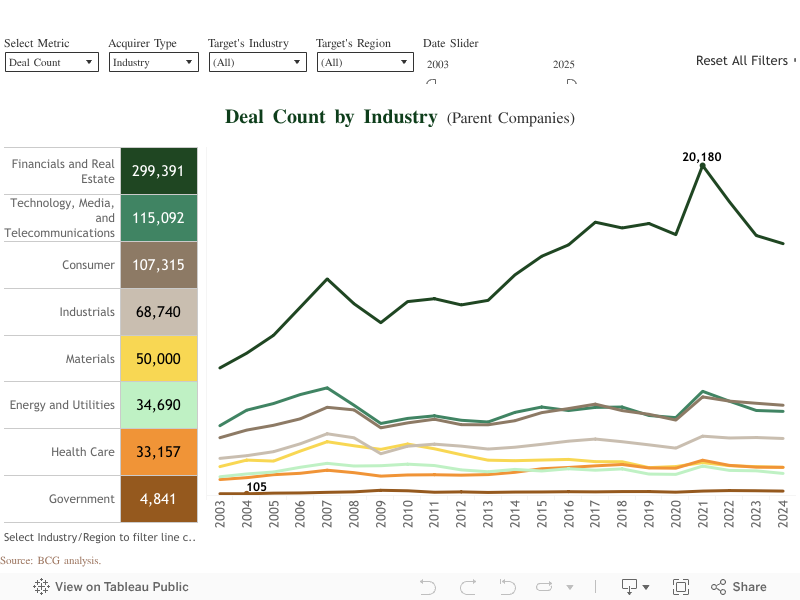
Explore Corporate M&A Activity by Year
The dashboard enables you to easily track M&A activity by year and explore patterns across different industries and regions.
Bimonthly Newsletter Subscription
Perspectives on Strategy and Value: Learn how to lead with advantage
The 2025 M&A Report
In this year’s report, BCG’s M&A experts examine current M&A activity—globally and regionally. Then, they reveal how dealmakers can turn today’s uncertainty into a strategic advantage and examine the success factors for cross-border deals.

Article
October 28, 2025

Article
October 28, 2025
The global M&A remained volatile during the first nine months of 2025. BCG experts explore how recovery and dealmaking trends varied across ten regions.

Article
October 28, 2025
Our research reveals how savvy dealmakers navigate turbulent conditions to build long-term competitive advantage.

Article
October 28, 2025
Companies must navigate regulatory complexity, geopolitical volatility, and the challenges of cultural integration to drive exceptional growth and shareholder returns.
The 2024 M&A Report

Article
October 16, 2024
Global M&A activity remains below historical norms, even as activity has rebounded from last year’s trough.

Article
October 16, 2024
BCG experts in seven regions of the globe describe the state of play in their M&A market and share insights about near-term deal drivers.

Article
October 16, 2024
Top-notch deal teams collaborate with business units to identify targets, execute transactions, and expertly navigate a minefield of risks.

Article
October 16, 2024
A BCG study finds that timelines for deal closure have lengthened, especially for larger transactions.
Explore BCG’s Past M&A Reports
Since our first annual M&A report in 2003, we have complemented our analyses of M&A activity and trends with strategic insights into how companies can create value from mergers, acquisitions, and divestitures. The reports have covered a broad range of macroeconomic environments and industry perspectives, focusing on both traditional and alternative deal types. Across the reports, our analyses pinpoint what infrequent dealmakers can learn from their more experienced counterparts’ success.
View the M&A Report Archive
The 2023 M&A Report: Bold Moves for Dealmakers in Volatile Markets
The 2022 M&A Report: Dealmaking Remains Active as Dark Clouds Form
The 2021 M&A Report: Mastering the Art of Breaking Up
The 2020 M&A Report: Alternative Deals Gain Traction
The 2019 M&A Report: How to Master M&A in a Downturn
The 2018 M&A Report: Synergies Take Center Stage
The 2017 M&A Report: The Technology Takeover
The 2016 M&A Report: Masters of the Corporate Portfolio
The 2015 M&A Report: Increasing Returns with M&A
The 2014 M&A Report: Don’t Miss the Exit
Winning at M&A in Emerging Markets: BRICs Versus Mortar? [2013]
Riding the Next Wave in M&A: Where Are the Opportunities to Create Value? [2011]
Seize the Opportunities in M&A: Accelerating Out of the Great Recession [2010]
Meet Our M&A Report Team
The authors of our annual mergers and acquisitions reports examine M&A activity by year to spotlight trends and opportunities. Meet some of our M&A experts.


How We Track M&A Activity by Year
During the first nine months of 2025, BCG’s Transaction Center conducted the research that underpins The 2025 M&A Report, our latest edition of BCG’s annual publication.
Data Sets
BCG’s M&A research data set (the “M&A database”), which we used as the basis our analyses, comprises approximately 1,033,000 M&A deals covering the period from January 1980 through September 2025. For our assessment of general market trends, we analyzed reported M&A transactions from 1990 through the first nine months of 2025. For our analysis of deal values and volumes, we excluded transactions marked as self-tenders, recapitalizations, exchange offers, repurchases, privatizations, and spinoffs.
In addition to using our proprietary data and analytics, we collected and collated financial data and relied on information from various data providers, including LSEG Workspace, LSEG DataStream, and S&P Capital IQ.
In addition to using our proprietary data and analytics, we collected and collated financial data and relied on information from various data providers, including LSEG Workspace, LSEG DataStream, and S&P Capital IQ.
Short-Term and Long-Term Value Creation
Short-Term Value Creation
Although analyzing different issues required us to use distinct samples, we employed the same econometric methodology to all return analyses.
To determine the “announcement return,” we derived the cumulative abnormal return (CAR), by taking the difference between the actual return on the acquirer’s stock () and the return realized in the sector index () as an approximation for expected returns, starting three days before the announcement date (–3d) and ending three days after it (3d). (See Equation 1.)
EQUATION 1
Long-Term Value Creation
For M&A deals, we tracked the stock market performance of the acquirers or the sellers over periods of different length following the acquisition announcement. We could not track the targets because, in most cases, they are delisted from the public equity markets.
First, we measured the total shareholder return (TSR) generated by the acquirer or seller over a time period of length t. (See Equation 2.)
EQUATION 2
Second, we subtracted from the TSR the return that a benchmark index delivered over the same period, in order to find the relative total shareholder return (rTSR) that the acquirer or the seller generated—in other words, the return in excess of the benchmark return.
1
1
(See Equation 3.)
EQUATION 3
We could not include all deals in this analysis because, for some deals, the time elapsed since the announcement was too short to allow us to calculate the returns.
1. The benchmark indexes we applied are the relevant worldwide Refinitiv (formerly Thomson Reuters) indexes.
Although analyzing different issues required us to use distinct samples, we employed the same econometric methodology to all return analyses.
To determine the “announcement return,” we derived the cumulative abnormal return (CAR), by taking the difference between the actual return on the acquirer’s stock () and the return realized in the sector index () as an approximation for expected returns, starting three days before the announcement date (–3d) and ending three days after it (3d). (See Equation 1.)
EQUATION 1
CARacq = P3d,acq / P− 3d,acq − P3d,index / P−3d,index
For M&A deals, we tracked the stock market performance of the acquirers or the sellers over periods of different length following the acquisition announcement. We could not track the targets because, in most cases, they are delisted from the public equity markets.
First, we measured the total shareholder return (TSR) generated by the acquirer or seller over a time period of length t. (See Equation 2.)
EQUATION 2
TSRt,acq = (Pt,acq / P−3d,acq)1/t − 1
TSRt,index = (Pt,index / P_ 3d,index)1/t − 1
Second, we subtracted from the TSR the return that a benchmark index delivered over the same period, in order to find the relative total shareholder return (rTSR) that the acquirer or the seller generated—in other words, the return in excess of the benchmark return.
EQUATION 3
RTSRt,acq = (1 + TSRt,acq)/(1 + TSRt, index) − 1
We could not include all deals in this analysis because, for some deals, the time elapsed since the announcement was too short to allow us to calculate the returns.
1. The benchmark indexes we applied are the relevant worldwide Refinitiv (formerly Thomson Reuters) indexes.
Statistical Significance of Our Results
We applied common-practice statistical significance tests to all of our quantitative results in this report. To assess whether means differed statistically from zero, we used one-sample t-tests; where appropriate, we used two-sample t-tests to determine whether the difference between means differed significantly from zero—that is, whether two groups did in fact have different means.
Generally, for longer-term analyses (such as for one- and two-year rTSR) and for the short-term analysis (that is, for CAR), we used relative measures of size impact (such as deal value compared to the enterprise value of the acquirer) as well as absolute measures of size (such as deal value) to determine whether a transaction was sufficiently material to have had an impact on overall performance.
Generally, for longer-term analyses (such as for one- and two-year rTSR) and for the short-term analysis (that is, for CAR), we used relative measures of size impact (such as deal value compared to the enterprise value of the acquirer) as well as absolute measures of size (such as deal value) to determine whether a transaction was sufficiently material to have had an impact on overall performance.
The authors are grateful for the support provided by Paderborn University.


