Health care payers and providers have access to more data than the vast majority of organizations. So why hasn’t more been done with that data to slow the rapid climb in health care spending and begin competing on outcomes rather than expenditures?
The answer is that, despite the promise of electronic medical records, much of the data that reveals what works in health care has been inadequate and unusable—or is missing altogether. What’s more, organizational silos have made it difficult to link together pieces of information to show health-related patterns for any given patient group.
Policy makers and industry leaders in most countries are trying to shift to newer reimbursement and delivery models, such as payment by results, episode-based payment, and value- and population-based health care. These models demand much more detailed insights into what drives outcomes than previous ones did. They also require significantly different data sources in order to tease out the impact of a current treatment and its associated expenditures from other variables, such as treatments already performed, genetics, risk factors, patient behaviors, and the environment. (See Competing on Outcomes: Winning Strategies for Value-Based Health Care , BCG Focus, January 2014.)
Big data and advanced analytics, used intelligently, provide an opportunity to bring together diverse data sources—including patient records, clinical trials, insurance claims, government records, registries, wearable devices, and even social media—to understand health in a truly value-oriented way. Payers and providers—and, by extension, all health-care consumers—can now discern the extent to which each intervention, as well as its associated expenditures, contributes to better health.
Three High-Potential Opportunities
Data can transform health care in seemingly endless ways. But are these future scenarios real?
Most areas of health care are in the early stages of using big data and advanced analytics; many more sources of data and ways to combine and analyze information will emerge. Still, based on our work with payers and providers across many countries, we see three particular opportunities among many that offer high potential right now. Exploiting them could measurably improve outcomes as well as generate significant additional revenues and profits.
Optimizing Care for Patient Populations. Governments and other integrated payers and providers often lack a comprehensive view of complex usage, needs, and outcomes trends at the local, regional, or national level. This is particularly true for chronic diseases, which consume most health-care resources in the developed world.
To achieve the greatest improvement in outcomes, payers and providers need to proactively allocate resources before patients seek care and then track their impact. But to do this well, data needs to be comprehensively aggregated and analyzed at the level of large populations. The data can be used to target services more directly to the area of need, reduce waste, and redirect spending to effective interventions.
Consider the case of the department of health for the state of Victoria in Australia, which undertook a major effort to analyze health care spending on citizens. Federal and state governments, along with private insurers, each pay for about one-third of third-party health-care spending for every individual in Australia. But they have little visibility—and no control over—one another’s expenditures, which allows for the possibility of duplication and gaps in services. With overlapping responsibilities, governments and insurers cannot link together the need for services, the level of care being delivered, and the outcomes of those services. Not surprisingly, no payer or provider is prepared to be accountable for outcomes, and data for comparing outcomes among citizens is not available.
The health department wanted to create an integrated picture of health care across the state of Victoria by combining data about health needs from population surveys with information about services paid for by each of the responsible payers and with outcomes data from patient, population, and clinical sources. Even though this data had been collected for some time, the complexities of aggregating and interpreting it had discouraged earlier efforts.
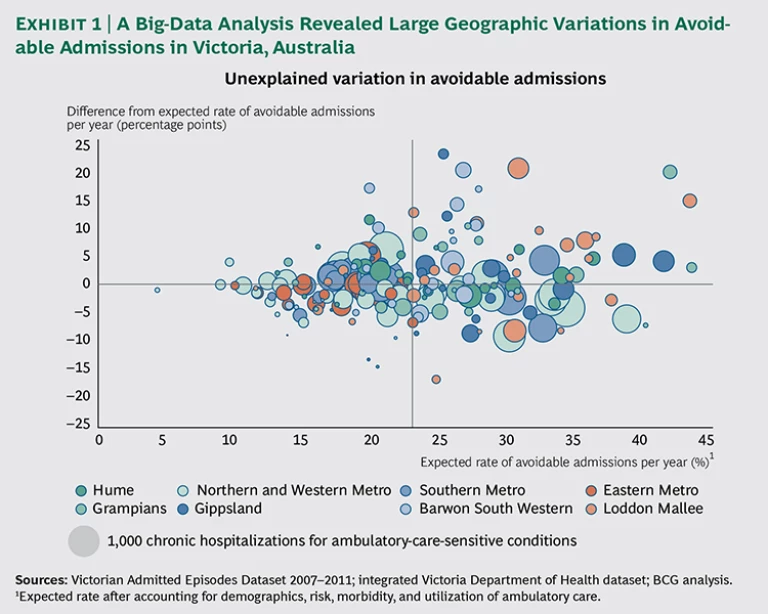
The health department developed a seven-step model of the natural progression of chronic diseases in order to organize the more than 400 health-related measures gathered. This was done at the city and neighborhood levels to pinpoint specific needs while still maintaining individual privacy. The department compiled a picture of health needs, service usage, and outcomes across 200 areas—each with a population of around 25,000—to identify areas of over- and undersupply and to assess the effectiveness of the health services they received.
The state learned, for example, that while primary-care providers are quite effective in managing chronic diseases in more affluent communities, they are relatively ineffective in low-income communities, resulting in high costs, hospitalization rates, and mortality levels in those areas. The results of the analysis highlighted a number of neighborhoods with particularly poor chronic-disease outcomes, despite adequate access to and use of services, suggesting opportunities for quality improvements. (See Exhibit 1.)
The analysis looked at the rate of hospitalizations for ambulatory-care-sensitive conditions—which include illnesses such as diabetes, asthma, and chronic obstructive pulmonary disease—because hospitalization serves as an important barometer of patient access to primary care in these cases. The department discovered that even a modest reduction in avoidable hospital admissions through better primary care would save health care payers an estimated A$60 million per year. In addition, it found that rates of screening colonoscopy in areas with high levels of private insurance were six to seven times the expected rates given the demographics, and outcomes were no better than in areas with low rates of screening, suggesting a significant opportunity to redirect resources and improve patients’ quality of life without adversely affecting population health. Reducing the Cost of Care. Payers, whether governments or private insurers, face a huge hurdle in bending the cost curve downward to slow the pace of growth in health care expenses. One area ripe for improvement lies in reducing the cost of care. Since the cost of care generally accounts for 90 to 95 percent of total costs for an efficient payer, every 1 percent reduction in the cost of care has the same effect as a 10 to 20 percent reduction in operational costs.
Still, many payers consider the cost of care to be unchangeable. They routinely enter into contracts with hospitals based on historical budgets plus a small percentage increase for inflation growth. Frequently, they do not differentiate their negotiations by hospital. And they conduct only limited benchmarking about differences in costs or quality across hospitals and providers.
In the area of procuring care alone, we see enormous potential to drive down costs through the use of big data. A leader in this area is VGZ, one of the largest payers in the Netherlands, with about 4 million clients and a cost of care of about €10 billion per year. As a result of major investments in data-driven health-care procurement, the company has identified significant potential for improving quality while producing estimated savings of more than €500 million by 2016. One target was prescription drugs, which accounted for about 15 percent of costs. The company focused on prescriptions for generic drugs when they first became available off patent as a substitute for brand-name drugs. Often, generics cost less than 10 percent of branded medicines. An analysis showed that switching almost entirely to generics for just one cholesterol-controlling drug, Lipitor, would save more than €30 million.
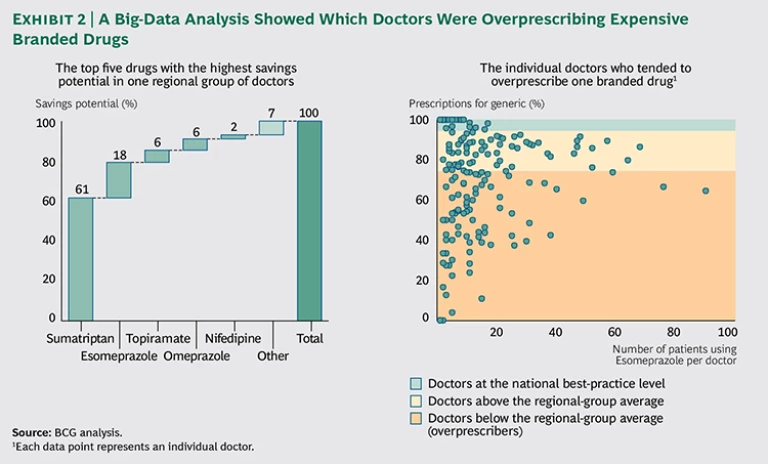
In most countries, pharmacies are obliged to deliver a generic drug instead of a branded drug. But prescribers can state that medical necessity requires the patient to receive the expensive branded drug instead. Since the active ingredient in generics is the same as in branded drugs, prescriptions for a branded drug on the grounds of medical necessity should be rare—for example, less than 5 percent of prescriptions, according to calculations based on best practices. In practice, however, VGZ found that for a number of important drugs, the expensive branded version accounted for approximately 30 percent of prescriptions. In an effort to bring up the rate of generic adoption among doctors much more quickly, the payer decided to use its own records to pinpoint exactly who appeared to be overprescribing branded drugs.
First, VGZ brought order to millions of rows of chaotic, raw claims data by using advanced analytical techniques to unravel the prescription patterns of every doctor and specialist by drug. The company looked in particular for anomalies and outliers that indicated overprescribing behavior by specific doctors and groups and unusual combinations of prescribers and prescriptions. The analysis focused on the top 25 medicines with the greatest potential for reducing prescription drug costs. A compelling visualization showed the prescribing behavior of groups of doctors and, when required, the prescribing behavior of individual doctors as well. For the first time, the payer could show groups of doctors how the behavior of their members compared with best practices. Extreme outliers were highly visible. (See Exhibit 2.)
This visual tool created an opportunity for the payer to have constructive discussions with providers and to improve their prescribing behavior. The focus on costs helped bring down the rate of branded-drug prescriptions to below 5 percent for nearly all the drugs studied, saving the payer more than 10 percent of total pharmaceutical costs. Similar benchmark analyses are now being used in other areas, such as diagnostics, hospital contracting, and claims verification. For instance, VGZ has developed advanced analytic algorithms to automatically analyze millions of lines of data across different areas of care in order to highlight suspicious combinations of treatments and instances in which medical specialists seem to choose the most complex or expensive treatments. Reducing Hospital Readmissions. Health care organizations frequently struggle to capture, integrate, and share valuable information among internal departments and external partners. But organizational and technological barriers often prevent payers and providers from seeing the big picture, which would enable them to transform the cost and quality of care.
Many people hoped that electronic medical records (EMRs) would solve these problems. But traditional EMR systems do not provide much of the data required to assess outcomes and behaviors, such as socioeconomic status and health patterns within populations—obesity and smoking rates, for example. Another problem is that 80 percent of hospital data is unstructured, often taking the form of patient interviews and paper-based records, which may be stored in incompatible systems by different organizations. Claims data may be readily available but is typically poorly structured and inconsistent. Privacy regulations also limit how data is combined and used.
Integrating disparate data sources, as is done with big data, can overcome these hurdles. A large government-run hospital trust in the UK, for example, achieved powerful results with this approach. The trust wanted to decrease readmissions by 5 percent within a year and thereby reduce the length of hospital stays, the number of preventable deaths, and the incidence of hospital-acquired infections. The move would also help hospitals avoid the significant financial penalties imposed by regulators for high rates of readmission.
The hospital trust first combined existing internal data about patients and locations with publicly available data. This enabled the trust to identify factors—such as specific diagnoses, wards, and times of discharge—that were associated with higher-than-expected readmission rates.
Next, the trust developed a predictive algorithm that could identify—at the time of admission—the groups of patients who were most at risk of readmission. Identifying those patients at such an early stage meant that providers could do the most to lower the odds of readmission by adjusting staffing levels, planning for medical reviews on discharge, and arranging training for patients about their drug regimens after discharge. For instance, the provider learned that information such as the age of the patient, the length of any previous stays, the time of admission, the reason for the hospital visit (such as an elective procedure or an emergency), and whether there were any previous emergency admissions could be combined to create a highly predictive profile of patient risk. The profile was then converted to a color-coded system that was easy to understand so the staff could quickly set in motion the right approaches upon admission.
The trust also identified four groups of patients with high numbers of avoidable readmissions and devised tailored interventions to address their needs. For example, when the trust found that 50 percent of urology readmissions occurred within one day of discharge, it established a program for educating patients on proper catheter use, supported by rapid-response community nursing.
As a result of the hospital trust's use of these tactics and others, preventable readmissions have fallen, and the approach is now being rolled out across the trust.
How to Begin
As payers and providers explore the opportunities enabled by big data, they should take the following initial steps.
- Start where there is tangible value. Small steps combining existing data in new ways to solve specific issues can have more immediate impact than big-bang solutions that try to do everything. EMR systems and data warehouses are not always the best places to start, either because they do not have the most relevant information about outcomes or because a more iterative and agile approach could capture value more quickly. Some of the most interesting initial insights can be gleaned from creating segmentations and population-level analyses of existing information, such as the age of patients and referral patterns.
- Focus on the patient—not on the institution. Care delivery is a complex, multidimensional process involving many providers. For chronic diseases, it can span a lifetime. Providers spend considerable time and energy reducing budgets and optimizing processes. The patient perspective is often missing, however. To generate new insights, organizations need to understand the novel sources of data that offer insights into groups of patients. Often that data lies beyond the four walls of the hospital, such as with patients themselves.
- Ensure trust. Health information is often quite sensitive and involves important legal and regulatory constraints about its management and use. Health care providers cannot afford to lose the trust of regulators and patients. To earn trust and gain access to even greater amounts of personal data for big-data applications, payers and providers must communicate transparently how they use and secure confidential data across multiple organizations and demonstrate the important benefits to patients from emerging big-data approaches. (See The Trust Advantage: How to Win with Big Data , BCG Focus, November 2013.)
- Develop analytic capabilities to improve costs, value, and the coordination of care. Most payers and providers have pockets of expertise in clinical processes and IT but require additional capabilities to generate integrated insight and improvements in practice. They must bring together a combination of skills in order to find related internal and external sources of population-level data and to work with emerging tools. They may need to create new partnerships or work within new ecosystems to source, combine, and explore data across multiple organizations and locations.
Big data and advanced analytics offer tremendous potential to solve some of health care’s thorniest problems—if the industry can overcome significant barriers to improving its efficiency and effectiveness. Today’s data-rich world offers vast new potential. The key to success lies in focusing on pragmatic steps that drive real value instead of chasing the latest fads.


