Powerful footfall data can provide visibility into dealership performance for automotive OEMs and large dealership groups—if you know how to look at it right.
Technology has changed business in so many ways around the world, yet cars are still sold the same way they have been for decades. Salespeople meet customers face-to-face on the lot, local dealers own the client relationship, and they run their businesses independently. Meanwhile, car makers spend billions on advertising but have limited visibility into how the spending impacts buying patterns and retail performance.
In a global environment where data-based customer insights are becoming important for economic survival in many industries, automotive OEMs and large dealer groups are operating with an information gap—it’s a bit like driving blind.
Automotive OEMs and large dealer groups are operating with an information gap—but footfall analytics can change that.
One answer is to reconfigure the industry sales model, as Tesla is attempting to do with its own direct-to-consumer dealerships. In Europe, companies like Mercedes and Volvo are also taking this approach, but establishing these dealerships will take time and a lot of money.
What if there were a solution that could deliver data-based insights and help improve productivity without the gargantuan effort of upending entire industry models? What if there were a way to gain a significant edge in a mature sector where competitive traction is hard to come by and even a small advantage can make a big difference?
Boston Consulting Group has developed a method for analyzing available data that shows how many people visit and purchase cars from a particular dealership. Through a creative merging of publicly available data, it’s now possible to access an information goldmine previously unknown.
The analysis is based on footfall data, which is foot-traffic information from mobile phone geodata (individuals are aggregated to anonymous data points, so no personal information is revealed). When used in combination with other information, footfall data tells the story of what dealerships people visit and is a reliable proxy for sales conversion rates. Automotive OEMs and large dealer groups can use these analytics in many ways to gain powerful insights into sales performance, competitor strength, and the effectiveness of marketing investments.
Conducting the Footfall Analysis
BCG and PlaceSense, an Israel-based data provider, collected and analyzed the footfall data for the major automotive brands in Germany, in 2019, 2020, and 2021.
Sources and Methods
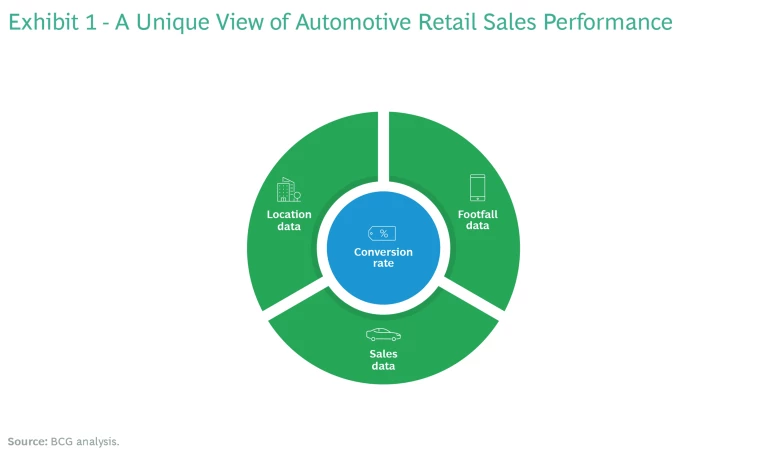
To measure dealership performance, we evaluated three independent sources of information: the geodata points from 10 million mobile phones, land registry data for 36,000 buildings, and official car registration data. (See Exhibit 1.)
After validating the mobile phone data and the building footprints, we combined them to capture only the people entering dealerships. We also confirmed that the data represented unique visitors, and, using logic based on duration and timing, we filtered out employees and after-hours visits.
We analyzed the data on the 5.8 million new cars registered with the German auto registry office to determine how many cars each dealer sold.
By combining the registration numbers with the dealerships’ building footprints, we were able to establish the point of sale for every car. Adding the footfall metrics per building into the equation allowed us to determine the number of visitors, number of cars sold, and conversion rate (the number of visits that are converted to sales) for each dealer. We used these findings to rank the individual dealers’ conversion rates so that we could compare the sales performance of different dealers of the same brand or across brand dealer networks.
Findings
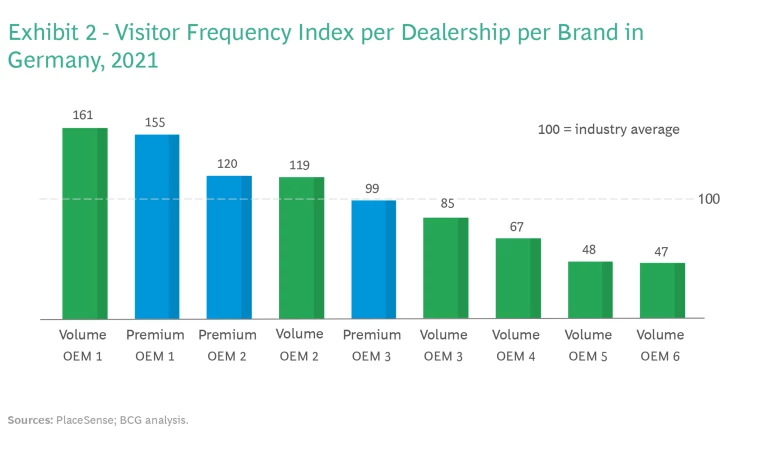
Our analysis revealed that the top brand attracted more than triple the number of visitors per dealership as did the bottom brand. (See Exhibit 2.)
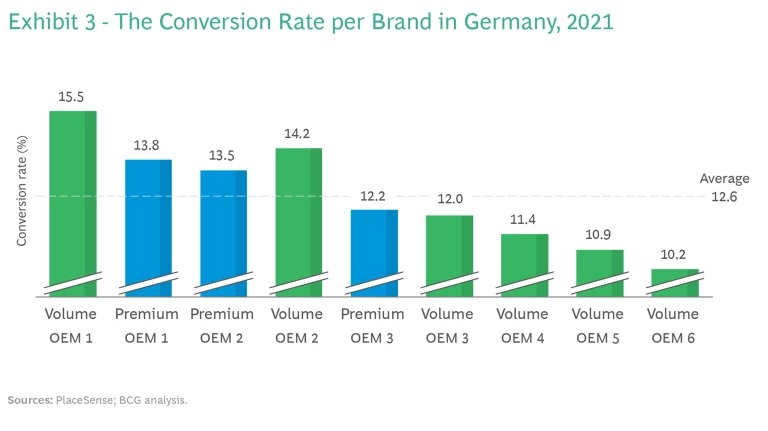
The top performer, a volume brand, had a conversion rate of 15.5%, while the next two brands (one premium, one not) came in at around 14%. The brands on the bottom, all volume brands, had conversion rates of 10% to 12%. (See Exhibit 3.)
In the intensely competitive car-sales business, success is a game of inches, and a seemingly small conversion advantage can make a big difference. Even more valuable is knowing what influences foot traffic and conversion rates and how to improve them. A dealer with a slight competitive sales edge has more to spend on advertising or other strategic investments and stands to widen its lead over time.
As the exhibits demonstrate, the three OEMs that had the fewest visitors per dealer also had the lowest conversion rates. But this doesn’t necessarily mean their sales performance is subpar. In this case, the three OEMs with the fewest visitors have some of the biggest store networks and are relying on a large market presence rather than a strong sales conversion rate.
These are just a few of the ways footfall analytics can drive insights. To assess the underlying drivers of conversion in greater detail, OEMs can combine the results with their own data (on car models, dealership characteristics, or sales staff) to create meaningful metrics. They can then gain insights into the types of cars that are available in different locations and how well they are converting, and subsequently optimize the setup of each dealership.
Some of this type of analysis can be achieved through established benchmarking techniques. But benchmarking can be expensive, time-consuming, and limited to the companies that participate in the survey. Benchmarking provides only a point-in-time snapshot, and the data quality can vary. By contrast, footfall data analytics can be conducted on an ongoing basis over an indefinite period and across a wide population of competitors and brands. The data is more detailed and more reliable and can be used in numerous ways.
Powerful and Versatile Analytics
In addition to providing visibility into store performance, footfall analytics can be used in many different areas.
Marketing
OEMs and large dealer groups can use footfall analytics to assess their overall conversion rate against that of their competitors. They can also assess the performance of different dealerships.
Return on Investment. Footfall analytics can be used to understand the effectiveness of the marketing budget and optimize it accordingly by providing visibility into ROI and rebate steering. OEMs and dealer groups can measure the impact of promotions on dealership visits and conversion performance to understand how much these activities boost their sales—and lower competitors’.
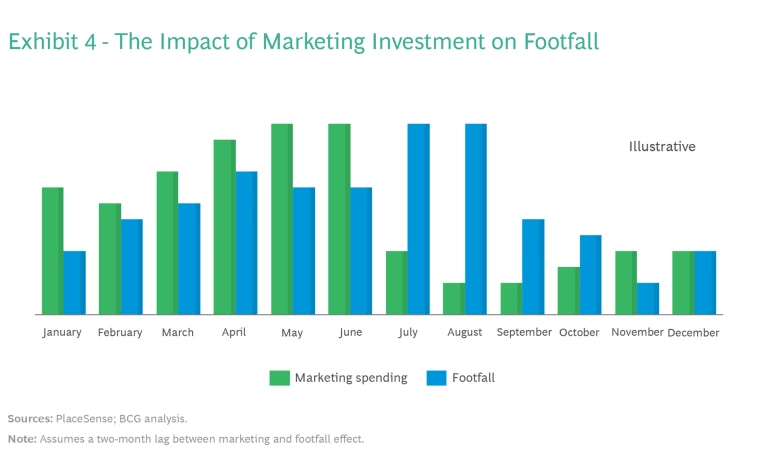
For example, during the second quarter of 2021, a dealer group in Germany increased marketing spending by 50%. Our footfall data analysis showed that the additional investment drove a 57% jump in dealership visits in the months that directly followed. (See Exhibit 4.) Conversely, when the dealer group reduced this spending by 67% in the third quarter, visits dropped 64%.
Footfall data can also be used to improve investment decisions.
Budgeting. Footfall data can also be used to improve investment decisions, capital and otherwise, across the sales and service network. Dealer groups could understand what capital or marketing investments are having the biggest impact and repeat them or could prioritize ad spending in dealership locations that bring the greatest returns.
In addition, it’s now possible to predict the effectiveness of marketing investments before implementation. A machine-learning model can forecast how much foot traffic will grow if marketing spending is increased and how much it will shrink if spending is decreased.
Branding. Insights powered by footfall analytics can improve branding decisions as well because dealers now have the ability to measure the impact that advertising has on dealership foot traffic in a particular region. For example, an SUV crossover vehicle could be positioned as a sleek urban vehicle in one region and a mountain-climbing SUV in another.
Supply Chain
Footfall analytics offer another valuable benefit: they can inform supply chain decisions. If, for example, visitor traffic in certain dealerships is higher than expected, that data can be used as a market signal to avoid stockouts or unnecessarily long delivery times. In addition, dealers can mine this information to gather insights for different regions and individual models.
Network
Using the comprehensive insights across multiple dealerships, footfall analytics can also help to optimize the dealership network footprint by identifying whitespace and understanding where the competition has an exceptionally strong conversion rate. The information can help determine whether to increase physical presence in strategically important regions. Conversion performance data should be considered when valuing potential acquisition targets as well.
Electric-Vehicle OEMs
Footfall analytics can be useful for EV manufacturers, even though their dealerships typically serve as lead-generating showrooms and do not conduct sales transactions. For these OEMs, foot traffic can provide valuable intelligence on how effectively a dealership is positioning the brand. The data is also helpful when identifying the best locations for new dealerships and making other go-to-market decisions.
Automotive OEMs and large dealership groups can greatly improve the effectiveness of their marketing spending with better information about the comparative sales performance of independent car dealerships. The method, developed by BCG, uses footfall analytics to compare data from mobile phones with land registry and car registration information to identify sales traffic volumes and sales conversion rates. The information could enable companies to improve decision making in areas from marketing to supply chain spending.
We thank Jan Barenhoff, Eyal Laxner, Philipp Kohn, Yuhang Lu, Quan Nhon Vuong, Rishit Aakash, Julia Heskel, and Pascal Bruckner for their contributions to this article.


