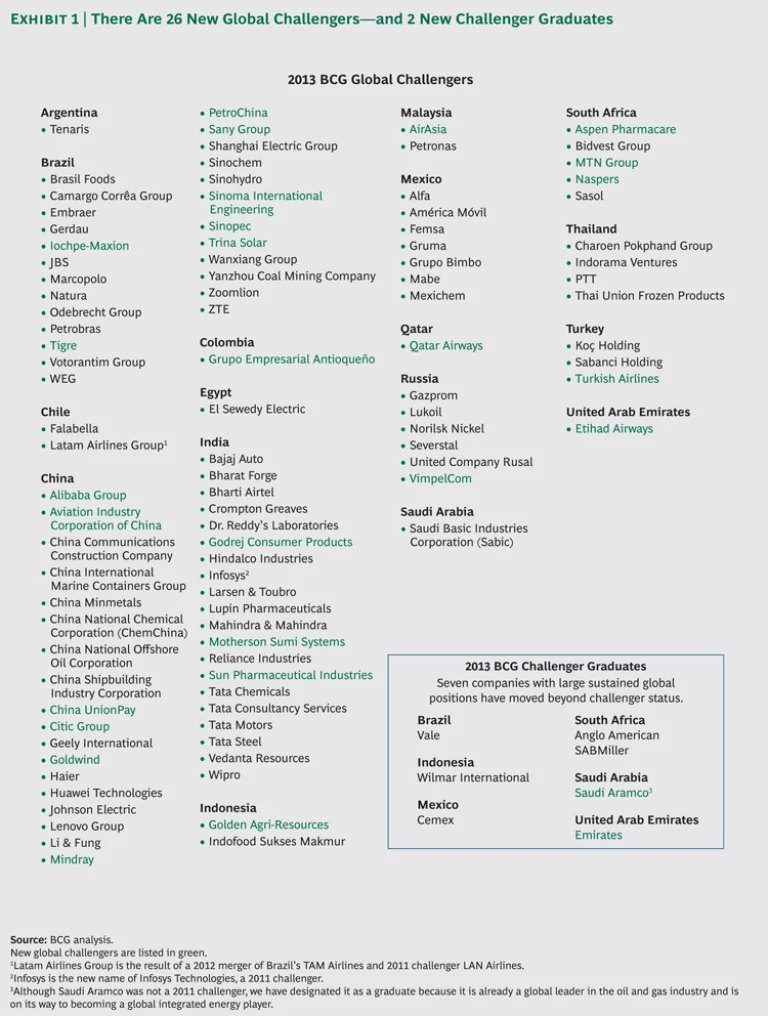
The 2013 BCG global challengers are 100 companies from rapidly developing economies (RDEs) that are both growing and globalizing quickly. This is the fifth time since 2006 that BCG has compiled a list of global challengers, and this group is the most diverse yet, with wider geographic and industrial breadth than ever before. (See Exhibit 1.) They are hard at work transforming themselves into global champions. (For details on the selection criteria, see “Methodology for Selecting the BCG 2013 Global Challengers.”)
Methodology For Selecting the BCG 2013 Global Challengers
We began our analysis by compiling a list of potential global challengers from companies based in RDEs. As in the 2011 report, we focused on companies located in developing Asia, central and eastern Europe, the Commonwealth of Independent States, the Middle East, Latin America, and Africa.
Our initial master list of potential global challengers was drawn from local rankings of the top companies in the geographic markets listed above. As in previous years, we excluded joint ventures and companies with significant overseas equity holders but included state-owned companies that compete internationally. A few of the global challengers are headquartered in global financial or commercial centers, such as London or Amsterdam but their operations take place primarily in RDEs. We have listed these companies in the markets that house most of their operations.
Next, we applied a set of quantitative and qualitative criteria. Companies needed to have annual revenues of at least $1 billion, a threshold that ensures they have the resources to go global. We sought companies in which overseas revenues either totaled 10 percent of total revenue or $500 million. In export-oriented industries, such as mining, oil, and gas, we also required companies to possess overseas assets of at least 10 percent of total assets or $500 million. We made a few exceptions when we strongly believed that companies would meet these thresholds in the next two years. A final set of quantitative measures were related to growth and performance.
We sought companies with credible aspirations to build truly global footprints, excluding those that could pursue only export-driven models. Accordingly, we analyzed each company’s international presence, the number and size of its international investments, M&A activity over the past five years, and the strength of its business model. We also compared the size of each company with the size of other challengers and multinational competitors in its industry.
We based our final selection on these criteria and feedback from industry experts around the world.
The Challengers by Country
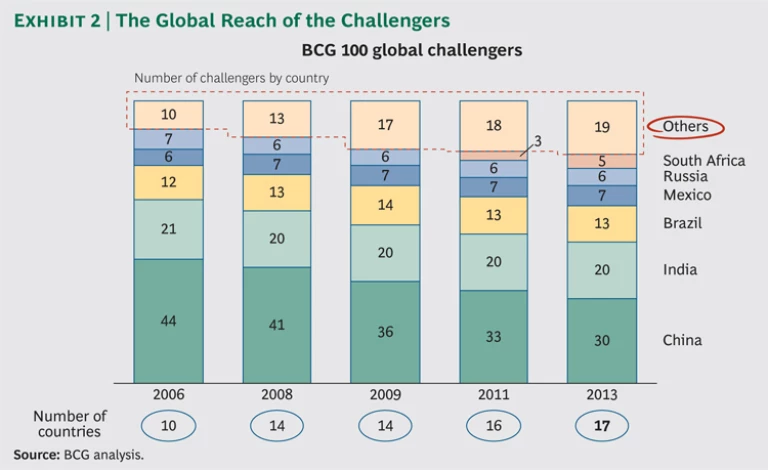
The 2013 BCG global challengers are from 17 countries, 7 more than in 2006. (See Exhibit 2.) As in previous years, China and India boast the highest numbers, with 30 and 20 global challengers, respectively.
Brazil is next with 13, followed by Mexico, with 7, and Russia, with 6. South Africa increased its number of challengers from three in 2011 to five in 2013. Malaysia, with two, and Turkey, with three, increased their number of BCG global challengers by one each. The BRIC nations (Brazil, Russia, India, China), once home to 84 challengers, are now down to 69. Many markets beyond the BRICs are now producing global challengers as well.
The Challengers by Industry Sector
The span of industries represented on the 2013 BCG global challenger list is widening. The new list includes representatives from the financial services (Citic Group and China UnionPay), health care equipment (Mindray), and electronic commerce (Alibaba Group) industries.
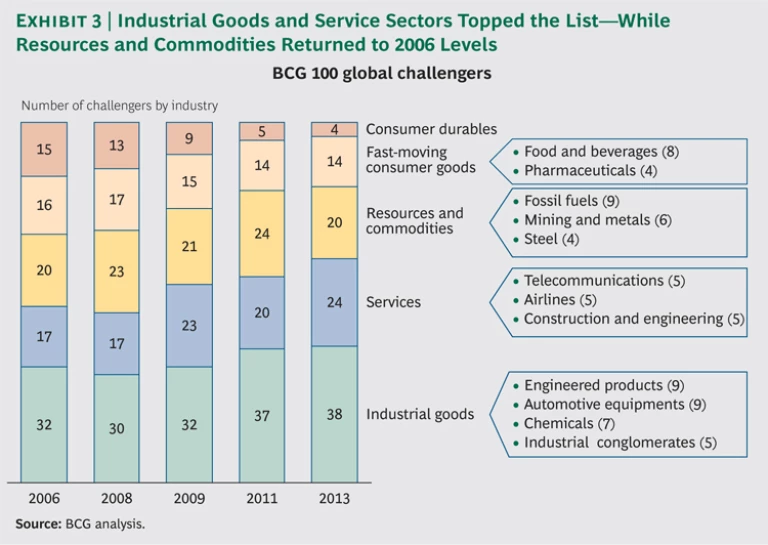
But the list is still heavy on industrial-goods companies (38) and resource and commodity companies (20), which account for twice the share of the challengers list than these industries occupy on the S&P 500. The services sector, with 24 entries, is still underrepresented compared with the S&P 500 index. (See Exhibit 3.)
Value Creation: A Tale of Two Eras
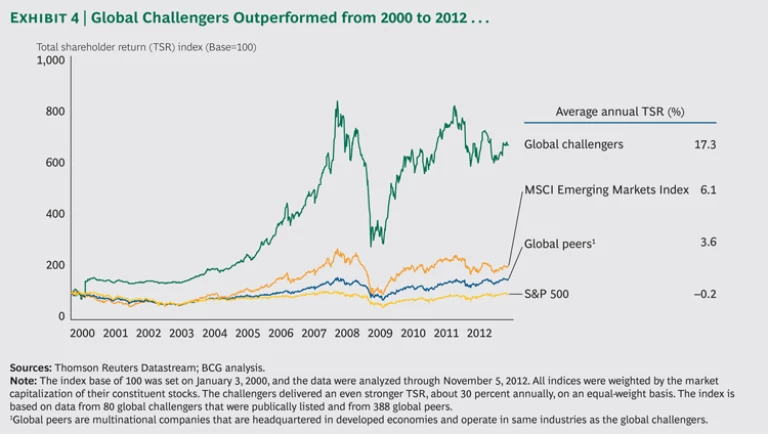
Global challengers have generated long-term value for their shareholders. Over the past 12 years, they have outperformed the S&P 500, the MSCI Emerging Markets Index, and their global peers (multinationals from the same industry and based in a mature market). Their average annual TSR of 17.3 percent is nearly 3 times greater than that of the MSCI Emerging Markets Index. The average annual TSR of the S&P 500 and global peers, by comparison, is negligible. (See Exhibit 4.)
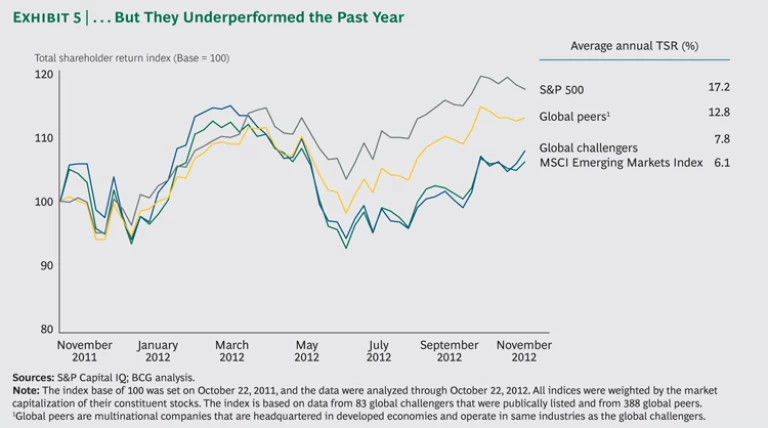
The picture changes dramatically when the time frame is compressed to the past year (from late October 2011 to November 2012). During that time, the S&P 500 and global peers both outperformed the global challengers by wide margins, while the challengers barely beat the MSCI Emerging Markets Index. (See Exhibit 5.)
This recent weakness has at least two explanations. First, the global challengers bounced back earlier from the global financial crisis, while the recovery of companies based in mature markets has been much more recent. Second, declining stock prices of several large challengers in the commodities sector have pulled down the average, masking the relatively strong performance of smaller players.
New BCG Challengers
Among the most interesting challengers are the 26 newcomers to the 2013 list. They are grouped by the features that help describe their entry to the list of global challengers.
Caring for and Feeding a Growing Middle Class
Aspen Pharmacare (South Africa) is the largest generic-drug manufacturer in the Southern Hemisphere and has 18 manufacturing facilities located throughout the world. Its products reach more than 150 countries. In 2011, almost half of its $1.8 billion revenues were generated outside of South Africa. Aspen acquired 25 brands in Australia from GlaxoSmithKline for $268 million in 2012. Aspen has been one of the best-performing South African stocks with a three-year average annual TSR above 100 percent.
Golden Agri-Resources (Indonesia) is one of the world’s largest producers of palm oil. In 2011, 89 percent of its $6.0 billion revenues originated overseas. Over the past three years, Golden Agri-Resources has delivered average annual TSR of 14 percent, outperforming other market players.
Godrej Consumer Products (India) is a consumer goods company with leading home-care, personal-wash, and hair-care products. Its 2011 revenues reached $1 billion. Godrej has focused its acquisitions on emerging markets. Recent acquisitions include Megasari Makmur Group in Indonesia, Darling Group in Senegal, and Issue Group and Argencos in Argentina.
Grupo Empresarial Antioqueño (GEA) (Colombia) is a conglomerate with total 2011 revenues of $10.2 billion. Grupo Nutresa, Inversiones Argos, and Grupo de Inversiones Suramericana constitute the core of the conglomerate, in which members have ownership stakes in one another but do not have a central headquarters. GEA is expanding beyond its Latin America base, and its products are sold in more than 75 countries.
Mindray (China) is China’s largest medical-equipment manufacturer. It had 2011 revenues of $900 million, more than half of which were generated overseas. Mindray’s business model is built around low cost and innovation, allowing it to win market share from larger competitors.
Sun Pharmaceutical Industries (India) is a global pharmaceutical company with a strong presence in the U.S. generic markets. Its 2011 revenues reached $1.7 billion, 62 percent of which were generated overseas. It has achieved an average annual TSR over 100 percent for the past three years and has the largest market capitalization in the Indian pharmaceutical sector.
Making Financial, Commercial, and Digital Connections
Alibaba Group (China) is the largest e-commerce company in China, with 2011 revenues of $2.8 billion. Alibaba.com is the world’s largest online business-to-business trading platform for small businesses, while Alibaba’s Taobao Marketplace and Tmall.com are leading China-based consumer-to-consumer and business-to-consumer sites, respectively.
China UnionPay (China) is the world’s second-largest credit-card network by transaction volume. It reported 2011 revenues of $900 million. China UnionPay cards are accepted in 125 countries and are responsible for more than 80 percent of the cross-border transaction volume of Chinese credit cards.
Citic Group (China) is a conglomerate with 2011 revenues of $49.3 billion. Citic is active in M&A. Its subsidiary, Citic Securities, bought CLSA, an investment research and advisory firm, in 2012 for $1.25 billion. The acquisition strengthens the company’s analytical capability outside China. Citic also has strategic partnerships with global leaders such as Itochu and Deutsche Bank.
MTN Group (South Africa) is Africa’s largest mobile operator. It has 183 million subscribers and licenses in 21 countries across Africa and the Middle East. About 60 percent of its revenues originated outside South Africa.
Naspers (South Africa) is the largest media company in the developing world, with revenues of $5.3 billion in fiscal 2012. The company’s portfolio includes a 34 percent share of Tencent (China) and a 29 percent share of Mail.ru (Russia).
VimpelCom (Russia) is the world’s sixth-largest mobile operator, as measured by the number of subscribers. In 2011, 40 percent of its $20.3 billion revenues were generated in Russia, although the company is headquartered in Amsterdam. VimpelCom has also completed several large acquisitions, including the $6 billion purchase of Italy’s Wind Telecom and a majority stake in Egypt’s Orascom Telecom Holding.
Powering Future Growth
PetroChina (China) is the world’s largest publicly traded oil producer, with 2011 revenues of $313.3 billion. In the past two years, PetroChina has been on the acquisition trail, spending $3 billion with Royal Dutch Shell to buy Arrow Energy jointly and $1 billion to buy assets from Ineos Group.
Sinopec (China) is the largest producer and distributor of chemical products in China, with 2011 revenues of $397.4 billion. Sinopec conducted several major overseas transactions and investments in 2011 and 2012, including the $2.1 billion purchase of Daylight Energy, the $1.5 billion purchase of a 49 percent stake in Talisman, both of Canada, and the acquisition of a one-third stake in five shale-oil and gas basins for $2.2 billion from U.S.-based Devon Energy.
Goldwind (China) was the world’s second-largest wind-turbine manufacturer in 2011, producing 9 percent of the turbines worldwide. In 2011, Goldwind spent $56 million on R&D, or nearly 3 percent of its $2 billion in revenues. Goldwind has a presence in North and South America, Australia, Europe, Africa, and Southeast Asia.
Trina Solar (China) is the world’s fourth-largest solar panel manufacturer, with 2011 revenues of $2 billion. Trina Solar’s vertical integration helps to improve its efficiency and shorten product-development cycles. More than 80 percent of its sales are generated overseas.
Building and Driving the World
Iochpe-Maxion (Brazil) is the largest Brazilian manufacturer of wheels and chassis, with $1.6 billion in 2011 revenues. Iochpe-Maxion completed two major overseas acquisitions in 2012: the purchases of Grupo Galaz for $195 million and of Hayes Lemmerz for $725 million.
Motherson Sumi Systems (India) is one of the leading manufacturers of auto mirrors and other components, with 2011 revenues of $3.1 billion, 70 percent of which originate overseas. The challenger is a joint venture between Samvardhana Motherson Group of India and Sumitomo Wiring Systems of Japan. Unlike other Indian companies, Motherson Sumi has not slowed its pace of acquisitions. In 2011, Motherson Sumi acquired 80 percent of Peguform, the second largest supplier of vehicle door panels in Germany.
Sany Group (China) is the largest construction-equipment group in China and the
sixth largest globally, with 2011 revenues of $12.6 billion. In 2012, Sany acquired German equipment maker Putzmeister for $474 million.
Sinoma International Engineering (China) is the world’s largest provider for cement technology, equipment, and engineering services, with $4 billion in 2011 revenues. In 2012, Sinoma partnered with Dangote Cement of Nigeria to complete the biggest cement factory in sub-Saharan Africa.
Tigre (Brazil) is the world’s third-largest maker of PVC pipes, fittings, and accessories, with 2011 revenues of $1.6 billion. Tigre’s success is partly based on designing new products—500 are launched a year—to local market conditions.
Flying the Skies
Aviation Industry Corporation of China (AVIC) (China) is a state-owned aerospace and defense company, with 2011 revenues of $40.5 billion. AVIC is investing heavily to become a leading competitor in the commercial aircraft market. China is currently evaluating a $16 billion plan from AVIC to fund jet-engine research.
AirAsia (Malaysia) is Asia’s largest low-fare, no-frills airline and a pioneer of low-cost travel. It reported 2011 revenues of more than $1.4 billion and the lowest per-available-seat cost per kilometer traveled in the world. AirAsia’s recent orders for 375 planes from Airbus will allow it to take advantage of the rising demand for air travel.
Etihad Airways (United Arab Emirates) is the national airline of the United Arab Emirates. The airline, which began operations in 2003, carried 8.3 million passengers to 86 destinations in 55 countries and generated $4.1 billion in revenues in 2011. It has more than 90 aircraft on order, including 10 Airbus A380s, the world’s largest passenger aircraft. Etihad Airways holds equity investments in airberlin, Air Seychelles, Virgin Australia, and Aer Lingus.
Qatar Airways (Qatar) is the state-owned flag carrier of Qatar with more than 120 destinations throughout the world. In 2011 and 2012, Qatar Airways was recognized as the world’s best airline at the Skytrax World Airline Awards.
Turkish Airlines (Turkey) flies to more countries—91—from a single hub than any other carrier. It also has the goal to become the world’s largest airline by 2023. In 2011, 84 percent of its $7 billion revenues originated overseas.
Signs of Success: The Graduates
Two former global challengers graduated from the list, meaning that they have achieved sustainable leadership positions in their global markets. In 2011, the first time BCG designated graduates, there were five.
Emirates (United Arab Emirates) includes both Emirates airline (listed as a 2011 BCG global challenger) and a range of other portfolio companies, including dnata, a growing airport-services operator. Emirates airline, has reported 24 consecutive profitable years and has built a strong global brand. Its orders for the Airbus A380 superjumbo airliner exceed by three times that of any other carrier.
Saudi Aramco (Saudi Arabia) is the largest gas and oil company in the world. It has extensive Saudi Arabian operations. In its quest to become a global integrated energy business, it has ventures all across the world, including the U.S., China, Japan, South Korea, and Saudi Arabia.
The Capabilities Beyond Cost Advantage
The 2013 BCG global challengers are at a turning point in their individual histories—and in the history of the economic development of RDEs. Their cost advantage over competitors from mature markets is eroding. In response, they have been building new capabilities—such as manufacturing higher-quality products, harnessing their cash resources, and investing in R&D.
High-Quality Products. Many challengers are still low-cost companies, but this label is more likely to describe their business models than their product offerings. The Middle Eastern airlines, for example, operate low-cost structures while winning global awards for exceptional service and quality. The low-cost Ascend D1 quad from Huawei Technologies is among the fastest smartphones in the world.
Capital Availability. Challengers took advantage of low equity prices from 2008 to 2010 by completing hundreds of cross-border acquisitions that provided access to international assets and management. They remain well financed and possess the resources and scale to make significant strategic investments.
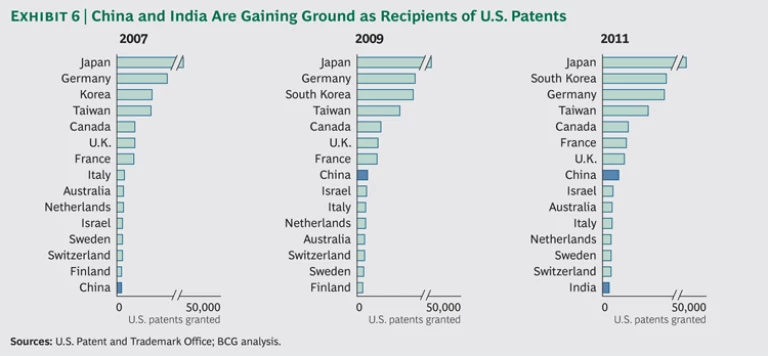
Innovation. Global challengers increasingly see the need to become more innovative and are rapidly increasing their research spending. About 46 percent of Huawei’s 150,000 employees are in R&D. Mindray generates more U.S. patents per revenue dollar than many global leaders. Many other companies in emerging markets are making similar moves. In 2011, companies from China were granted more U.S. patents than companies in Israel, Australia, Italy, Netherlands, Sweden, and Switzerland. India also ranked in the top 15 for the first time. (See Exhibit 6.)
Many of the innovations are aimed at creating new business models rather than tangible products. For example, Li & Fung Limited, a member of Hong Kong’s Fung Group, has pioneered an innovative role acting as a middleman between designers in developed markets and Chinese manufacturers. (See “Challenger-Led Innovation.”)
Challenger-Led Innovation
Companies in RDEs are getting serious about innovation. In the past five years, the number of patents granted by the U.S. Patent and Trademark Office to companies based in RDEs increased at a rate more than three times faster than that of companies in other countries. If this growth continues, up to 25 percent of the patents issued in 2018 may originate in RDEs—up from just 1 percent in 2006.
Patent growth in China and India is increasing by more than 30 percent annually. Overall, challengers are responsible for about 22 percent of the growth in patents issued to investors in RDEs—even though they represent less than 11 percent of the companies from RDEs that received U.S. patents in 2011. China’s Huawei Technologies broke into the top 100 patenting organizations in 2011 when it was issued 374 U.S. patents.
