Does corporate diversification destroy shareholder value? Investment analysts believe so, often applying a “conglomerate discount” to diversified companies by valuing them at less than the sum of their parts. Academic research has confirmed that diversified companies’ valuations suffer from a conglomerate discount by comparing their actual market value with the value implied by the matched portfolios of pure-play companies.
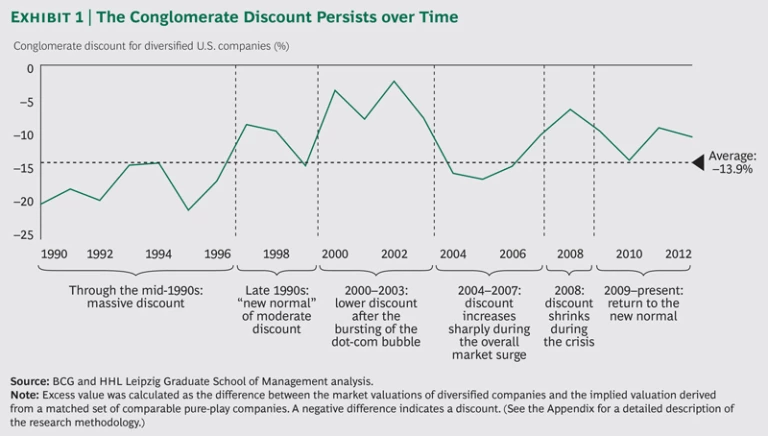
In a joint study conducted in the aftermath of the financial crisis, BCG and the HHL Leipzig Graduate School of Management found that the conglomerate discount shrank from 2005 through 2009. (See The Power of Diversified Companies During Crises, BCG report, January 2012.) But this reduction turned out to be only a temporary reprieve. Continuing our research, BCG and HHL’s latest study found that the conglomerate discount rebounded during the global economy’s tenuous recovery. Among companies publicly listed in the United States, the discount has increased to its precrisis range of –10 to –15 percent after shrinking to approximately –7 percent during the crisis. (See Exhibit 1.)
The discount may be particularly strong in North America. From 1998 through 2009, our previous study found an average conglomerate discount of –10.5 percent in North America compared with –5.9 percent in western Europe. In Asia-Pacific, more than half (55 percent) of diversified companies actually enjoyed a premium during the same period. While the discount shrinks during recessionary periods (such as the bursting of the dot-com bubble and the 2008–2009 crisis) and increases sharply during strong recoveries, it has persisted for decades. Simply put, the discount is not going away on its own. To improve their relative valuations, diversified companies need to find ways to overcome the discount. This effort begins with understanding what drives their undervaluation, a key focus of our research.
What Underlies the Conglomerate Discount?
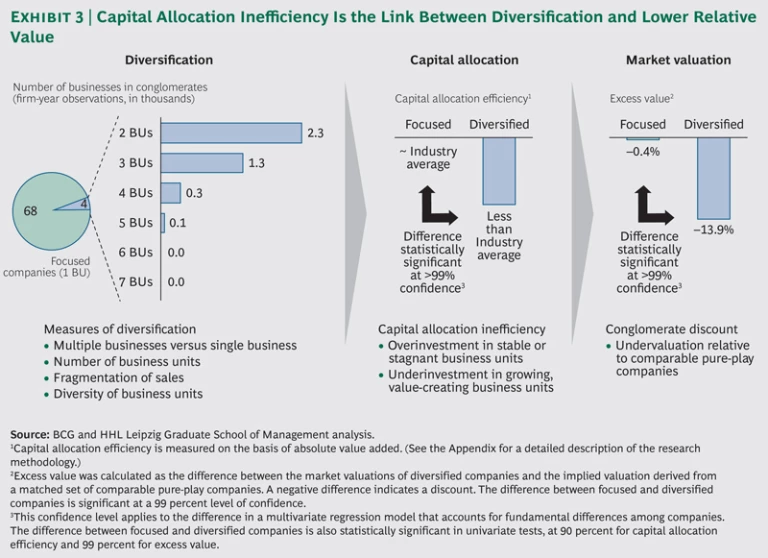
One variable stands out as strongly influencing diversified companies’ lower relative valuation: capital allocation efficiency. Companies allocate capital efficiently when they overinvest in attractive businesses with a market value that exceeds their asset value, or if they underinvest in less attractive businesses with a market value that is less than their asset value. When we compared the investment patterns of diversified companies with the industry averages of their pure-play peers, two key findings emerged: greater diversity of businesses negatively affects the efficiency of capital allocation among them, and this less efficient capital allocation negatively affects diversified companies’ relative valuation.
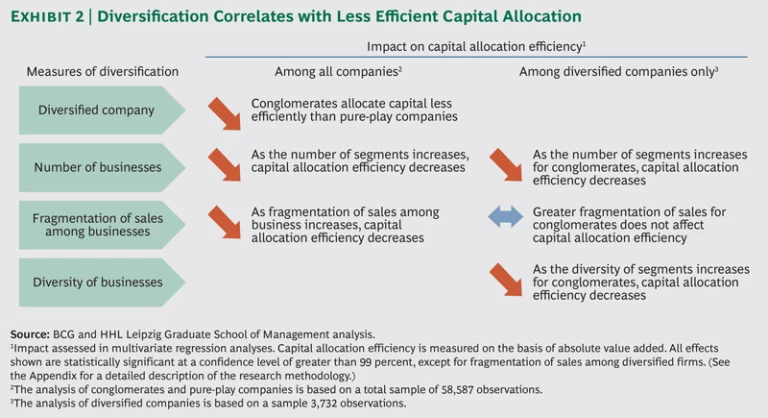
Diversity and Capital Allocation Efficiency. Diversified companies allocated capital less efficiently, on average, than pure-play companies in our study. (See Exhibit 2.) For the entire sample, companies with a larger number of businesses had lower efficiency in capital allocation. Notably, companies with greater fragmentation of sales among their businesses showed less efficiency in allocation than those with sales concentrated in their main businesses. Among diversified companies specifically, greater complexity—in terms of both the number and the diversity of businesses—reduced capital allocation efficiency. For these companies, concentration of sales in their main businesses was not a significant factor in maintaining high capital-allocation efficiency.
These findings suggest that the complexity of diversified companies makes it more challenging for them to allocate capital efficiently, resulting in overinvestment in large, stable, or stagnant business units and underinvestment in smaller, growing business units. Moreover, the most complex diversified companies face greater challenges in allocating capital, and having a few large business units or even one dominant business among many does not ensure efficient capital allocation. In fact, diversified companies may be biased toward allocating capital to larger business units—which are often their original core businesses and may have more clout or political power—despite declining growth rates and forecasts of lower profitability. Pure-play companies, in contrast, have a clearer view of individual opportunities for capital expenditures across the enterprise, and this greater visibility may foster better governance.
Capital Allocation Efficiency and Relative Value. All else being equal, companies with more efficient capital allocation are more highly valued, whereas lower efficiency in capital allocation significantly reduces relative valuation. This holds true for the overall sample of pure-play and diversified companies as well as for diversified companies in particular.
Other variables can be ruled out as the underlying cause of the conglomerate discount. EBIT margins are, on average, similar for pure-play companies (7.8 percent) and diversified companies (7.5 percent). Although diversified companies are larger (in terms of sales) and have a smaller ratio of cash to assets on the balance sheet compared with pure-play companies, these distinctions do not explain the observed differences in relative valuation.
Capital allocation inefficiency thus emerges as the link between diversification and the conglomerate discount. (See Exhibit 3.) Diversified companies suffer from lower relative valuations not because of diversification per se, but because their portfolio complexity makes it challenging to allocate capital efficiently. This insight points to greater efficiency in capital allocation as the primary objective for diversified companies’ efforts to shrink the conglomerate discount or even turn it into a premium.
Overcoming the Discount
Two levers stand out for their potential to drive greater efficiency in capital allocation: capital management and portfolio streamlining. (See Exhibit 4.)
Capital Management. Excellence in capital management (that is, steering capital flows among businesses to maximize returns) provides a powerful means for diversified companies to achieve higher relative valuations. In fact, we found that capital allocation efficiency is a stronger driver of valuation for diversified companies than for pure-play companies, and many diversified companies have attained high relative valuations by maintaining highly efficient capital allocation.
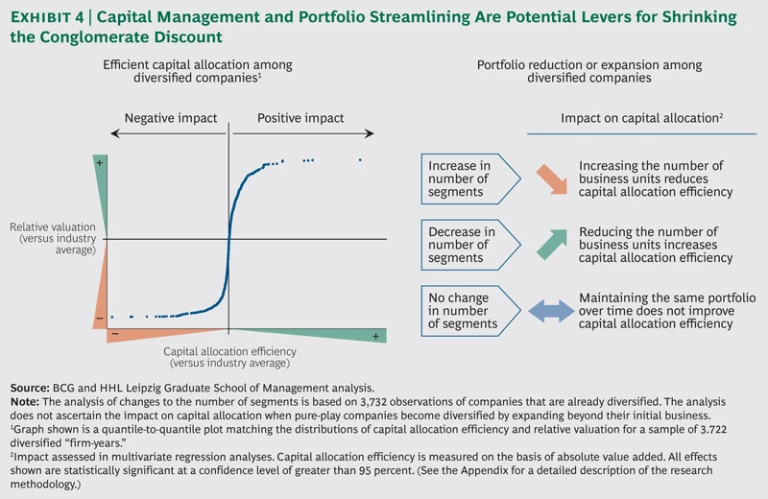
We found a wide variation in relative valuations for diversified companies whose capital-allocation efficiency is close to the industry average for their respective businesses. (See the graph on the left in Exhibit 4.) This variation indicates that capital allocation may not be the only deciding factor in these valuations. In other words, some companies that do not apply a systematic approach to capital allocation may simply get lucky and fall into the average range of relative valuation.
Beyond this average range, capital allocation efficiency and relative valuation are clearly linked: increases in allocation efficiency result in higher valuations, while decreases drive lower valuations. For companies that are either very efficient or very inefficient, however, even large changes in allocation efficiency have only a minor effect on valuation.
For diversified companies that systematically target capital allocation to their most attractive businesses, this analysis offers encouraging news: they have the ability to achieve a step-change improvement in relative valuation. Conversely, companies that do not apply a systematic approach risk falling off a “valuation cliff” if their allocation efficiency falls too far behind pure-play benchmarks.
Portfolio Streamlining. Our finding that, all else being equal, portfolio complexity is a key driver of the less efficient capital allocation of diversified companies points to portfolio streamlining as another way for these companies to increase their relative valuation. In line with this notion, reducing the number of businesses in a portfolio significantly increases diversified companies’ capital-allocation efficiency, while increasing the number of businesses significantly reduces their efficiency. (See the right side of Exhibit 4.) Consequently, diversified companies may be able to reduce their capital-allocation disadvantages and drive substantially higher valuations by making strategic divestments. Conversely, they should be particularly careful to consider how expansion into new business segments will affect their capital-allocation efficiency. Expansion that initially can be accomplished at a reasonable cost could carry the unintended consequence of rendering capital allocation more difficult.
Notably, companies in our study that maintained the same number of businesses over time did not significantly improve their capital-allocation efficiency. In other words, diversified companies do not develop superior levels of allocation efficiency just by gaining more experience in managing a static portfolio of businesses.
Putting the Levers into Action
Applying the levers of capital management and portfolio streamlining requires a plan tailored to the company’s situation, taking into account its current relative valuation and the number and diversity of business types within its portfolio.
Developing such a plan begins with a thorough assessment of the company’s current valuation; a comparison of sum-of-the-parts and market valuations is essential. The company should also compare analysts’ valuation models with an inside perspective (for both the entity and the individual businesses). Further, it should identify potential sources of undervaluation (often reflected in analyst and investor opinions) and review the adequacy of analyst expectations relative to actual forecasts.
With this fact base in hand, a diversified company can turn to determining its potential for alleviating the conglomerate discount and designing strategies for creating value. In its effort to improve capital allocation and optimize its portfolio, the company should employ a stringent, value-focused approach to portfolio management. This approach can be implemented through a role-based method of managing businesses and the capital flows among them. To apply such a method, the company determines specific roles for the individual businesses with respect to the outlook for cash generation and growth and sets investment guidelines for each role.
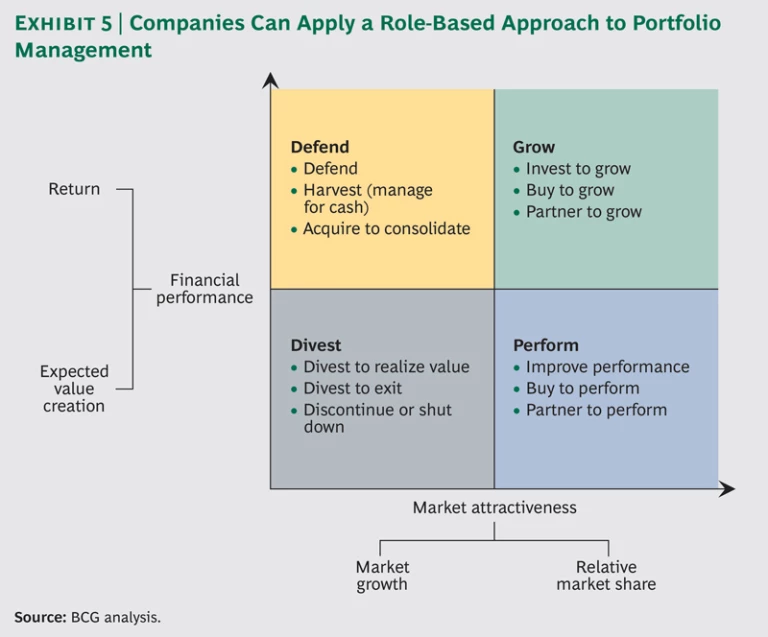
For example, a four-role classification based on market attractiveness and financial performance can be used to segment a portfolio and prioritize businesses for capital allocation or divestiture. (See Exhibit 5.) Market attractiveness is determined by the forecast market growth and the business’s current relative market share—that is, both the opportunity for growth and how well positioned the business is to successfully capture it. Similarly, financial performance is based on both current returns and the opportunity for future value creation.
Each role presents different implications for investment or divestment:
-
Businesses in the “grow” segment (high market attractiveness and strong financial performance) may warrant a disproportionately high share of capital expenditures (for example, to gain additional market share or to strengthen market position). For instance, Colgate-Palmolive has allocated approximately 50 percent more capital per operating profits to its oral-, personal-, and household-products division in emerging markets than in developed markets. Similarly, Johnson & Johnson has allocated approximately 50 percent more capital per operating profits to its consumer-goods division than to its pharmaceuticals division. Both of these consumer-products companies have relative valuations that exceed the industry average. In addition to allocating a disproportionately high share of capital expenditures, companies should look for acquisition targets in industries in the grow segment.
-
Businesses in the “perform” segment (high market attractiveness and weak financial performance) require capital investments in order to capture the opportunity for strong revenue growth in the future, in combination with efforts to improve their financial performance. This approach may also include transactions such as joint ventures or acquisitions to gain sufficient scale or capabilities. Alternatively (or if such efforts fail), these businesses may be highly sought-after divestiture candidates, given the attractiveness of their underlying markets.
-
Businesses in the “defend” segment (low market attractiveness and strong financial performance) generate cash today through market leadership or competitive advantage but should be net contributors of capital to businesses in the grow and perform segments. Depending on the industry, consolidation (such as through joint ventures) may be required to maintain the financial strength of these businesses in the face of declining growth or profitability forecasts.
- Businesses in the “divest” segment (low market attractiveness and weak financial performance) add little value today and are not expected to do so in the future. To make matters worse, these businesses may be responsible for inefficiencies in capital allocation, particularly if they are capital intensive but not growing or if they disproportionally raise portfolio complexity. A diversified company should reduce or discontinue capital investments in such businesses and define a divestiture strategy. (See “A Strategic Approach to Divestiture.”)
A STRATEGIC APPROACH TO DIVESTITURE
Companies that take a strategic approach to divestiture create the case for selling a business and ensure that they unlock an asset’s full value when completing the sale.
In creating the case, the company should consider its rationale for divestiture and the complexity and feasibility of making it happen. The company also needs to determine the value of the business and how a sale would affect that value. For example, an individual business could be more valuable as part of another conglomerate’s portfolio if there is the potential to create synergies across a different mix of businesses. A business might also be more valuable to a pure-play company focused on its specific industry. The company should determine the best owner of a business given the potential synergies, as well as the best transaction model (for example, an all-out sale versus entering into a joint venture that leverages synergies and improves the governance of capital allocation). The decision about when to divest should be based on an understanding of market dynamics and how the industry develops.
Unlocking full value requires developing an “equity story” that details the value proposition of the business and preparing for carve-out and transitioning to ensure a smooth divestment process. The company can then proceed with the standard divestiture process, including buyer search, due diligence, and negotiations. (For a discussion of seven core principles that companies can apply to make their divestitures successful, see Plant and Prune: How M&A Can Grow Portfolio Value, BCG report, September 2012.)
After applying this analysis to each business in its portfolio, a diversified company can turn to defining a comprehensive portfolio strategy. If it finds that it has both attractive and unattractive businesses, the role-based approach will lead to a rebalancing of capital allocation in favor of higher-value businesses and to strategic divestments. If its businesses require larger investments than they generate in cash (for example, owing to an abundance of attractive investment opportunities), the company should seek to raise additional capital or pursue joint ventures in order to fully capture the value from its priority segments. Conversely, a company that lacks high-value investment opportunities for all the cash generated by its businesses should consider distributing excess cash to shareholders through dividends or buybacks.
Next Steps: Assessing Your Performance Today
Our latest research supports BCG’s perspective that diversification in itself is not detrimental to value creation. Rather, it is how a company manages its diversified business that determines its performance. Although the management challenges are indeed significant, leading diversified companies have demonstrated that efficient capital allocation and a clear and consistent portfolio strategy can drive superior value.
To assess how well a diversified company is performing with these two key levers today, executives can consider the following questions:
Do we know the company’s relative valuation discount or premium?
Have we identified the reasons underlying the company’s relative valuation?
Have we obtained a clear view on the role of individual businesses in value creation?
Do we have a clearly articulated capital-allocation strategy?
Are any businesses in our portfolio candidates for divestment owing to an unattractive market or an inability to overcome weak financial performance?
Does the complexity of our portfolio make it so difficult to manage capital allocation that we should consider divestments in order to enhance overall allocation efficiency?
- In evaluating the opportunity to enter a new business segment, do we consider how having a more diverse portfolio would affect the company’s capital-allocation efficiency?
The answers to questions like these will point to a diversified company’s priorities in moving forward. Companies suffering from a conglomerate discount, in particular, will need to carefully assess where imbalances in capital allocation are occurring and begin to consider their options for strategic approaches to investment and divestment that drive higher value.
Appendix: Methodology
Our study drew upon Worldscope/Datastream data for all companies publicly listed in the United States from 1990 through 2012. We excluded companies for which the required data was not available (such as sales, capital expenditures, market capitalization, and business segments). This yielded a large-scale dataset of more than 70,000 “firm-year” observations. An individual company may account for several observations over time, with each year considered separately—for example, a company continuously listed from 1990 through 2012 would provide 23 firm-year observations for our sample.
How We Measured Diversity
We considered a company to be diversified if it had two or more unrelated businesses, with no business accounting for more than 90 percent of total revenues. We used two-digit Standard Industrial Classification (SIC) codes to distinguish unrelated businesses within a company’s portfolio.
We used a broad set of measures to determine the extent of a company’s diversification:
-
Number of Segments. We determined the number of business segments in a company’s portfolio based on the number of different two-digit SIC codes.
-
Diversity of Businesses. We measured investment opportunities across different business segments based on Tobin’s q—the ratio of market valuation to replacement value of companies in a given industry. The more dispersed these investment opportunities, the more diverse the portfolio of businesses.
- Concentration of Sales. We measured sales concentration across business segments using the Herfindahl index.
The study did not ascertain the impact of the initial level of diversification on valuation, but rather looked at the impact on valuation of changes in the number of business segments within a diversified company’s portfolio. To measure changes to a portfolio over time, we looked at the increase or decrease in the number of business segments from one year to the next.
How We Calculated Capital Allocation Efficiency
We used “absolute value added” (AVA) to measure the efficiency of capital allocation in a diversified company. A standard research metric first developed by Rajan, Servaes, and Zingales in 2000, AVA combines two important factors driving the capital market’s valuation of companies.
-
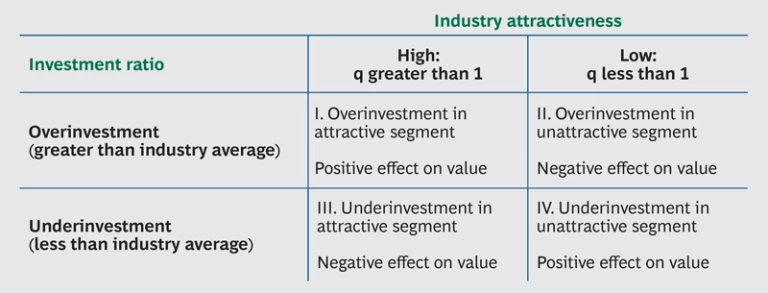
Industry Attractiveness. Companies doing business in industries with high-growth outlooks and attractive margins are generally valued higher than their counterparts in less attractive, mature industries facing significant margin pressure. As a proxy for industry attractiveness, we again used Tobin’s q. Investments in industries with q greater than 1 (meaning market value greater than book value) are value creating, whereas those in industries with q less than 1 are regarded as destroying value.
- Over- or Underinvestment Compared with the Industry Average. We benchmarked a diversified company’s investment (scaled by the book value of assets) in a particular segment against the weighted average of the investment ratio (capital expenditures as a percentage of asset base) of the stand-alone companies in the same industry.
By combining these two factors, four different cases emerge:
In general, overinvestment in attractive segments (quadrant I) and underinvestment in unattractive segments (quadrant IV) have a positive effect on a diversified company’s value. In contrast, overinvestment in unattractive segments (quadrant II) and underinvestment in attractive ones (quadrant III) indicate an inefficient allocation of funds and imply a negative effect on company value.
The calculation of AVA also takes into account the relative size of the different business segments based on assets, so that the final result provides a weighted average for the efficiency score.
How We Calculated the Discount
We calculated conglomerate discounts (or premiums) using a modified version of the standard excess-value model proposed by Berger and Ofek.
Modifying the classic valuation procedure, we relied on the
How We Established Relationships Between Variables
We used the same standard multivariate-regression methodology for each level of the analysis (that is, the relationship between diversification and capital allocation efficiency and between capital allocation efficiency and relative valuation). The methodology used three control variables that could affect capital allocation efficiency and relative valuation: company size (measured in terms of sales), profitability (EBIT/sales), and cash richness (cash/assets). After controlling for these variables, we found the results to be statistically significant at conventional levels (99 percent for diversification’s effect on capital allocation, and 95 percent for capital allocation efficiency’s effect on relative valuation and the effects of changes in the number of business segments on capital allocation efficiency).
As part of the regression methodology, we used fixed-effects models to correct for company- and year-specific effects. This prevents the overall results from being distorted by individual company or specific market conditions in individual years.
