In the two years since The Boston Consulting Group conducted its last Treasury Benchmarking Survey, there has been a welcome easing of financial-market tensions. The sovereign-debt crisis has abated; the Eurozone has stabilized, thanks mainly to European Central Bank (ECB) intervention; and liquidity levels have recovered. (See In the Center of the Storm: Insights from BCG’s Treasury Benchmarking Survey 2012 , BCG Focus, October 2012.) Despite this stabilization, however, banks continue to adjust to a world of slower economic growth, sustained low interest rates, greater sensitivity to systemic risk, and a more stringent regulatory environment.
These factors will require treasuries to understand the true cost of regulatory compliance, to optimize their liquidity buffer from both risk and cost points of view, and to deliver a stronger P&L contribution within a healthy balance-sheet structure.
Four concerns emerged in BCG discussions—which included two roundtables held in Frankfurt—with bank treasurers following the 2012 survey:
- Treasury Operating Model. What sort of treasury operating model is required to support a controlled and risk-transparent maturity transformation?
- Liquidity Buffer Cost. How can banks optimize their liquidity buffer to reduce costs?
- Target Balance-Sheet Structure. How can banks ensure profitable growth while maintaining a healthy balance-sheet structure?
- New Regulation. What new regulations are likely to have the greatest impact on balance sheet liabilities and how can banks manage client-product-basket profitability over the full life cycle?
In our most recent Treasury Benchmarking Survey, conducted in early 2014, we were seeking to deepen knowledge in these areas, as well as in liquidity risk management and funds transfer pricing (FTP). A total of 30 leading banks across Europe participated in our interviews.
Greater Stability; Increasing Regulations
Although the decline in market volatility has had a steadying effect on bank treasury operations, continued low interest rates and the evolving regulatory environment pose several challenges.
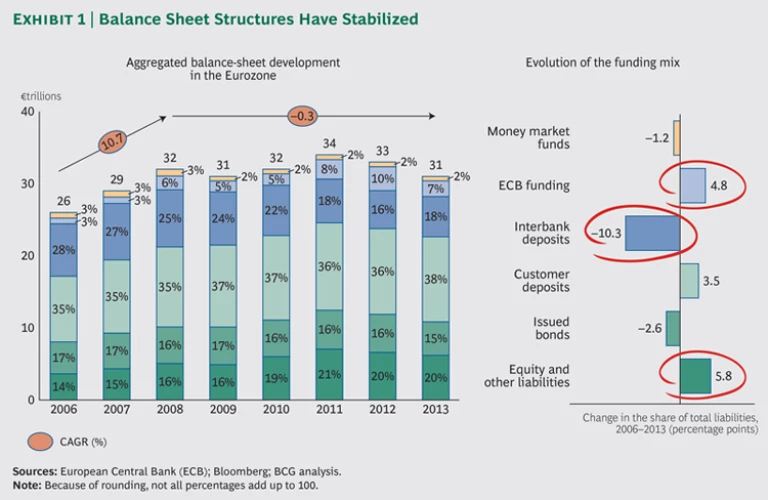
Balance sheet structures have stabilized. Central-bank funding declined from a high of 10 percent in 2012 to 7 percent in 2013. Interbank deposits saw a slight increase, rising from 16 percent in 2012 to 18 percent in 2013, as banks regained trust in the underlying health and solvency of the system.
Although reliance on money market funding has remained more or less unchanged since 2012, customer deposits increased from a share of 36 percent in 2012 to 38 percent in 2013. That uptick can be explained, in part, by the preferred treatment under the Basel liquidity rules and the relatively low cost of that form of funding. (See Exhibit 1.)
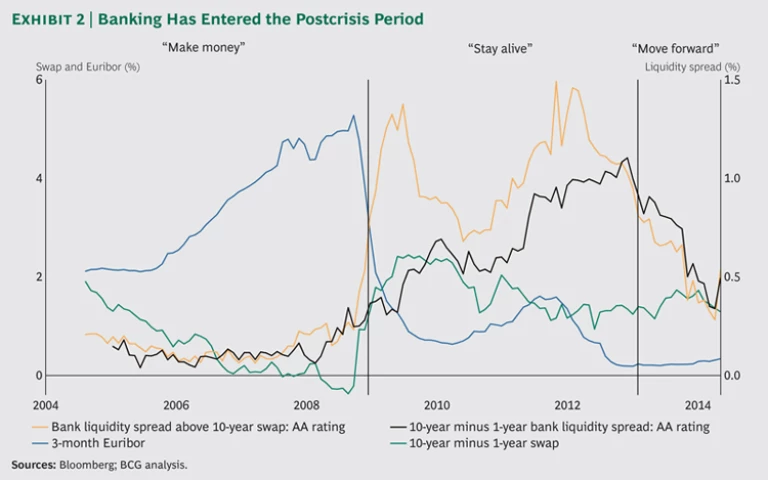
Liquidity spreads have also stabilized. Absolute levels and volatility have decreased. But historically low interest-rate levels combined with the current relatively flat curve, driven largely by central-bank policy, make it challenging for banks to earn returns from maturity transformation. (See Exhibit 2.)
The regulatory environment raises costs and poses management challenges. The mandatory liquidity coverage ratio (LCR) and net stable funding ratio (NSFR) require banks to hold sizable liquidity buffers or adjust their funding structure or both.
In addition, new bank-resolution rules governing “bail-inable” funds have triggered a close strategic review of the capital and liability structure.
Treasury Operating-Model Trends
The changes to the market and regulatory landscape have had a powerful influence on the role of bank treasurers. Today, the treasurer is expected to be more than an administrator of resources—not just the person who interacts with financial markets on the bank’s behalf. The treasurer’s tasks have evolved to combine a steering role, through which treasury decisions have an immediate impact on all businesses, and a risk management role, through which treasury is also charged with securing the bank’s liquidity.
The survey results regarding the treasury operating model can be summarized as follows:
Treasury Operating-Model Orientation. Survey data shows that more banks are adopting a CFO-oriented model. Under that model, treasury reports to the CFO and is largely focused on steering tasks, with little or no direct client or trading responsibility and usually no market access. Between 2012 and 2014, the share of global bank treasurers reporting to the CFO increased from 56 percent to 82 percent, and the share of regional bank treasurers reporting to the CFO increased from 32 percent to 58 percent. These changes suggest that banks are prioritizing treasury’s banking-book-management focus, although some are extending that oversight function across the trading books. (See Exhibit 3.)
Treasury Steering and Risk Management. Outside treasury, survey participants said that the chief risk officer still holds a strong control function, especially with respect to liquidity management, in which the CRO’s role commonly extends to measurement and methodology, monitoring and oversight, and limit setting and reporting.
Governance Structure. According to our survey and interviews, most internationally active banks employ a governance model in which the corporate group treasury sets the global governance framework and the local treasuries that report to it have responsibility for central steering, the balance sheet, and funding management on a local level. That structure is informed primarily by economic considerations: the central treasury’s primary role, apart from regulatory compliance, is to act as lender of last resort—a role that has become increasingly important in the aftermath of the liquidity crisis.
The evolving environment will require further changes to treasury operating models. Treasuries will need to manage net interest income (NII) more closely and in a more detailed way. For instance, they will need to delineate NII by business-unit margin contribution and maturity transformation—again, by interest rate and liquidity—in order to steer the banking book more effectively. Given the current low client margins, treasuries are also under increased pressure to generate profit—within a clearly defined risk-appetite framework.
Significant Variability in Liquidity Buffers
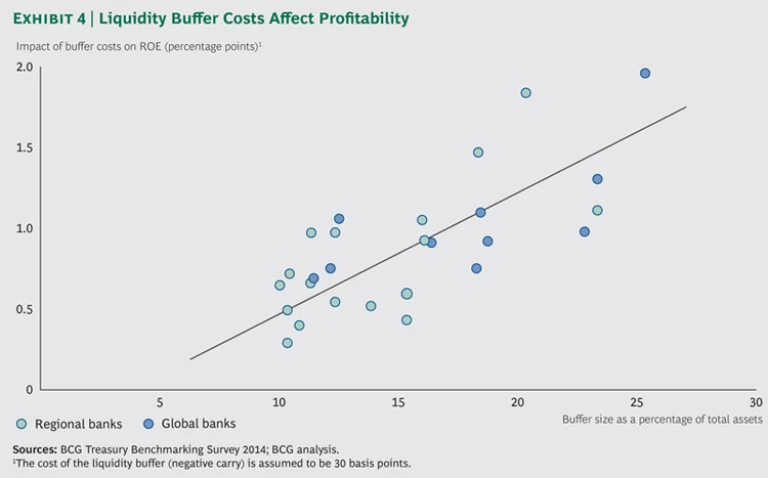
Following the financial crisis, most banks established large economic-liquidity buffers to protect against the risk of future funding freezes. While the average buffer for global banks (those with assets of €500 billion or more) was about 17 percent of total assets, and the average buffer for regional banks (those with assets of less than €500 billion) was about 13 percent, survey data showed wide variation among respondents—even among banks in the same business segment. Among universal banks, for instance, the liquidity buffers of global banks ranged from 10 to 25 percent, and those of regional banks ranged from 10 to18 percent. Wholesale banks saw the widest spread, with some global banks maintaining buffers more than twice the size of others in their segment (20 percent compared with 9.7 percent). Such variation may be caused by the improved liquidity and funding environment, which allowed banks to achieve their funding plans faster than anticipated, as well as by the slow pace of new lending, which gave many banks surplus liquidity to “invest” in liquid assets.
The adequate size, or corridor, for a liquidity buffer depends on several factors. They include compliance with regulatory requirements, such as LCR, local liquidity ratios, and regulatory stress tests; economic requirements, such as the liquidity gap profile; and the bank’s ability to keep track of all encumbered and unencumbered liquid assets at all times.
Getting the balance right, however, is essential. It is important not to be overly conservative: liquidity buffers come at considerable cost and can have a significant impact on bank profitability. A simple simulation with an assumed negative carry of 30 basis points, for instance, would reduce return on equity by
To keep tabs on their liquidity, most banks use gap profile reporting as a central liquidity-management tool. Daily gap-profile reporting has become increasingly commonplace: more than 80 percent of global banks and 53 percent of regional banks in our survey report in this fashion.
Achieving Target Balance-Sheet Structure
To factor in the constraints imposed by the LCR, the leverage ratio, bail-in regulations, and other requirements, treasury departments will increasingly be called on to allocate an accurate cost of funding for all relevant products.
Most banks use some form of FTP mechanism to allocate liquid-asset buffer costs, albeit with different levels of sophistication. For instance, about 20 percent of respondents allocate liquidity reserve costs on a deal ticket level, which is considered best practice—at least for some business models (for example, corporate credit lines). For other business segments—for example, the swap desk, where netting effects are crucial—cost allocation is usually done on a portfolio level.
In addition, 82 percent of global players include derivatives and cash collateral in FTP, but that is true of only 42 percent of regional banks, in part because the complexity of factoring in derivatives and cash collateral generally requires the derivatives business to be large enough to warrant it.
Balance Sheet Management
Survey data shows that five years after the Basel liquidity rules were first introduced, banks have made substantial progress integrating new liquidity ratios into their liquidity management. The LCR has been established as a core ratio by all global players and by about 75 percent of the regional banks in the survey. Implementation of other measures, such as NSFR and the leverage ratio, remains less robust because of uncertainties surrounding the final definition and target levels of these ratios. In fact, our analysis of survey participants shows that most of those that had already integrated NSFR had a similar internal metric in place that predated the introduction of the Basel III rules.
Even though asset encumbrance reporting will be established by the European Banking Authority by the end of 2014, most banks view this topic as a low priority in light of the recent Bank Recovery and Resolution Directive (BRRD).
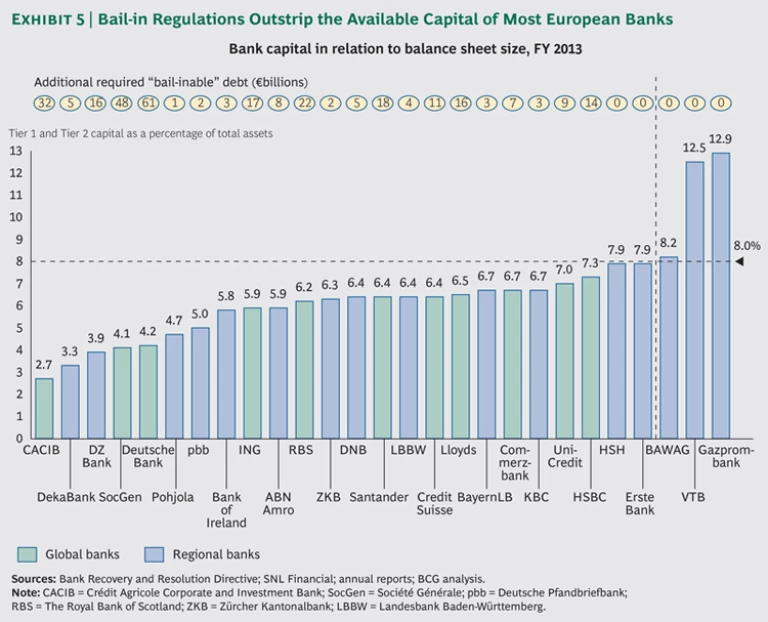
The BRRD, which was adopted by the EU parliament on April 15, 2014, established rules for the resolution of failing financial institutions. Under the rules, a resolution fund will be established and banks will be required to bail in 8 percent of liabilities before they can access the fund. Within the liability structure, customer deposits rank above senior unsecured debt—thus setting depositor preference—when the 8 percent threshold is determined. That requirement may lead to an increase in the cost of senior unsecured funding, especially for those banks whose capital position won’t permit them to cover the bail-in. (See Exhibit 5.)
That means that banks can either keep their capital level below 8 percent and accept the corresponding increase in their senior unsecured spread or they can fill the gap with Tier 2 capital instruments.
How a bank resolves this optimization problem depends on its balance sheet and funding structure. However, this is currently one of the key questions in strategic balance-sheet management.
Next Steps
To sustain profitability in the challenging environment, bank treasury departments will need to act on the following imperatives:
- Adjust the treasury operating model to enable active steering of the banking book and develop well-defined heuristics to manage risk and return from interest and liquidity maturity transformation.
- Base the liquidity buffer size on risk appetite (with LCR as a side condition), optimize it along the legal entity structure, and establish central collateral management.
- Establish a strong FTP framework to support balance sheet management.
- Optimize the balance sheet and the liability structure with respect to the leverage ratio and bail-in rules.
- Strengthen the treasury function’s IT infrastructure to enable enhanced FTP and allow a more detailed breakdown of maturity transformation by interest rate and liquidity.
We believe that evolving market conditions will result in a strengthened role for the bank treasury in strategic balance-sheet management and steering.
Acknowledgments
This report and the underlying BCG Treasury Benchmarking Survey would not have been possible without the cooperation of the banks and the support of our colleagues in the Financial Institutions practice. The authors would especially like to thank Robert Schäfer and Martin Großmann, as well as all the participating treasurers.


