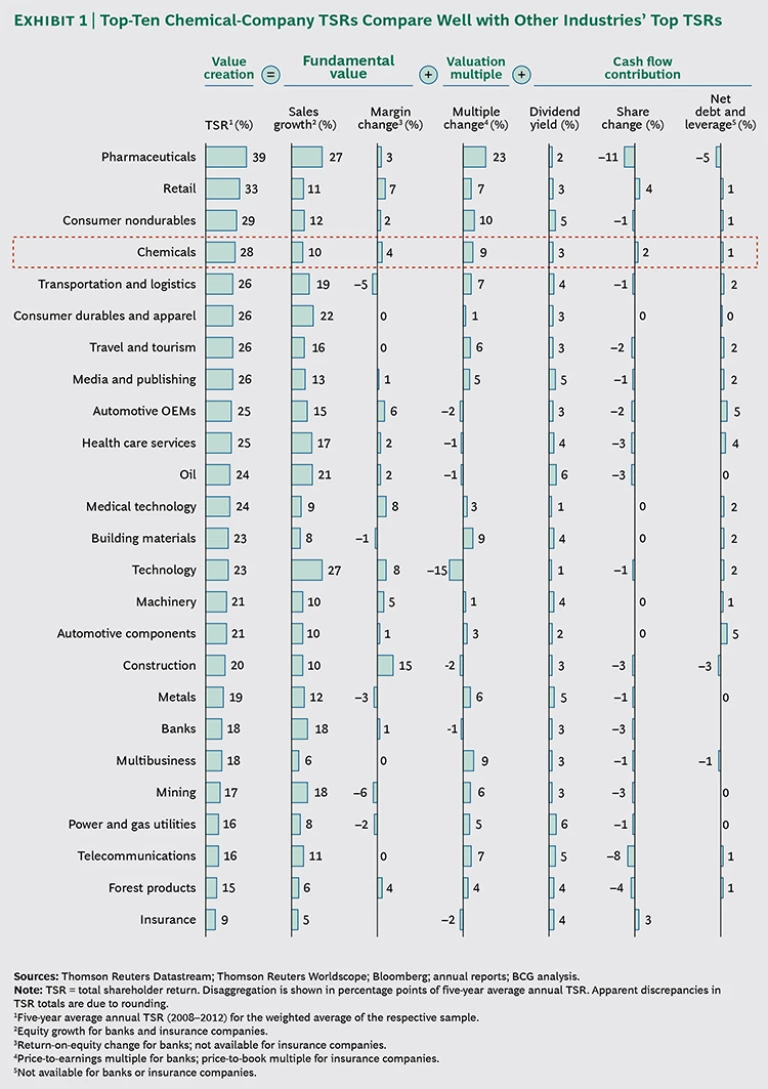
This is the second consecutive year in which The Boston Consulting Group has conducted a total shareholder return (TSR) analysis of the chemical industry. As we had expected, many conditions have changed since last year. The top ten chemical companies still have excellent returns—fourth best, in fact, among the 25 industries BCG analyzed. (See Exhibit 1.) But there have been some big shifts in the composition of the top-performer list. U.S. and European chemical companies have come roaring back, displacing the emerging-market chemical producers that were getting the best TSRs only a few years ago.
Another change is the relative improvement in TSRs among high-end chemical companies, as well as the simultaneous loss of TSR momentum among commodity chemical players, specifically in the agrochemical and fertilizer subsector. (See “How We Measure Value Creation: The Components of TSR.”)
HOW WE MEASURE VALUE CREATION: THE COMPONENTS OF TSR
Total shareholder return, which accounts for share price development in a given time period (dividend payouts are also part of the calculation), is the product of multiple factors. Readers of BCG’s Value Creators series are likely familiar with BCG’s methodology for quantifying the relative contribution of the various sources of TSR. (See the exhibit below.) The methodology uses the combination of revenue (that is, sales) growth and change in margins as an indicator of a company’s improvement in fundamental value. It then uses the change in the company’s valuation multiple to determine the impact of investor expectations on TSR. Together, these two factors determine the change in a company’s market capitalization. Finally, the model also tracks the distribution of free cash flow to investors and debt holders in the form of dividends, share repurchases, and repayments of debt in order to determine the contribution of free-cash-flow payouts to a company’s TSR.
These factors all interact—sometimes in unexpected ways. A company may increase its earnings per share through an acquisition but create no TSR if the new acquisition has the effect of eroding the company’s gross margins. And some forms of cash contribution (for example, dividends) have a more positive impact on a company’s valuation multiple than others (for example, share buybacks).
TSR is a useful measure of value creation, but it is inherently backward looking. As such, it is not a reliable predictor of future returns.
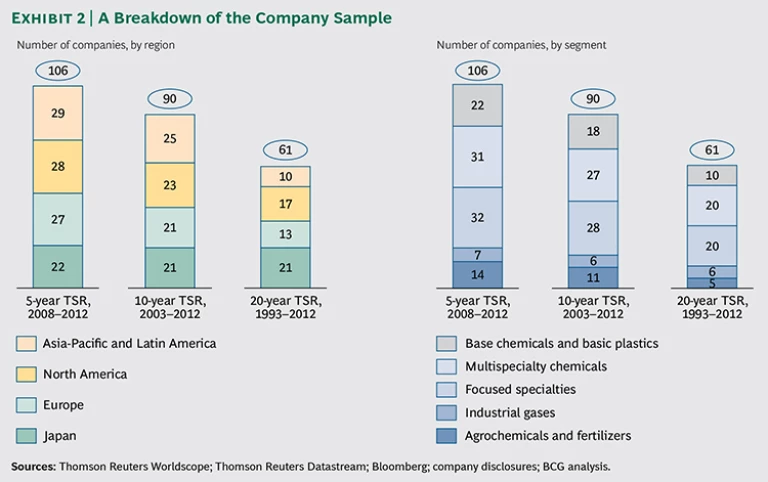
In order to conduct a comprehensive analysis of the chemical industry, we scanned all of the world’s stock exchanges and included every chemical company whose market valuation was at least $2 billion at year-end 2012. In addition, each company’s shares had to have been listed for the entire time covered (we looked at three different time periods), and there had to be a free float of at least a quarter of the company’s shares. This scan gave us a list of 106 companies for the 5 years that ended in December 2012, 90 companies for the 10 years that ended in December 2012, and 61 companies for the 20 years that ended in December 2012. The larger samples from more recent periods result from the emergence of new companies.
Our purpose in looking at the three time periods was to get a sense of the success of the companies’ capital-deployment programs. In many industries—certainly in chemicals—it takes years to see the results of invested capital. The analysis of several time periods also allowed us to see how different chemical companies have fared in a variety of stock market environments and through a number of industry shifts. For instance, the 20-year period beginning in 1993 is when European chemical companies stopped trying to succeed as pharmaceutical companies as well. Imperial Chemical Industries’ spinoff of Zeneca that year was the pioneering transaction and was followed by a succession of similar portfolio moves that reshaped the chemical industry.
Some of the companies on our list are also involved in significant activities other than chemicals. As long as those activities are clearly secondary from a revenue standpoint, we have included the companies. We excluded companies whose chemical operations are eclipsed by other, more dominant industrial activities, including some oil and gas and mining companies.
The Chemical Industry: Regions and Subsectors
The companies we analyzed are headquartered (and generate the bulk of their revenues) in four regions: 28 in North America, 27 in Europe, 22 in Japan, and 29 in rapidly developing economies, which we refer to as
Structurally, we group the 106 companies into five subsectors. There is no perfect categorization scheme for an industry that is as complex and has as many applications as chemicals (and many companies are active in multiple subsectors), but we think that these five subsectors do a good job of showing companies’ basic positioning. (See Exhibit 2.)
- Base Chemicals and Basic Plastics. Most of the 22 companies in this subsector generate a large share of their revenues from cracking products or basic derivatives, such as polyolefins, solvents, and surfactants. Some have another product focus (for example, other polymers) but in their business model, they closely resemble petrochemical companies. A few also have sizable specialty-chemical businesses.
- Multispecialty Chemicals. The 31 companies in this subsector have diverse portfolios and earn a sizable portion of their revenues from their specialty-chemical businesses. Compared with focused specialties, multispecialty companies serve a broader range of customer industries and functional applications. Almost all dedicate a significant part of their business to so-called semispecialties or narrow commodities, and some are also active in petrochemicals, agrochemicals, and pharmaceuticals.
- Focused Specialties. This subsector consists of 32 companies, mainly from the following segments: coatings, adhesives, flavors and fragrances, construction chemicals, chemical distribution, and electronic materials. All have a stated focus on highly refined chemical-product areas that serve a narrowly defined customer industry or functional application.
- Industrial Gases. This subsector, clearly demarcated from the others, is the industry’s most consolidated, with just seven companies. All of the companies derive the overwhelming share of their revenues from industrial gases. (This is true even of Air Products and Chemicals, a U.S. company that also produces specialty chemicals.)
- Agrochemicals and Fertilizers. Fourteen companies in our sample generate all or most of their revenues from agrochemicals or fertilizers. This group includes some companies with substantial but minority specialty-chemical operations. For some of these companies, mining is an important activity. (For more on mining companies, see Value Creation in Mining 2012: Taking the Long-Term View in Turbulent Times , BCG report, January 2013.)
What Creates Advantage in Chemicals? The Answer Is Changing
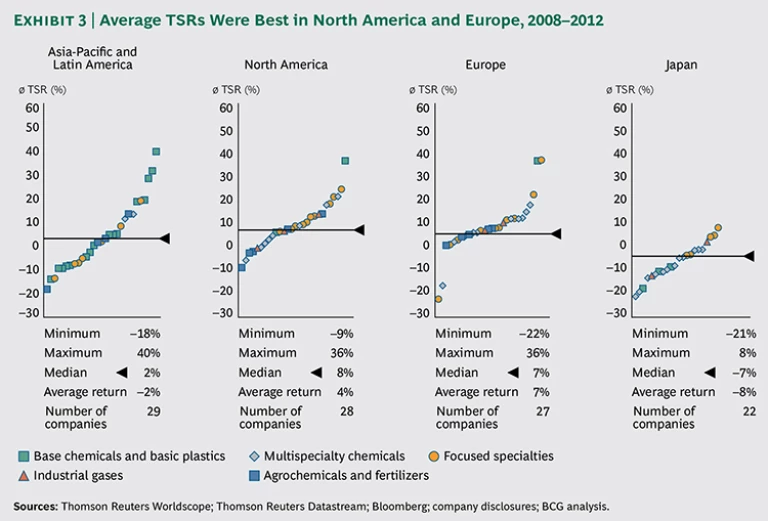
Until recently, the TSR differences among regions and subsectors followed a predictable pattern. Emerging-market chemical companies had the highest returns of all regions, and agrochemicals and fertilizers had the highest returns of all sectors. But that changed during the most recent five-year period. Although there are still some emerging-market companies with five-year TSRs that approach or exceed 30 percent, there are also quite a few emerging-market companies whose five-year TSRs are negative. As a result, the average five-year TSR of emerging-market chemical companies is a dismal –2 percent; only Japan’s average (–8 percent) is worse. (There are numerous reasons for Japan’s subpar performance in chemicals, many of which are addressed in this report. This subpar TSR performance abated in 2013, thanks to the strong performance of the Japanese stock market.) The average five-year TSRs of European and North American chemical companies are much higher: 7 percent and 4 percent, respectively. (See Exhibit 3.)
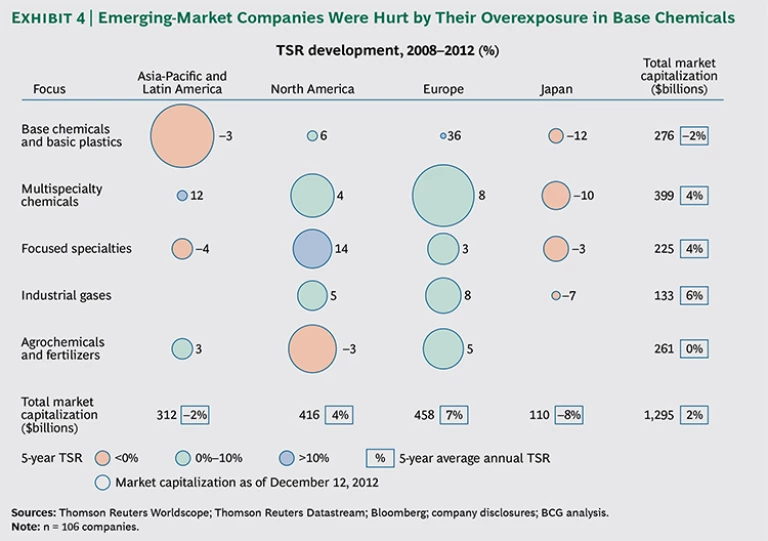
What accounts for the declining performance of emerging-market chemical companies? To start, there’s the relative youth of the chemical industry in, for example, Asia-Pacific and Latin America. Even though some 40 percent of global chemical sales are in emerging markets, emerging-market chemical companies account for only about a fifth of the industry’s worldwide market capitalization. There are a few reasons for this. First, a lot of chemical companies in emerging markets are subsidiaries of state-owned enterprises, and many of them have concentrated on local or regional markets. Second, emerging-market chemical companies tend to focus on the base-chemical and basic-plastic subsegment, leaving them vulnerable when demand cools off in those sectors. We expect all of these factors to change in the next decade and for Asia-Pacific and Latin American players to emerge as much stronger competitors. But for now, the less mature structures and business models of chemical companies in these regions have put them at a disadvantage. (See Exhibit 4.)
By contrast, conditions are becoming more favorable for North American chemical companies, particularly with the rise of shale gas as a resource. Shale gas, which serves as a ready form of low-cost feedstock, stands to make the entire North American chemical industry more competitive. To date, most of the shale gas benefit has been captured by petrochemical divisions of integrated oil companies that are not included in this survey. But the benefit will eventually extend to many of the more than two dozen North American companies on our list.
Europe is the region in which chemical TSRs have remained strongest. This may be because of the abundance of multispecialty companies there. At one time, companies in this subsector were among the worst performers of the chemical industry. But since 2012, the average TSR of multispecialty chemical producers has improved dramatically. Investors seem to be focusing on three developments with potentially favorable implications. One is the portfolio restructuring happening at companies such as Arkema, which divested its vinyl-product business, and Rockwood, which divested its titanium-dioxide business. These divestitures are indications that the European companies are disciplined about shedding businesses that have yielded disappointing profits. Another is the trend toward teaming up in a multispecialty: the Rhodia-Solvay and Clariant–Süd-Chemie mergers have fueled expectations of further consolidation. The third development is the likelihood of outbound M&A: for example, Chinese investors have made moves to acquire stakes in foreign multispecialty companies or acquire them outright.
Nevertheless, on a macro level, the biggest change in the chemical industry is probably the disappearance of overarching themes and advantages related to huge global trends. Shale gas arguably is an exception in that it is a change that will work to the benefit of North American companies for the long term. But for the most part, what will make the difference from a TSR perspective for the foreseeable future are the business systems of individual companies, no matter which region or subsector they operate in.
Leveraging Strategic Points of Control
In the high-flying past, it wasn’t unusual for chemical companies to sustain annual TSRs in excess of 30 percent, 40 percent, or even 50 percent for extended periods. That is no longer the case. Chemical industry returns have normalized: for all chemical companies, the average TSR in the most recent five-year period was about 5 percent. Still, the top ten chemical companies did far better than that, achieving annual TSRs of roughly 28 percent. (For a preliminary look at how TSRs changed in 2013, see “Chemical TSRs in 2013: An Update.”)
CHEMICAL TSRS IN 2013: AN UPDATE
With stocks in most developed markets registering double-digit gains in 2013, the shares of many chemical companies moved substantially higher. That boosted the average chemical-company TSR to 21 percent for the most recent five-year period (2009 through 2013) from 5 percent in the previous period (2008 through 2012).
The 21 percent average gain is due largely to expanding stock-market multiples and is essentially a middle-of-the-pack performance. Indeed, of the 26 industries tracked by The Boston Consulting Group in 2013, 12 did better than chemicals. That means that the industry’s relative TSR has been falling for three straight periods (from fourth in 2007 through 2011, to eighth in 2008 through 2012, to thirteenth in 2009 through 2013).
The stock markets of Japan, the U.S., and many countries of Europe had the biggest advances in 2013. (See “The Flight to Equities Continues,” BCG article, February 2014.) That helped U.S. chemical companies pick up several additional places in the top-ten list; they now hold seven of those places, and European chemical companies hold the other three. For their part, emerging-market chemical companies (which had three of the top ten spots when BCG compiled last year’s edition of the chemical industry report) have fallen off the top-ten TSR list entirely.
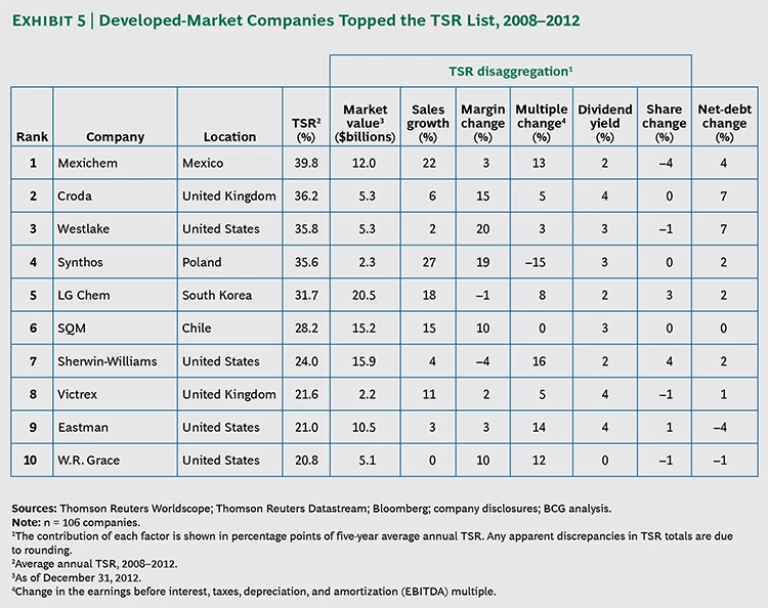
Looking more closely, we see that eight of the top ten companies are based in developed economies, and only two are headquartered in Latin America. (See Exhibit 5.) The top companies achieved their superior TSRs in one of four ways: through aggressive revenue growth (for example, Synthos, Mexichem, and LG Chem); through feedstock-based margin expansion (Westlake and SQM); through pricing-based margin expansion (Croda); and through valuation multiple improvement resulting from improved macroeconomics (Sherwin-Williams, Eastman, and W.R. Grace).
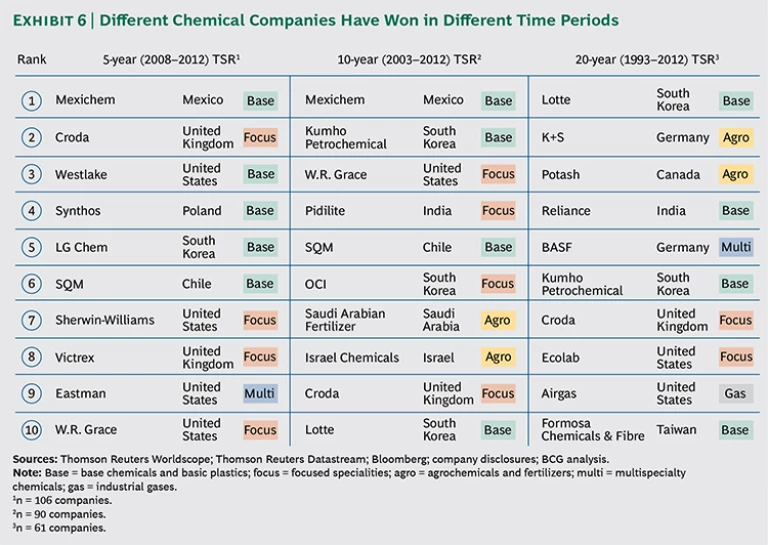
A different analytic approach—viewing the top companies through three different time periods—suggests that there are two strategic points of control that chemical companies use. (See Exhibit 6.) Either of these two strategies can give chemical companies market values that vastly exceed the replacement value of their physical assets—the clearest indication of the power of a company’s business model.
The first, more common point of control is advantaged access to scarce physical assets. For instance, mining assets have been a powerful source of advantage not only in the potash industry but also in businesses as diverse as sulfur derivatives, fluorine chemistry, tungsten carbide, lithium derivatives, and bromine-based flame retardants. In BCG’s lists of top performers, Potash, K+S, Mexichem, Israel Chemicals, and SQM have all benefited from their advantaged access to scarce resources. Other asset-based strategic points of control include standard setting (Victrex’s getting its specialized PEEK polymer defined as a certification requirement for some aerospace and medical applications), brands (the position Sherwin-Williams has carved out for itself in the U.S. paint industry), easement (SABIC’s access to low-cost feedstock) and scale (BASF’s longtime leveraging of Verbund).
The second point of strategic control is having a superior business system. An example is Ecolab’s Circle the Customer–Circle the Globe strategy. The company’s new products and services are based primarily on its understanding of its customers and only secondarily on its roots of selling cleansers and other hygiene chemicals to institutions such as hotels. Other powerful business systems give companies control of intellectual property (for example, Victrex), allow them to do more innovative application development (Croda), or get new products to market faster (Pidilite).
Holding onto a strategic point of control isn’t always easy. If that point of control is a scarce physical asset, another company could discover it in another place or maneuver itself into a position to compete for the asset. If a company’s strategic point of control is based on the superiority of the company’s business system and on underlying capabilities that enable that system, chances are that it will be more defensible. But it will also be more difficult to establish in the first place.
Still, it’s clear that without one of these two fundamental points of strategic control, a company’s ability to produce high TSRs will be jeopardized. South Korea’s chemical industry provides an example. Until a few years ago, South Korean chemical companies consistently outperformed the market. One of their big advantages was the favorable exchange rate of the won, especially compared with the yen, which strengthened the competitiveness of South Korean chemical companies in export markets and also strengthened the market positions of the South Korean companies that were their direct clients. With less favorable exchange rates in Asia—and with no real points of strategic control—South Korean companies are having difficulty achieving their past levels of TSR performance.
Seven Critical Levers: What Has Changed?
Chemical companies can improve their performance in a number of different ways. They can use technology, switch to a new kind of feedstock, go after a new customer segment or enter a new region, or make a business model change. Eventually, all of these show up in operational metrics—specifically, in the seven measures we believe are the most closely tied to TSR: revenue growth; margin; innovation and R&D; selling, general, and administrative expenses (SG&A); fixed-asset productivity; working-capital productivity; and portfolio management.
A look at the 20-year trends in these measures, or levers, offers some intriguing insights into both regional and subsector differences. But a word of caution is in order. In the chemical industry, as in other industries, financial data needs to be viewed with the proper perspective. For instance, not every percentage point of revenue growth is unambiguously good: the benefits of revenue growth depend on what was required to achieve it. Similarly, a relatively high level of SG&A spending is not always a bad thing; it may be necessary to support a portfolio that covers multiple locations and customer segments and that is more resilient as a result of that diversity.
Revenue Growth
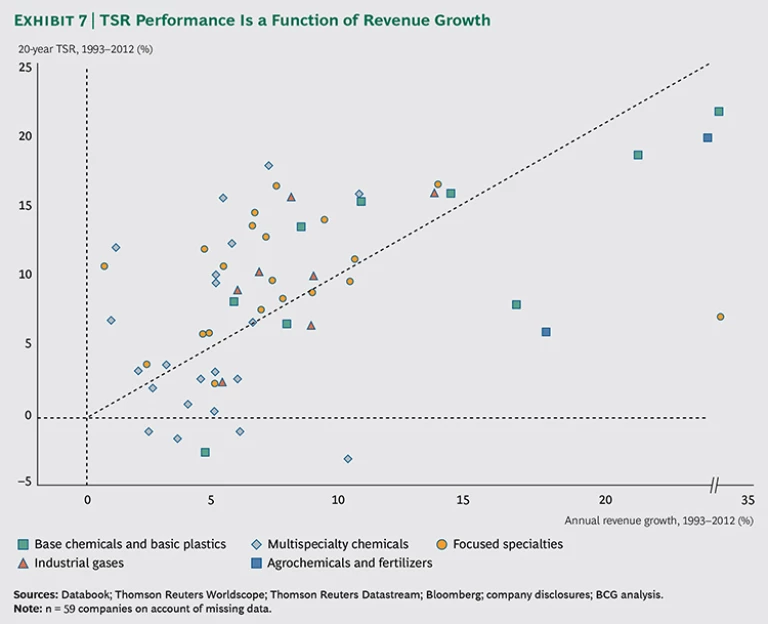
As with companies in other industries, there is usually a positive correlation between revenue growth and chemical company TSR. (See Exhibit 7.) But the correlation has been less pronounced over the past 20 years, and in some cases, other factors appear to outweigh revenue growth in determining TSR.
Indeed, a few chemical companies have achieved TSRs in excess of 10 percent while generating almost no growth. The companies that have done this tend to be either highly disciplined about margin management or creative about generating profits from noncritical business units. For instance, one of the slowest-growing companies in our sample has stayed competitive by offloading the most costly parts of its supply chain. By moving to a virtual supply chain, it has neutralized its rivals’ scale advantages and is getting a satisfactory profit with a relatively low level of investment.
Some companies have had low TSRs despite rapid revenue growth. Most of these have benefited from some sort of commodity price inflation, and their poor TSR performance suggests that investors are hesitant to reward companies whose revenue gains may be attributable to external trends.
In terms of location, the pattern is clear. The U.S. companies that have been growing quickly have been rewarded for that growth. So have the fast-growing European companies—especially those that have had success and bolstered their share in emerging markets.
Margin
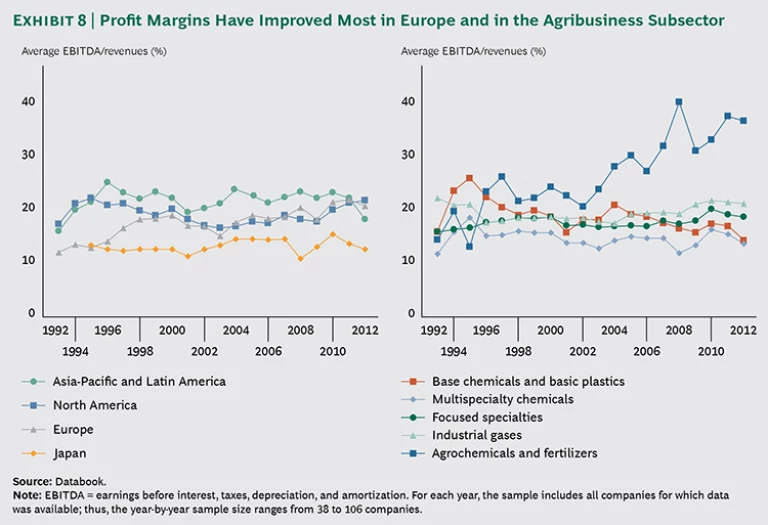
The big change with respect to chemical company margins has been the improvement in Europe. (See Exhibit 8.) European companies have become much more profitable, closing what was once a big gap with their U.S. counterparts. Portfolio transformations, the divestiture of subcritical businesses, and the shift away from commodity business to more advanced chemical segments (Europe is disadvantaged in commodity areas to begin with) have all contributed to European companies’ improving margins. European companies have also focused on productivity in a variety of ways, including consolidating country structures into regional structures, setting up shared services for administrative functions, unwinding complexity in the reporting matrix, and removing layers from their organizations.
By contrast, Japanese companies have continued to struggle to improve profitability. Although European chemical companies used to be equally challenged, Japanese companies now have the bottom of the profitability rankings to themselves. This dubious distinction is in part a result of Japanese companies’ slowness to embrace corporate transformation and to find ways to expand beyond their domestic market.
Within the sectors, the big profit accelerator has been the world’s rising need for food from the agricultural sector. Agrochemicals and fertilizers have benefited from the huge demand and from the resulting price increases. The loss of arable land combined with an increased need for agricultural output has boosted demand for productivity-enhancing chemicals. The dynamics of the food commodity boom have also benefited precursor businesses that supply active ingredients, aromatic feedstock, mining chemicals, and formulation aids for fertilizer and agrochemical companies.
All other sectors have undergone some margin erosion, with base-chemical and basic-plastic companies faring the worst. These companies have had to absorb oil price increases since the Iraq war in 2002, and they lack the value-added products that would allow them to recover their increased costs.
Innovation and R&D
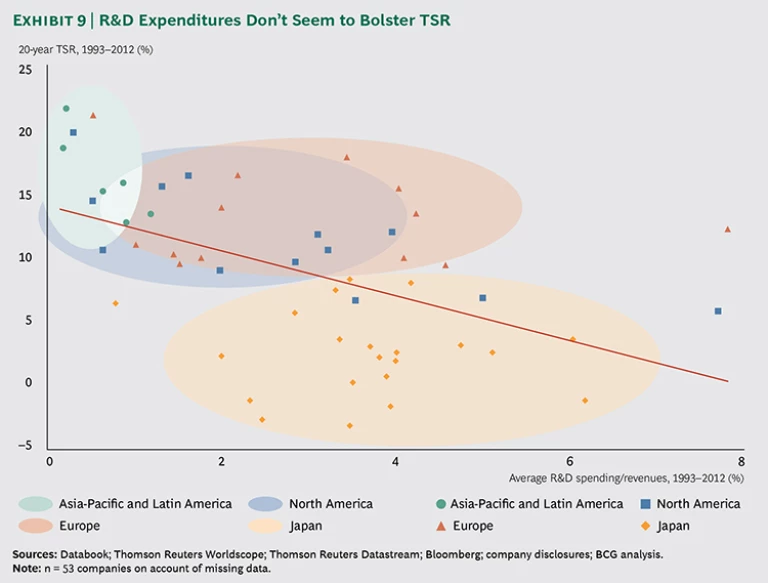
Theoretically, innovation is important for high-margin businesses. But as the data shows, there is not necessarily a positive correlation between R&D expenditures and TSR in the chemical industry. (See Exhibit 9.) In fact, only one of the companies in our sample with R&D expenditures exceeding 4 percent of revenues achieved an above-average TSR, and that result is distorted by the fact that the company has a sizable pharmaceutical business. Indeed, many emerging-market companies with high TSRs devote remarkably little to R&D: less than 1 percent of revenues. Some South Korean companies have succeeded in specialty chemicals—an area that would seem to require a lot of innovation—despite low R&D spending.
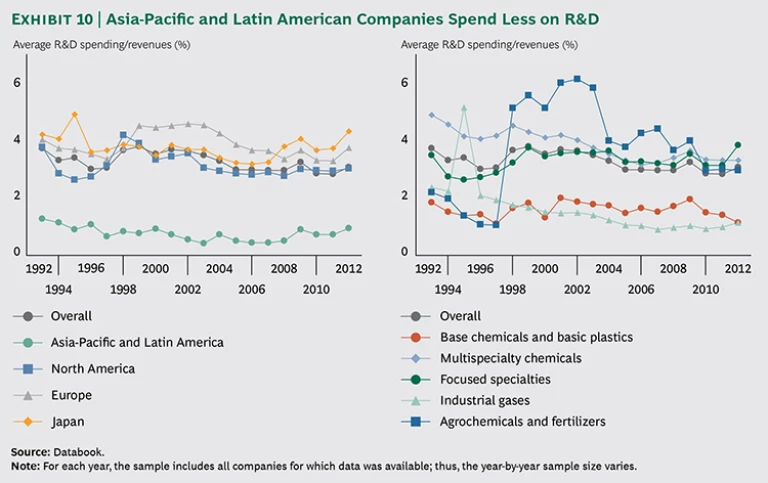
What explains the absence of a correlation between large R&D programs and chemical company success? To some extent, companies’ thinking about R&D may be outmoded. At many chemical companies, including some scientific blue chips that are still magnets for the world’s best chemical talent, there is an emphasis on chemical breakthroughs. This is true of many Japanese chemical companies, as well as some European and U.S. ones. Companies in these regions all make relatively large R&D investments. (See Exhibit 10.) Yet it’s legitimate to ask how many breakthroughs can be expected from the world’s chemical labs. For instance, the invention of methacrylates in 1877 led to polyethylene in 1931, to polyurethane in 1937, to fluorpolymer and polyamide in 1938, to polyoxymethylene and polycarbonate in 1952, and to polypropylene in 1954. These compounds are all more than 50 years old. In most chemical segments, it’s probably less important to find the next breakthrough innovation than to be creative about applying and adapting compounds that already exist. This means that the most promise may be in R&D that leads to blends, high purity grades, premixes, and new formulations and that focuses on regional extensions and the development of new applications and process improvements. R&D aimed at blockbuster discoveries offers the least promise.
This is not to say that R&D has lost its value. Far from it. But the evidence suggests that companies should revisit the goals of their R&D programs and manage their R&D expenditures more rigorously, shifting their R&D efforts toward finding solutions and innovations for specific customers and customer segments.
Companies are also challenged to figure out where to situate R&D resources—centrally or regionally. As some chemical companies are discovering, there is no easy answer to this question. (See “Customer Needs Should Drive R&D Structures.”)
CUSTOMER NEEDS SHOULD DRIVE R&D STRUCTURES
Many people think of R&D as being about fundamental research, process development, and analytics. They forget that a considerable amount—in many cases, most—of chemical company R&D is related to customer-facing product-development and application-support processes. So where should R&D resources be situated? To arrive at the right answer, companies must consider intellectual-property protection, retention of top R&D talent, and the need to develop products jointly with OEM customers.
One truth we have discovered in working with clients is that when it comes to R&D structures in the chemical industry, one size doesn’t fit all. In general, chemical manufacturers that serve industries with global standardized processes (such as pharmaceuticals and cosmetics) would do better to centralize more of their R&D operations. By contrast, chemical manufacturers that serve industries with fast innovation cycles (such as electronics) should probably situate their R&D resources closer to their end customers. After all, companies should not put themselves in a position from which they are slower to react than local players. But this desire to be close to end customers can’t mean that a company should situate all of its R&D resources in places that won’t have recruitment appeal to the big talent markets of the U.S. and Europe. In short, there are certain trade-offs that chemical companies need to think about, and that may require some experimentation and adjustment. (See the exhibit below.)
Selling, General, and Administrative Expenses
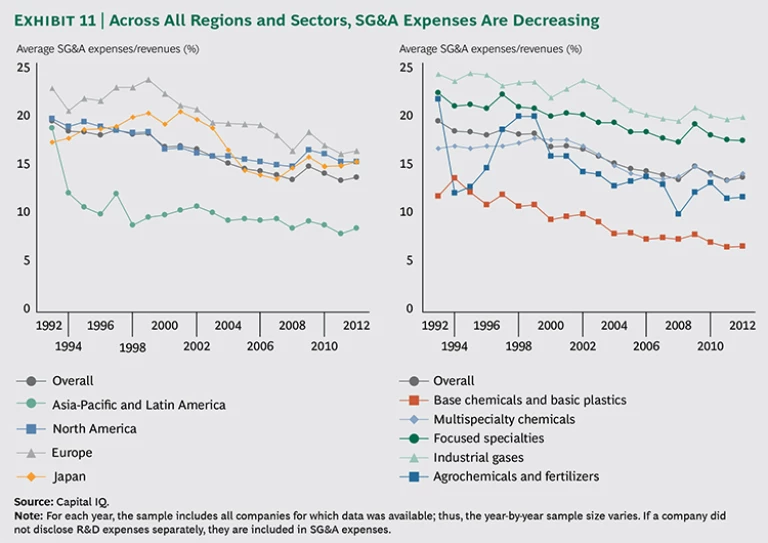
SG&A costs diverge widely within chemical segments, but in the past 20 years the trend in all regions and sectors has been the same: downward. (See Exhibit 11.)
On average and across all regions, SG&A spending has come down about 5 percentage points in the past 20 years—from almost 20 percent to 15 percent. A lot of this improvement has resulted from the effective use of technology to improve productivity. This is particularly true of European chemical companies since 2000. Heavy investments in enterprise resource planning and customer relationship management—undertaken to minimize IT-related problems when fears about the Y2K bug were at their height—have allowed companies to improve the efficiency of their accounting, sales, back-office, and supply-chain functions. Today, European companies have SG&A levels comparable to those of U.S. and Japanese companies. Technology can also be applied in other ways to lower costs, for example, to make better use of feedstock. (See “Using Technology to Manage Material Costs.”)
USING TECHNOLOGY TO MANAGE MATERIAL COSTS
Because raw materials represent most of chemical companies’ cost of goods sold, COGS is a logical place to look for ways to improve profit margins. In the past 20 years, most chemical companies have improved their raw-material procurement practices through financial hedging or have reduced their exposure to commodity price changes by moving to formula pricing (an approach in which there is a contractual agreement that the price of a finished chemical product will be adjusted to reflect changes in the price of the underlying feedstock).
Integrated margin management, a more recent approach to reducing COGS, lets chemical companies use technology tools to help them figure out which commodities they need to hedge—and in what quantities—in order to take advantage of a tactic called dynamic forward trading. At a chemical company with dozens or hundreds of products and customers, the feedstock calculations are immensely complex, and to the extent that companies can get good information and not waste money on raw materials that they are not ultimately going to use, the savings can be considerable.
BCG has helped many chemical companies reduce their cost of materials in recent years. In one case involving a petrochemical company, the initial improvement was about €300 million, or 0.7 percent of the company’s COGS, with other actions increasing the total savings to approximately 1 percent of COGS. The locus of the raw-material-savings opportunity is, of course, different for every company.
Companies that operate internationally can reduce SG&A costs by not maintaining the same infrastructure in every region. U.S. companies have been particularly smart in their approach to apportioning overhead, putting highly skilled managers in emerging markets that can’t reasonably be expected to “run on autopilot” while eliminating administrative layers in more mature markets. European companies have not followed this tactic nearly as faithfully, and as a result, some of them still have layers of management that are more complex—and costly—than necessary. To the extent that they can let go of their insistence on organizational consistency, European companies may be able to get a few more percentage points of cost out of their SG&A functions.
Fixed-Asset Productivity
The chemical industry is, in general, capital intensive, and diversified chemical companies in particular face a big challenge in allocating capital. Chemical companies have a tendency to overinvest in the activities that led to success in the past and underinvest in activities that might be important in the future. Indeed, as one of the ongoing impediments to value creation in the industry, this is a problem executives need to watch for.
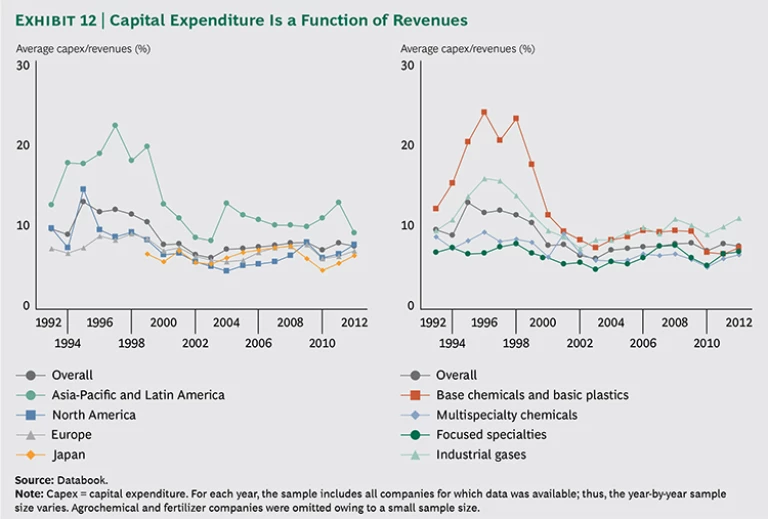
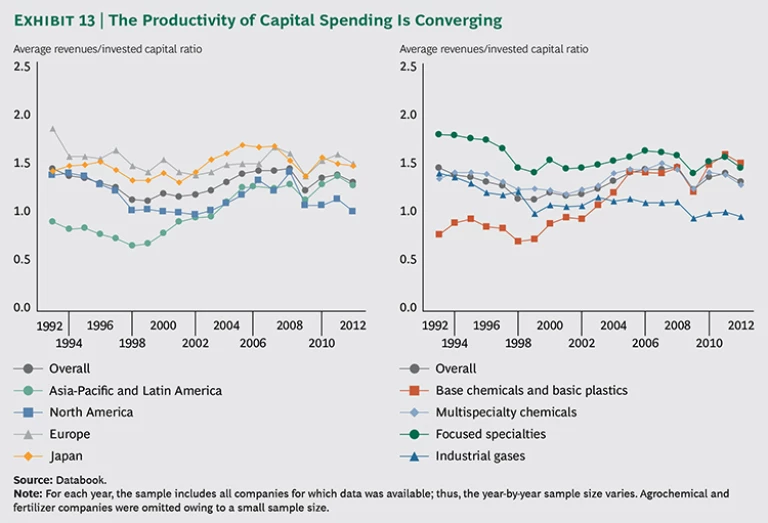
Nevertheless, in the past 20 years, the chemical industry has made strides in its overall fixed-asset productivity. (See Exhibit 12.) Until 2000, average annual capital expenditures exceeded 10 percent and sometimes topped 20 percent in the area of base chemicals and basic plastics. In recent years, capital spending has been much more restrained. This is partly because of the thresholds that most non-Asian companies—reluctant to saddle themselves with excess capacity—have put on large-scale investments and partly because of the move away from the 1990s mentality of investing one’s way out of bad results. (Nowadays, the mind-set is more that operations and business units must earn the right to invest.) The big exception to the rule of caution in capital spending seems to be China, which is creating overcapacity in many areas relating to base chemicals as part of a move to outmaneuver Western chemical providers.
In most other areas, fixed-asset productivity has been converging, not diverging. Twenty years ago, European companies’ ratio of revenues per dollar of capital invested was twice that of emerging-market companies. Now, most regions’ ratios are clustered around 1.5 to 1.0. In North America, however, the ratio is closer to 1.0 to 1.0. (See Exhibit 13.) The good news for North American companies is that the shift reflects huge investments in shale gas, which is likely to boost the region’s financial performance for years to come.
On the surface, it seems startling that the capital intensity of base chemicals and focused specialties would be almost identical. But this is largely an accident of history: base-chemical companies are taking a breather after their massive investments of the 1990s.
Working-Capital Productivity
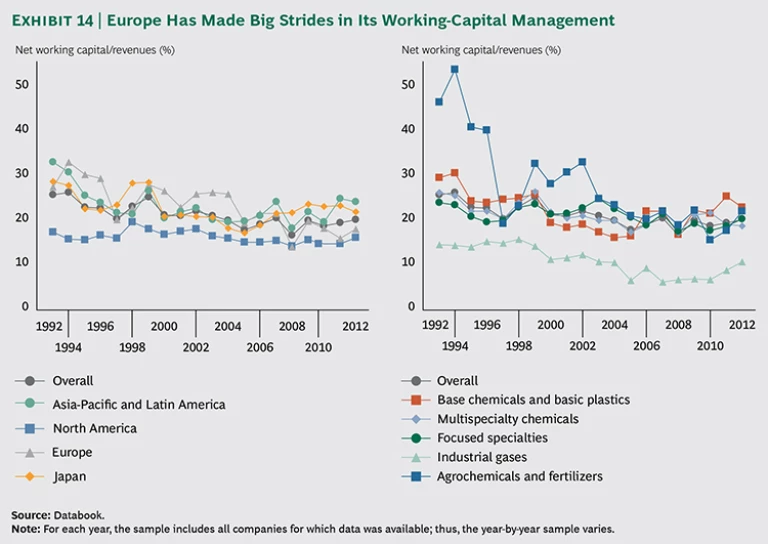
Working-capital management varies widely among chemical companies. Because inventory levels are a critical part of working capital, companies that have a flexible supply chain—and therefore don’t have to carry as much inventory—tend to have better working-capital ratios. Many factors determine why one company has a good supply chain while another company’s is inadequate, but one significant factor is the interface between sales and manufacturing. In companies with a good sales-manufacturing relationship, the supply chain is typically better, and the working-capital-to-revenue ratio is usually lower than in other companies. In companies whose sales-manufacturing relationship is not as good, the working-capital measure generally suffers.
The other two components of working capital are receivables and payables. European companies appear to have benefited from unification and from the move to a single currency, which have made payment more efficient in the core European Union market. There has been no equivalent to economic unification in emerging markets or in Japan, which may explain their relatively high levels of working capital. Whatever accounts for it, working capital is a third area (profitability and SG&A spending being the other two) in which European companies have made big strides in the past 20 years. In fact, European chemical companies have come so far that they are now virtually on a par with their North American peers. (See Exhibit 14.)
Portfolio Management
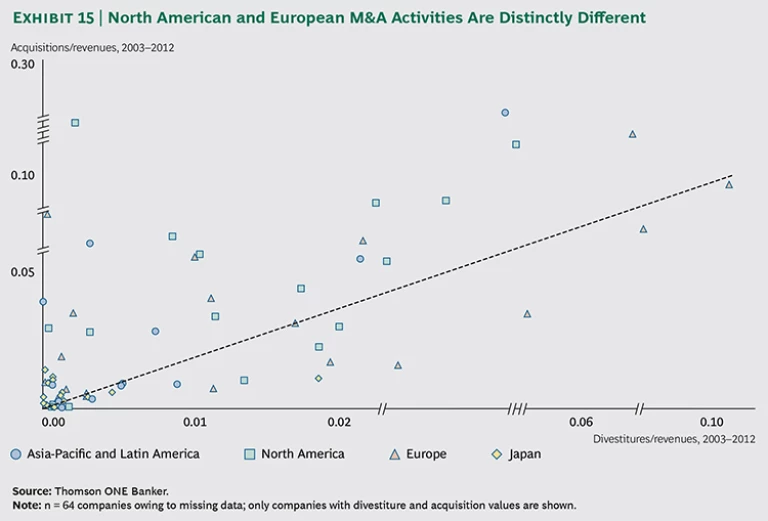
The available data does not allow for a 20-year analysis of M&A activity. Still, the 10-year data reveals a striking pattern. From 2003 through 2012, U.S. and European companies conducted a number of transactions, but U.S. companies concentrated mostly on acquisitions while European companies focused mostly on divestitures. This difference almost certainly stems from the European industry’s greater diffusion. European companies had more ill-fitting parts to shed. In emerging markets and in Japan, M&A activity of any sort has generally been more sporadic. (See Exhibit 15.)
Although the data about U.S. and European company M&A activity is necessarily focused on the past, we think it offers a forward-looking implication: U.S. companies have greater skill in the risky business of adding new businesses. U.S. chemical executives are continually scouring the landscape for companies to buy; they may be said to have an always-on approach to M&A. If, as we believe, this always-on M&A capability will be a major source of future value creation, the European chemical companies, as well as those in other regions, may be at a disadvantage vis-à-vis the U.S. companies.
Excess Cash Is Creating Both Opportunities and Risks
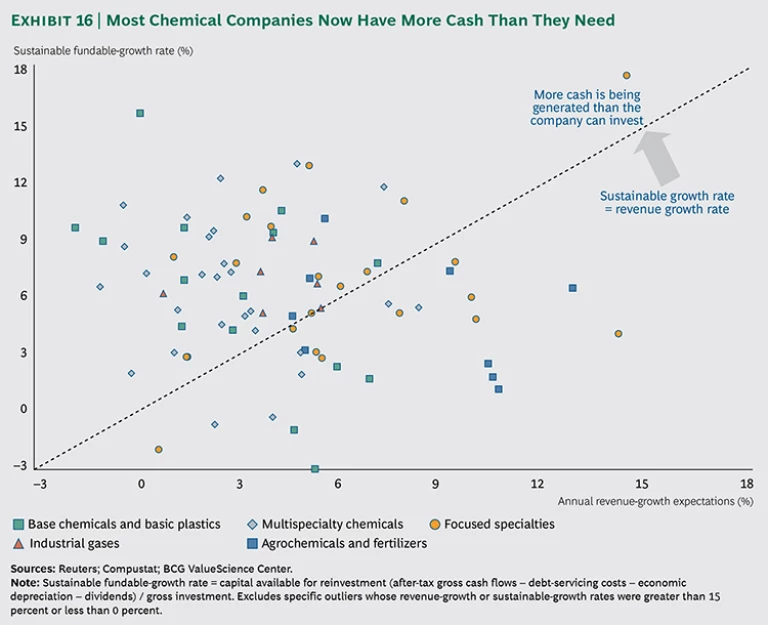
“We have never seen such profit levels” and “our volumes are not back to what they were” are the two statements—one very positive, the other less so—that we hear most frequently as the financial crisis recedes into memory. The profit expansion is partly due to higher prices that chemical companies have been able to charge and to more rigorous expense controls. Together, they have left many companies with excess cash. (See Exhibit 16.) As a result, these companies may be on the prowl for acquisitions—or looking for other ways to grow inorganically, by, for example, taking minority stakes in joint ventures. Chemical companies might also consider returning some of their excess cash to shareholders in the form of higher dividends—a way of creating value that investors are finding increasingly attractive. (See “ Investors Brace for a Decline in Valuation Multiples ,” BCG article, April 2014.)
Japanese companies provide perhaps the clearest example of a group that should be taking advantage of their financial flexibility. For senior executives at Japanese companies, the challenge will be to enter the world of outbound M&A and divestitures—a world from which they have been largely absent.
But the Japanese aren’t alone in facing risks in an era of accelerating M&A. Many agrochemical and fertilizer companies face risks and will have a harder time than, say, multispecialty companies in finding adjacencies that make sense for them. A multispecialty company that is in one type of plastics could move into another type or into hybrid materials. It could move upstream into feedstock. These companies have product boundaries that are, in a sense, permeable. Fertilizer companies typically don’t.
One of the implications of this is that the quality of a company’s M&A function—already important—is going to become critical in the next few years. It’s inevitable that many chemical companies will acquire their way into sectors in which they don’t currently have expertise. Knowing how to make these moves successfully is one capability that is going to separate the value creation leaders from the laggards.
Survivors Will Be Fast, Flexible, and Focused on Strategy
It doesn’t take a deep knowledge of the chemical industry to see that it has changed over the past decade. Many companies that were around ten years ago—including some with storied histories—are gone. Nor does it take great predictive powers to see that ten years from now, a similar set of dynamics will have played themselves out and some companies that are around today will have been acquired and absorbed by others.
The coming period of consolidation will present many opportunities and risks—especially in an environment of higher multiples. The survivors will be those that demonstrate speed, flexibility, and strategic focus.
Speed. The chemical industry is undergoing huge changes—in terms of demand and supply and regional power shifts. On the demand side, formerly hot growth areas—notably renewable energy in Europe, defense programs in the U.S., and e-mobility everywhere—have cooled. But there are numerous up-and-coming growth applications that are taking the place of those demand drivers, including 3-D printing and wearable electronics. On the supply side, there’s the impact of shale gas in North America and of coal-to-olefins in China. Chinese companies are by far the biggest new regional force; their push into high-value chemical sectors is likely to create challenges for many Western companies and jeopardize the profits of those that are currently operating in Asia.
To thrive in this environment of change, chemical companies are going to need to quickly adjust their resource allocations and be creative about seeding new businesses through their venture-capital arms, investing in joint ventures and rethinking their supply chains and business models. (One example of a structural innovation is the creation of specialized sales teams tasked with securing new accounts. See “Assigning SWAT Teams to Generate New Business in Emerging Markets.”) It won’t be enough to understand the tactical options; the winners will be those that anticipate where the market is going and get there the fastest.
ASSIGNING SWAT TEAMS TO GENERATE NEW BUSINESS IN EMERGING MARKETS
Sales departments have long used the 80-20 rule to figure out which accounts they should handle directly and which they should give to independent sales representatives. Along with ABC analyses aimed at reducing complexity, indirect selling has been instrumental in driving down sales costs, especially during the past 15 years.
But, for chemical companies, the emphasis on sales efficiency has one big drawback: it could prevent them from winning the business of customers that are small now but might be big in the future.
The risk is especially high in rapidly developing economies. In China, for instance, many Western companies use local distributors to cover the market. These indigenous distributors know the Chinese market well and are skilled in providing customer service. But they are often too busy to do the time-consuming work of developing new accounts.
In our experience, new business is often best pursued by so-called hunting teams, which comprise company employees who have the skills, temperament, and financial incentive to win new customers. The idea of a hunting team is straightforward, but in many cases, it is difficult to integrate such teams into the overall talent-development, incentive, and performance-management structures of large chemical companies. The best way to address the complexity is to let customer segmentation drive decisions on which accounts should be handled by the hunting team and to deploy the team where it will do the most good.
Flexibility. Companies often hesitate and display a kind of “collective myopia” when change looms on the economic and social horizon. It appears to be especially challenging for senior leaders to anticipate the tipping points of potentially threatening trends, including shortages in resources and the labor force, accelerated demographic differences between regions, and financial-market and sovereign-debt risk. Perhaps it’s not all that helpful to say that companies need to be smarter than their peers in anticipating the second-order effect of trends in feedstock, technology, and customer demand. The more actionable advice might be that companies need to improve the quality of their corporate-planning and foresight functions.
Strategic Focus. Too many chemical companies are in the habit of letting operational matters become preoccupations of the corporate board. There is no mystery about why this is the case: chemical companies are complex, and there are often internal departmental issues requiring resolution. But a plethora of operational topics in the top-management suite keeps many companies from focusing on more strategic issues. Leaders have to find ways to minimize their operational involvement, preferably by pushing their direct reports and operational entities to act effectively at the interfaces and to resolve cross-unit conflicts with minimal escalation.
The Readiness Is All: Six Questions for Chemical Executives
Changes in the chemical industry—those that are already happening and those likely to happen—put a premium on adaptability. Here are six questions that chemical executives should be able to answer with a yes—if they work at companies that are well prepared for the future.
- Do you have a clear sense of the risks in all the subsectors in which you operate?
- In the emerging markets where you’re active, is your position strong enough to fend off indigenous rivals as they become more competitive?
- Do you have a significant advantage in your core business either because of your access to scarce physical assets or because of an inherently superior element in your business system?
- Does your board of directors leave the resolution of operational matters to line managers so that the directors can focus on strategic issues?
- Would you say that your company is faster than its rivals at making big decisions and acting on them?
- Is your company so well versed in acquisitions that it could be considered to have an always-on M&A capability?
We believe that with speed, flexibility, and strategic focus, the best-run companies will be able to withstand the turbulence ahead. Such companies are the most likely to still be around and to have a chance of being on the leaderboard of value creation in 2024.
Acknowledgments
The authors would like to acknowledge the contributions of their BCG colleagues Soon Ahn, Thomas Bradtke, Victor Du, Paul Duerloo, Pia Götze, Paul Gordon, Gerry Hansell, Dieter Heuskel, Udo Jung, David Lee, Hubertus Meinecke, Christoph Nettesheim, Frank Plaschke, Fabrice Roghé, Naoki Shigetake, Andrew Taylor, Tongjai Thanachanan, Arie-Willem van Doorne, Jan Kim Wagner, Dirk Waiboer, Eric Wick, and Rob Wolleswinkel.
The authors would also like to thank Philippe Dehillotte, Kerstin Hobelsberger, and Dirk Schilder of BCG’s Value Creators Knowledge Team; the team at the BCG ValueScience Center in South San Francisco, a research center that develops leading-edge valuation tools and techniques for M&A and corporate-strategy applications.
