In mid-2014, The Boston Consulting Group published its sixteenth annual report on global value creation, detailing the performance of companies in 26 industry sectors over the five-year period from 2009 through 2013. (See Turnaround: Transforming Value Creation , the 2014 BCG Value Creators report, July 2014.) Notably, that window excluded 2008—the depth of the financial crisis—and the report therefore reflected the strong recovery in global equity markets since then. In addition, the report focused specifically on transformation, highlighting those companies that have reinvented themselves to improve cost positions and drive growth in response to dynamic market conditions, new competitors, and evolving technology to create value for shareholders in new ways.
This article offers a closer look at the performance of consumer companies in the overall sample, which we broke down into five sectors: travel and tourism, consumer durables, fashion and luxury, retail, and consumer nondurables. (Other articles in this series examine the performance of each sector.) The top consumer companies in terms of value creation illustrate both findings of the most recent Value Creators report—strong performance during the recovery of the past five years and an emphasis on transformation in order to remain competitive in a highly dynamic business environment.
Overall, the 317 consumer companies in the sample created significant value from 2009 through 2013, returning an annual average of 23 percent in total shareholder return. (For an explanation of TSR and more details on our sample, see “Methodology and the Companies in Our Sample.”) Our 2012 and 2013 Value Creator reports showed these five sectors consistently clustered near the top across all the industries studied. In 2014, by contrast, companies in several of the other 26 industry sectors outperformed companies in some consumer sectors.
METHODOLOGY AND THE COMPANIES IN OUR SAMPLE
Total shareholder return is measured as the return from a stock investment, assuming all dividends are reinvested in the stock. TSR is a product of multiple factors. (See the exhibit below.) Our model uses a combination of growth in revenue and change in margins to assess changes in fundamental value. It then factors in the change in a company’s valuation multiple to determine the impact of investor expectations. Together, these two factors determine the change in a company’s market capitalization and the capital gain (or loss) to investors. Finally, the model tracks the distribution of free cash flow to investors and debt holders in the form of dividends, share repurchases, and repayments of debt to determine the contribution of free-cash-flow payouts to a company’s TSR.
We divided our sample of 317 consumer companies into the following five specific sectors:
- Travel and tourism includes 68 companies with a minimum market cap of $3 billion. This sector comprises a number of subgroups, including travel distribution, airlines, hotels, cruise lines, and casinos.
- Consumer durables includes 53 companies with a minimum market cap of $3 billion.
- Fashion and luxury includes 40 apparel companies—producers, retailers, and integrated players—with a minimum market cap of $5 billion.
- Retail includes 68 traditional retailers, multichannel players, and pure online companies with a minimum market cap of $8 billion.
- Consumer nondurables includes 88 companies in the category of fast-moving consumer goods with a minimum market cap of $7.5 billion.
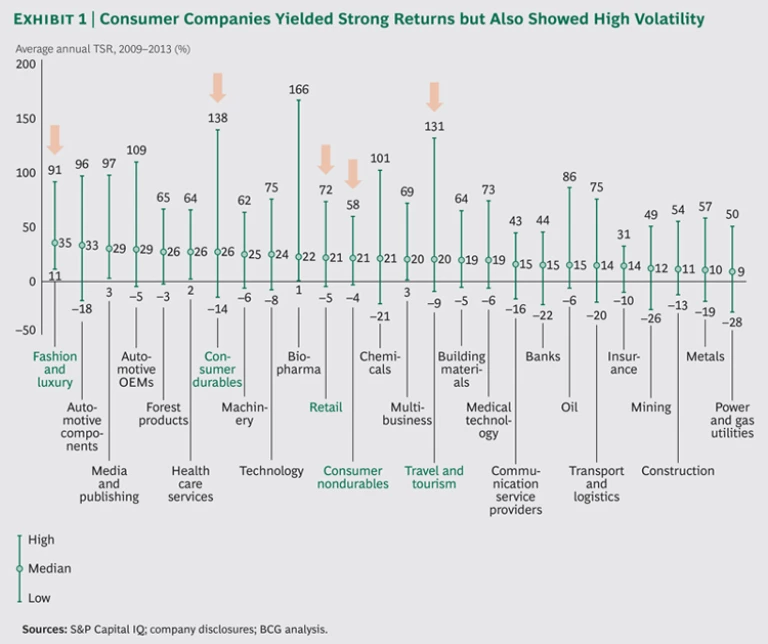
As Exhibit 1 shows, fashion and luxury was the top sector overall (with an average annual TSR of 35 percent), consumer durables ranked seventh (26 percent TSR), retail ranked eleventh (21 percent TSR), consumer nondurables ranked twelfth (21 percent TSR), and travel and tourism ranked fifteenth (20 percent TSR). Rising to overtake many consumer companies in the rankings this year were industrial sectors such as automotive suppliers and OEMs, forest products, and machinery. These sectors were hit particularly hard during the financial crisis, as consumers and business customers alike put off making large purchases. In general, industrial companies rebounded more strongly than consumer companies during the equities rally in 2013.
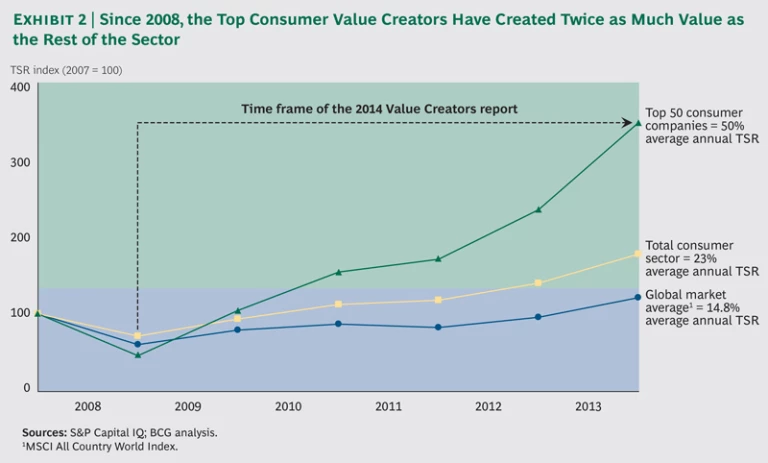
While the relative performance of the various consumer sectors in 2013 was more mixed than in previous years, the 317 companies in our sample still generated strong value. Compared with the 23 percent TSR they delivered from 2009 through 2013, the MSCI All Country World Index delivered approximately 15 percent TSR over the same five-year window. In the previous period studied, from 2008 through 2012, the total sample of consumer companies generated 8.5 percent in total TSR, reflecting the size of the market disruption in 2008.
Several factors are behind these companies’ performance. Consumer sentiment is rising as the global economic rebound gathers momentum. In developed markets, consumers are willing to pay for quality. And in rapidly developing economies, a rising middle class is bringing new consumers to the market—and creating a positive environment for companies that make and sell consumer goods. While those external factors are creating a tailwind, many companies have also undergone transformations to streamline their operations, revamp their business model, and use new technology to connect with consumers.
A Closer Look at the Top Performers
We analyzed the top ten companies in each of the five consumer sectors to determine what drove their TSR performance. To be clear, this analysis was not intended to provide a prescription for all companies but merely to describe how the winners have created superior value over the past five years. In 2008 (when the financial crisis first hit), these 50 companies fell further than the rest of the sector. But from 2009 through 2013, they rebounded sharply. As a result, they created more than twice as much value as the rest of the consumer companies surveyed and more than three times as much as the overall market during the entire six-year period. (See Exhibit 2.)
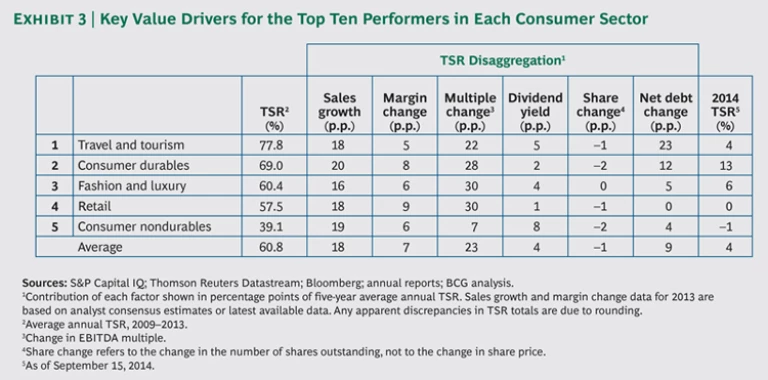
For the five-year period of our analysis, starting in 2009, virtually all of them generated TSR primarily through sales growth (which typically accounted for 16 to 20 percentage points of TSR) and expansion in their valuation multiples (22 to 30 percentage points). (See Exhibit 3.) The contribution from valuation multiples was significantly higher than what we find over a typical five-year period. This reflects these companies’ emergence from the financial crisis at the beginning of the five-year window. It also puts pressure on them to meet the expectations that are factored into their current valuation.
In addition, many of the top ten performers in each of the five sectors have continued to improve margins. Many of these companies launched cost reduction efforts during the early years of the recovery in order to drive short-term value and improve their competitive position in the future. Broadly, these margin improvements contributed 5 to 9 percentage points of annual TSR. (By contrast, the free-cash-flow elements of TSR—dividend yield and changes in net debt and share repurchases—made a very small contribution during the period analyzed.)
Below we look more closely at the performance of the top ten companies in each of the five consumer sectors.
Travel and Tourism. The top ten companies in travel and tourism returned an average annual TSR of 78 percent, making them the “best of the best” in this year’s analysis. That is, these ten companies outperformed the top ten in all 26 industry sectors. This group comprises a disparate collection of companies, including casinos (Galaxy Entertainment, SJM, and Melco International Development, all of which operate in Macau); online travel distributors (Priceline.com and Expedia); car rental companies (Avis Budget); and commercial airlines (Turkish Airlines). Because of the variety of business models in this sector, the top ten companies showed a wider standard deviation in performance than most of the other four groups of consumer companies. In addition, some companies’ business models are taking advantage of new technology and changes in how consumers book travel, which is putting pressure on companies with more traditional models.
Consumer Durables. Durables companies typically experience greater volatility than some of the other consumer sectors because of their long investment cycles. TSR analysis for this sector, as for travel and tourism, showed clear evidence of a growth market, with most players rebounding strongly from a low sales base and low valuation multiple during the early days of the financial crisis, just before the start of our five-year analysis period.
Fashion and Luxury. In the overall sample, fashion and luxury companies were the top performers, but they fell to third place among the top ten in the five consumer sectors, with an average annual TSR of 60 percent. The best-performing companies include several established consumer brands, such as Lululemon Athletica, Hugo Boss, Burberry, Under Armour, and Fossil. Most of the top ten in fashion and luxury have continued to create value through sales growth (largely by succeeding in new markets and with new consumers) and an expanding valuation multiple, although others have achieved high TSR through strong profits, with continued annual double-digit margin improvement and dividend payouts.
Retail. The retail sector has traditionally been a very strong value creator, with multiple change as the primary driver, followed by sales growth. The top ten companies over the past five years delivered an average annual TSR of 57 percent, and retail ranked fourth among the five consumer sectors. Nine out of ten retail companies posted double-digit annual sales growth. Yet more impressive was the contribution to TSR from margins, which exceeded 10 percentage points for five of the top ten companies, including CarMax (32 percentage points) and Starbucks (11 percentage points).
Consumer Nondurables. The top ten companies in consumer nondurables posted an average annual TSR of 39 percent. Although this group registered the lowest standard deviation in overall performance, it showed the greatest variety of routes to value creation. Some in the top ten (such as Arca Continental in Mexico, Tsingtao Brewery in China, and ITC in India) are growth engines in emerging markets. Others (like Keurig Green Mountain in the U.S.) dramatically improved their margin performance. And dividends are also important, accounting for 8 percentage points of annual TSR. Yet one area in which nondurables did not keep pace was investor multiples, which made an average contribution to TSR of just 7 percentage points (15 to 23 percentage points less than in the other four sectors).
A Geographic Balance
Geographic analysis of the top ten companies in each of the five consumer sectors shows that Western companies are overrepresented, but emerging-market players are gaining share. Nearly half of the 50 companies are headquartered and listed in the U.S. (and eight of the top ten retail companies are American).
Ten of the top 50 companies are based in Europe, of which four are fashion and luxury players. Another ten are from China, including Hong Kong, but none are in the retail category. This absence of retail companies from the Chinese top ten likely reflects the fact that many rapid-growth companies in emerging markets (including China) are either not yet publicly listed or do not yet meet the market cap hurdle in the five consumer sectors.
Of the remaining top 50 companies, two are in Thailand (CP ALL, a retail company, and Airports of Thailand), while three are in Turkey (Turkish Airlines, BSH Turkey, and Arçelik, the latter two both in durables).
Rising Volatility
Volatility is on the rise in the consumer sector, as in the rest of the business
In addition, the consumer sector shows very large variations in performance from year to year. Most of the 50 companies making up the top ten in each of the five consumer sectors significantly reduced their shareholder return for the first nine months of 2014. The overall TSR average was 4 percent (annualized), while the TSR for individual companies ranged from a low of –35 percent to a high of 75 percent. Companies in the durables category were the best performers as of mid-September 2014, with an average annual TSR of 13 percent, more than twice the return of the next-highest sector (fashion and luxury, at 6 percent).
The Next Wave of Value Creators
While consumer companies have continued to create strong value, many now face high valuation multiples and, therefore, high expectations. Some of these companies will struggle to avoid reverting to historical growth and cost levels. Companies must understand their starting position in order to make the right moves and meet the expectations of capital markets.
In previous publications, BCG has shown how an understanding of “value patterns”—the specific pathways that companies use to create value—can help guide management teams. (See “ Value Patterns: The Concept ,” BCG Perspectives, May 2012.) Each value pattern has a specific set of levers to unlock value—such as leading innovation in the category, fixing a troubled business, simplifying the portfolio, paying down debt, returning cash to investors, and improving asset productivity. By identifying a company’s starting position and value pattern, business leaders can identify the right set of levers and ignore those that are likely to distract from the goal of creating value.
In addition, consumer companies must continue to align their business, financial, and investor strategies. This entails targeting the right base of investors, establishing strong communication with them, and making the right business choices to meet their objectives.
Perhaps most important, companies will need to transform themselves—not once but continually—if they are to respond to seismic shifts in technology, consumer preferences, competition, and other factors. Once perceived as a symbol of a company in distress, transformation is increasingly part of the arsenal used by market leaders to retain market position or preempt rising competitors.
If you are not considering a transformation now, you will need to—soon—or risk being overtaken. This advice is not meant to scare management teams; it is simply a fact of life in the current business environment. And, as this year’s results demonstrate, there are sizable opportunities for consumer companies that make the right moves today in order to position themselves to create value tomorrow and beyond.
