Intense pressures from a wide range of sources, including competition from low-cost players and rising prices of raw materials, have forced corporate leaders across many industries to give closer scrutiny to the cost side of their income statement. Capital markets and shareholders have demanded that companies respond to these pressures by managing costs more efficiently and effectively.
A critical but often undervalued area for cost improvement is nonpersonnel costs within selling, general, and administrative (SG&A) expenses. These include costs for facilities, information systems, outsourced labor, transportation, travel, and utilities, among many other areas that are regarded as routine overhead. Depending on the industry and the extent of outsourcing by the company, nonpersonnel costs can account for 40 to 50 percent of SG&A expenses. Because these costs have traditionally received less attention than personnel costs, the savings potential is usually significant. However, reducing nonpersonnel costs and making the changes stick are not simple tasks. Executives must decide where to target their efforts and determine how to reduce costs, while still meeting the needs of internal and external stakeholders.
BCG has developed a comprehensive approach to help companies identify and quantify opportunities to reduce nonpersonnel costs, select targets and improvement measures, and sustain improvements. The approach focuses on the “drivers”—such as head count or utilization—that determine the levels of nonpersonnel costs. This approach helps reduce costs without sacrificing efficiency or effectiveness, while also promoting wide acceptance of the reductions throughout the organization.
Nonpersonnel Costs Are Challenging to Manage
Most companies already put significant effort into keeping nonpersonnel costs low—for example, by managing tenders. However, we often see that these efforts are not effective enough, as evidenced by a mismatch between the quality of products or services and the needs of internal customers, as well as by inadequate demand management. Several common challenges help to explain why organizations struggle to manage nonpersonnel costs effectively:
- Budgets for nonpersonnel costs are typically not set at the enterprise level. Because each business unit or function sets its own budget, companies lack a comprehensive perspective on nonpersonnel costs and thus may underestimate their significance. Moreover, the absence of a single “owner” of these costs makes it hard to identify and control them.
- Companies don’t often apply stringent demand-management processes to centrally control the quantity of items procured in nonpersonnel-cost categories. Consequently, total costs in categories such as air travel or IT services may be high even if the company negotiates low unit prices at the enterprise level.
- Managers don’t know the right improvement measures to apply in order to reduce nonpersonnel costs or the appropriate cost levels to set as targets. As a result, they don’t realize that improvements can often be made quickly and painlessly.
- Discussions about cost-saving opportunities are often conducted on the basis of emotions, rather than facts about value delivered, because managers and employees may seek to maintain their access to products and services.
These challenges make it hard for companies to manage nonpersonnel costs with the same sophisticated approaches that they apply to determine budgets in other areas. During good times, they tend to base budgets for nonpersonnel costs on the previous year’s spending or to adjust them in response to how head count has changed. In times of austerity, they indiscriminately slash costs across the board.
Cost Excellence Is Worth the Effort
Rather than sidestepping the challenges to managing nonpersonnel costs, executives need to address the issues head on. The objective should be to achieve cost excellence by optimizing nonpersonnel costs in an intelligent and sustainable way.
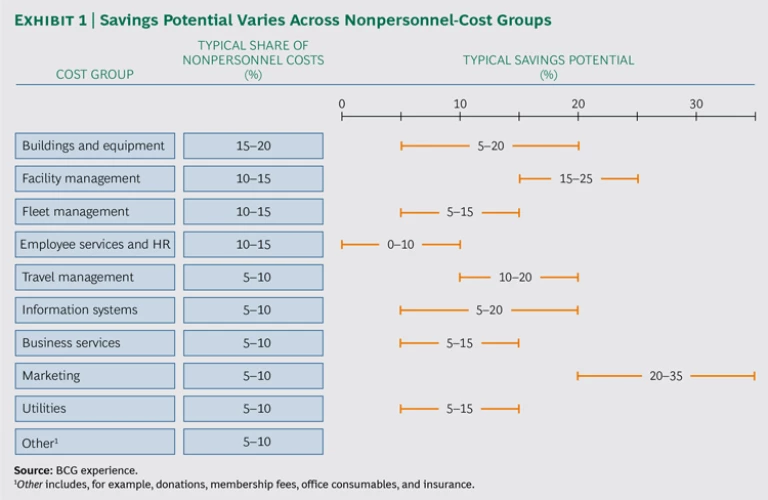
Nonpersonnel costs can be clustered into ten groups. (See Exhibit 1.) The cost groups’ relative importance will vary by industry and company. The groups responsible for the largest share of costs are typically buildings and equipment, facility management, fleet management, and employee services and human resources. We don’t include a cost group for IT, because IT costs are determined by unique factors and are already closely scrutinized by top management owing to their size. (For a discussion of how to reduce IT costs through simplification, see Simplify IT: Six Ways to Reduce Complexity, BCG Focus, March 2013.)
The overall savings opportunity for a particular company depends on its current cost levels and whether it has already implemented cost reduction measures. BCG’s experience suggests that the savings are potentially as high as 20 to 35 percent for marketing; 15 to 25 percent for facility management; 10 to 20 percent for travel management; 5 to 20 percent both for buildings and equipment and for information systems; 5 to 15 percent for fleet management, business services, and utilities; and up to 10 percent for employee services and HR. These estimates of savings opportunities include cost improvements resulting from both lower prices and smaller quantities purchased.
In addition to their high savings potential, measures to control nonpersonnel costs can often be implemented quickly and with relatively low up-front investments (for example, by changing travel guidelines). Consequently, companies can see the bottom-line impact faster than when reducing personnel costs. And, in contrast to cost cutting in other areas, most employees will not even notice reductions in some types of nonpersonnel costs, such as facility rents or utility rates.
The benefits also extend beyond boosting the bottom line. Reducing nonpersonnel costs can raise and support the expectations of capital markets and shareholders by demonstrating that the company is agile enough to withstand the impact of unfavorable economic forces. BCG’s analysis across numerous industries has consistently found that companies with low SG&A expenses as a percentage of revenues tend to generate higher levels of total shareholder return. Moreover, companies with steadily decreasing costs tend to generate higher levels of TSR than companies with stable or increasing costs. Because nonpersonnel costs represent a high share of SG&A expenses, market analysts regard their development as an important metric for assessing top management’s ability to optimize internal resource allocation. They often consider how a company manages nonpersonnel costs over time and compare its performance with that of its peers.
A Driver-Based Approach to Reducing Costs
BCG’s driver-based approach for achieving excellence in nonpersonnel costs entails four steps. The methodology allows companies to assess their current costs and underlying drivers, and to compare those costs and drivers with external benchmarks. Companies use the insights to determine targets and improvement measures. The ultimate goals are to implement the changes and sustain the improvements. (For a discussion of BCG’s general approach to cost excellence, see Six Steps to Achieving Competitive Advantage Through Cost Excellence, BCG Focus, August 2013.)
Assess Nonpersonnel Costs and Their Drivers
To obtain a standardized view of their nonpersonnel-cost base across all business units and cost categories, companies need to define cost groups and subgroups, determine the total costs generated by each one, and identify the primary cost drivers.
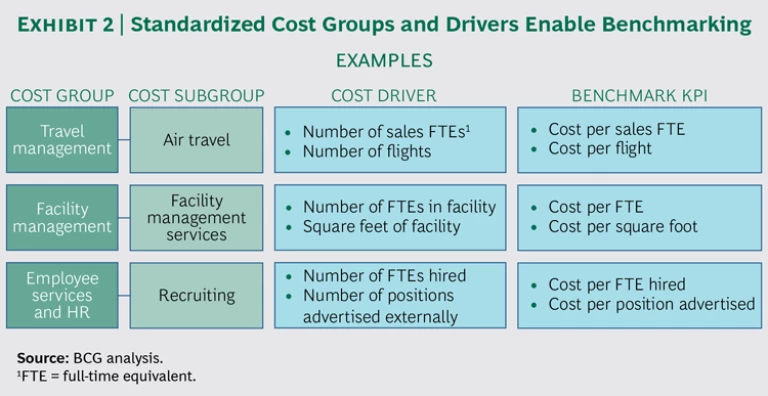
To facilitate this effort, BCG has developed a standardized list that sets out cost groups and subgroups, as well as their respective cost drivers. Exhibit 2 illustrates this breakdown for several cost groups. The standardized list can be applied to all business units and companies, and thereby provides the basis for internal and external benchmarking. A company can customize its terminology for each cost group and subgroup to reflect company-specific names and cost allocations; however, its categories must correspond in substance to those on the standardized list in order to permit a like-to-like benchmarking.
To ensure consistency and quality, the company’s central controlling function should be responsible for collecting data for the benchmarking. The company can obtain a dynamic perspective on how costs have changed over time by gathering historical data on cost drivers during the past three to four years.
After collecting and validating all the required data, the company can develop structured overviews of the total costs as well as in-depth breakdowns for each cost group. At this stage, the company should focus on the initial findings for key cost groups and understand how they compare with other companies’ costs and drivers.
Benchmark Costs and Drivers to Gain Valuable Insights
Traditional efforts to benchmark a company’s nonpersonnel costs often fail to yield insights that companies can act upon effectively, because these costs are hard to compare, whether internally (among different business units and over time) or externally. By drawing on BCG’s standardized list of cost groups and drivers, and its comprehensive database of nonpersonnel costs across industries, companies can perform an effective like-to-like comparison of cost groups and drivers.
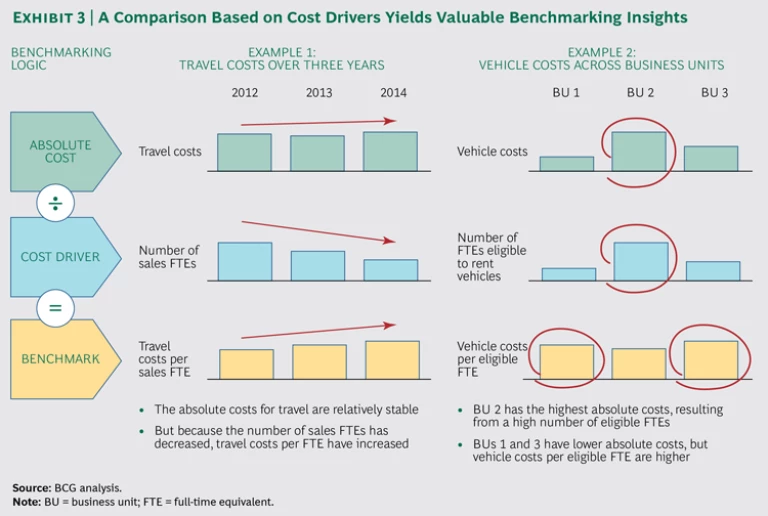
For example, simply comparing a sales organization’s travel costs over several years would not yield useful insights. The high-level, absolute cost figures could vary for numerous reasons, such as head count and the frequency of travel by employees in a given region or role. In contrast, gathering data on the number of sales full-time equivalents, the number of trips per year, and the costs of each trip allows the company to determine the true drivers of variations among travel costs. It may find, for instance, that despite stable absolute travel costs over time, costs per sales FTE have actually increased. (See Exhibit 3.) Similarly, rather than comparing absolute figures for costs of company vehicles among business units, companies should consider the number of FTEs eligible to rent vehicles and the cost per rented vehicle per eligible FTE.
Determine Targets and Improvement Measures
Companies can apply the insights arising from the benchmarking to pinpoint the right targets for cost reduction and to select improvement measures for achieving the targets.
To determine specific top-down targets, companies should apply the results of the benchmarking, as well as insights on typical savings potential derived from BCG’s experience. They should also conduct qualitative interviews with managers to identify which cost groups and subgroups offer the most significant opportunities. To facilitate the selection of cost reduction measures and their implementation, it is essential to define the savings targets as specifically as possible for each cost group and organizational unit.
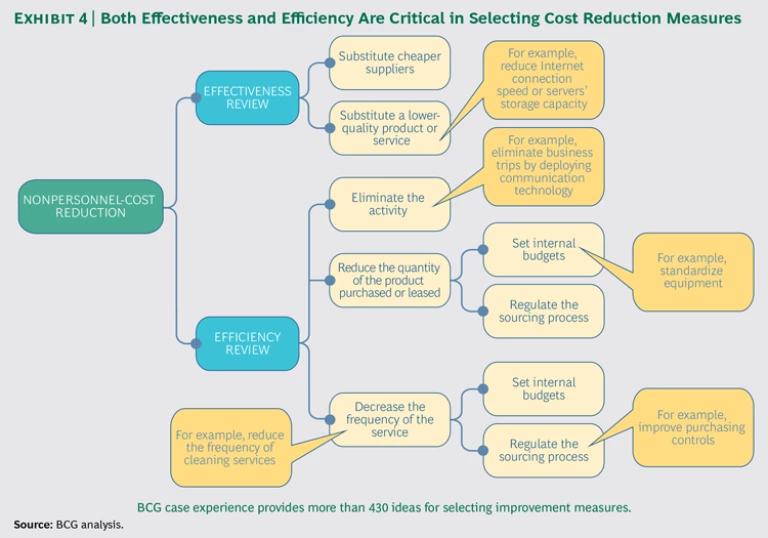
With this fact base in hand, companies can determine the improvement measures for each cost group and subgroup. BCG’s approach to determining appropriate measures entails reviewing both the effectiveness and efficiency of the related expense items. (See Exhibit 4.)
- The effectiveness review seeks to identify opportunities to substitute less expensive suppliers (such as lower-cost insurance providers, travel agencies, or airlines) or meet internal customers’ needs with lower-quality services (for example, by reducing the scope of management reports).
- The efficiency review considers opportunities to eliminate or reduce activities (for example, by applying more stringent demand management or innovative technologies to decrease the quantity of products purchased or leased) or to reduce the frequency and level of services (for example, by deploying videoconferencing technology to lower the number of business trips).
In applying this approach, BCG has developed more than 430 ideas and best practices for selecting improvement measures corresponding to specific cost groups and subgroups. Leading companies have used these insights to identify improvement measures that generate significant impact. (See the sidebar below.)
IDENTIFYING MEASURES AND GETTING RESULTS
Two case examples illustrate how companies across industries can use BCG’s approach and best practices to significantly reduce nonpersonnel costs.
A Consumer Goods Company
To remain best in class and free up resources to invest in growth, a global consumer-goods company sought to reduce its total cost base for SG&A by approximately 10 percent. Nonpersonnel costs represented about 50 percent of the SG&A cost base. The program considered all nonpersonnel-cost groups in more than 15 of the company’s market organizations.
To provide the fact base for developing improvement measures, the company collected and standardized its data on nonpersonnel costs and benchmarked the data historically among its units and relative to its peers. It applied the insights to prioritize cost groups and focus on four improvement measures:
- Renegotiating enterprise-level contracts, primarily for information systems and fleet management, across countries in order to capture economies of scale
- Reducing the required office space by creating flexible work spaces, and reducing rental prices by moving to lower-cost locations
- Reducing the broad eligibility and large allowances for telephone services and IT equipment
- Combining activities across smaller market organizations (for example, by conducting joint market research)
The program achieved annual cost savings of 7 to 13 percent in the prioritized nonpersonnel-cost groups, which had an initial total cost base of about €100 million. An in-depth cost analysis at the level of cost groups and markets was essential to address the need to apply different improvement measures in each function and market. Internal benchmarking across markets yielded credible results, because each market organization had a similar cost base, accounting system, and structure.
A Wholesale Bank
A German wholesale bank sought to reduce its total cost base by approximately 18 percent. To prevent a recurrence of cost pressure and maintain sustainable cost levels, the bank focused on nonpersonnel costs, which represented about 50 percent of the total cost base.
By applying insights from a detailed assessment and benchmarking of nonpersonnel costs, the bank decided to target five improvement measures:
- Introducing a groupwide policy on IT governance, including requirements for demand management
- Renegotiating contracts with external IT providers
- Reducing the required office space by, for example, consolidating office locations
- Reducing expenditures for support from external lawyers
- Centralizing and reducing the marketing budget
The program succeeded in reducing nonpersonnel costs by about 25 percent annually, representing a savings of approximately €43 million each year. Success factors included ensuring that new budgets were defined to reflect the targets for improvement measures and rigorously tracking adherence to measures and budgets.
Companies can organize workshops in which service-providing units and their internal customers discuss the findings of the cost driver benchmarking and jointly develop ideas for improvement measures. To ensure the effectiveness of the measures and promote their acceptance by all organizational levels, companies should follow a bottom-up process in which units develop and document the measures they will implement. In addition, companies should designate managers who will be responsible for driving the process during the project and for providing continued oversight after its completion to ensure sustained improvements.
Sustain the Cost Reductions
Companies that succeed in reducing nonpersonnel costs using traditional approaches often struggle to stave off a rebound in cost levels after the initial improvements. They tend to pull back from or even cancel nonpersonnel-cost-reduction measures in their effort to grow revenues. In addition, rising costs in areas not covered by the cost reduction measures can offset their impact. The absence of adequate cost tracking and reporting can also promote a rebound in costs and amplify its magnitude. Moreover, companies often lack mechanisms to adjust budgets in response to declining growth targets or top-line results and neglect to establish forums for regularly discussing cost reduction issues.
To sustain reductions over the long term, top management should apply best-practice principles of cost management. In BCG’s experience, seven such principles are essential for addressing the “pain points” that allow nonpersonnel costs to rebound.
- Ensure full responsibility and control over costs at the source. A central controlling function should designate ownership of nonpersonnel budgets throughout the company. Each organizational unit should be responsible for the direct nonpersonnel costs arising from its activities, as well as for the secondary costs it incurs by requesting other units to provide services or products.
- Offer incentives for achieving budget and cost targets. Working with top management, the central controlling function should select KPIs for cost controls. These metrics should be used to continually manage and track cost development at the company and business-unit levels, as well as for nonpersonnel-cost groups aggregated across the company (for example, travel). The company should link the compensation of unit managers or other managers responsible for specific nonpersonnel-cost groups to their achievement of targets for cost KPIs.
- Create cost transparency through reporting. For each unit and cost type, the company should establish enterprise-level reports that document adherence to budgets and guidelines. The reports should be action oriented—for example, by flagging risks and suggesting potential mitigating actions.
- Establish top-down cost planning. Cost planning should be decoupled from the previous year’s budget in order to discourage unnecessary or excessive spending as the end of the year approaches (a practice called “saving next year’s budget”). The company should calculate the necessary base budget each year, considering the strategic plan and realistic revenue projections. Funds for a new project should be added on top of the regular budget so that they can be easily removed from the next year’s budget if the project is completed.
- Introduce cost dialogues. Managers responsible for costs should conduct annual “cost dialogues” with their internal customers. These discussions should clarify nonpersonnel costs for each cost group and the resources required for providing each product or service requested by the internal customer. Determining the service levels truly required by the customer allows the participants to quickly identify the best ways to reduce costs.
- Define clear budget processes. Companies need a clear process for setting annual budgets and adjusting them during the course of the year. This includes, for example, identifying the manager responsible for each type of nonpersonnel cost, appointing decision-making bodies, establishing escalation mechanisms and reporting lines, and implementing performance management.
- Establish a low-cost culture and be innovative. Guidelines and policies for nonpersonnel costs should be reviewed regularly to ensure that they are appropriate. Additionally, companies should look for opportunities to apply innovations, such as big data and digitization, to improve their cost position.
A global bank adopted these practices in its cost-management system to implement an effective program to control nonpersonnel costs and manage future cost pressures. For example, the bank established a new cost report to help senior managers stay focused on the program and to provide a channel for escalating issues. The central controlling function used the report to communicate quarterly results to the management board and to offer action-oriented insights by highlighting implementation risks and expenditures that exceeded budgeted amounts. The new report was integrated into the existing set of business reports provided to top management. The bank also introduced cost dialogues among business units to foster cost reduction efforts. These discussions were an opportunity for business units to agree on approaches to optimizing costs, such as through targeted reductions in service levels. To create a fact base for the cost dialogues, each business unit that provided services to internal clients was required to describe the cost drivers underlying its services.
Getting Started
For many companies, achieving excellence in nonpersonnel costs represents a major untapped opportunity. By utilizing a comprehensive database of cost drivers and benchmarks, companies can identify the right costs to improve, set the right targets, and apply the right measures to achieve and sustain results.
To assess their starting point for using a driver-based program to reduce nonpersonnel costs, executives can ask themselves the following questions:
- How big is our nonpersonnel-cost base and how has it developed over time?
- What are our nonpersonnel-cost groups, subgroups, and drivers?
- How widely dispersed is authority for nonpersonnel budgets throughout the company?
- Which factors do we consider in determining budgets for nonpersonnel costs? What processes do we use to review those budgets on a monthly basis and set them annually?
- How much attention do we give to managing the nonpersonnel-cost base? Is this level of attention sufficient? Have we assigned companywide responsibility for each major nonpersonnel-cost group to a specific manager? How successful have these managers been in driving down costs over time?
- Have senior executives reached a consensus on the biggest opportunities for reducing nonpersonnel costs?
- Do we systematically benchmark our nonpersonnel costs internally—among business units and over time—and externally?
For many companies, the answers to questions like these will point to significant opportunities to reduce their nonpersonnel costs and improve their controls for making the changes stick.


