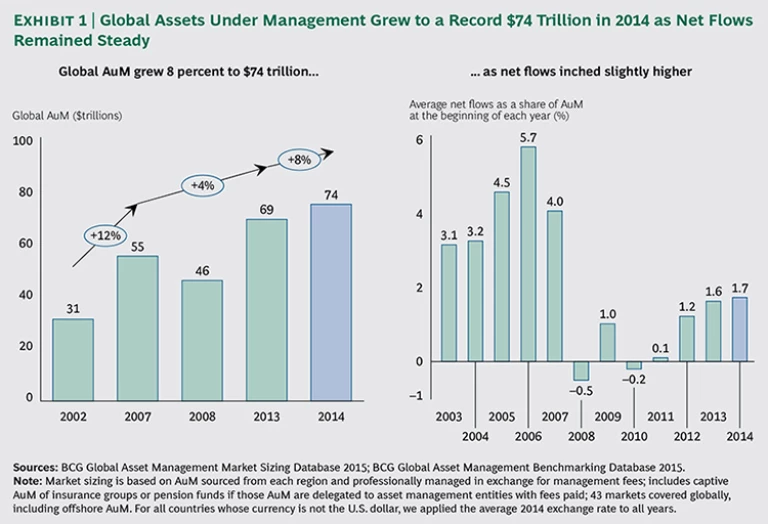
In 2014, the global value of professionally managed assets grew to $74 trillion—the third consecutive annual record—and the industry’s profits rose to match their historic peak of $102 billion. Operating margins remained steady, sitting just below the record level achieved before the financial crisis.
Read More On This Topic
- Sparking Growth with Go-to-Market Excellence
- The Asset Manager’s Go-to-Market Survival Guide
- Catching Asset Management’s Tilt Toward Asia
Global Asset Management
These data points, among others, offer an encouraging snapshot of the global asset-management industry. A more complex portrait emerges in the full details of this report—Global Asset Management 2015: Sparking Growth with Go-to-Market Excellence, The Boston Consulting Group’s thirteenth annual study of asset management worldwide.
This report begins by profiling the industry’s overall evolution in 2014. In the article “The Asset Manager’s Go-to-Market Survival Guide,” we discuss how leading managers are improving their go-to-market approach, in particular through more data-driven decision making. These findings were supported by an in-depth measurement of managers’ capabilities based on BCG’s framework for excellence in go-to-market functions—including market intelligence, product development, client communications, sales coverage model, sales performance monitoring, and organization setup and incentives. Finally, in the article “Catching Asset Management’s Tilt Toward Asia,” we offer a deep dive on the expanding opportunities in Asia-Pacific and how managers can access them.
Professional asset management continues to rank among the world’s most profitable businesses, and it’s a growing one for managers that get it right.
The past year’s performance shows that the industry has moved beyond the dynamics of the postcrisis period. At the same time, a new competitive environment is coming into sharper focus. It is a challenging environment.
Although the industry’s profit pool rose 7 percent to $102 billion, matching its historic peak, those profits, once again, were largely driven by rising asset values on global markets. Growth driven by net new assets remained unchanged from the year before, at 1.7 percent of assets under management (AuM). Net flows, the lifeblood of growth, are likely to remain in the low single digits—well below precrisis levels. At the same time, net revenue growth fell short of the growth of average AuM as pressure on fees squeezed price realization.
This isn’t the first year that fee pressure has contributed to declining revenue margins. Institutional investors are monitoring fees more closely, challenging and renegotiating them. In the retail segment, channel consolidation and increasing transparency driven by regulation are driving fees lower.
The product shift of recent years—from traditional actively managed products to passives, solutions, and specialties—held true in 2014. This structural shift will continue in the medium term, we believe, squeezing the share of active core products and managers.
The gap in business performance by segment widened between managers in the retail market and those in the institutional market. For the second year in a row, retail-focused managers outperformed those focused on institutional markets by relatively wide margins in AuM, revenue, net flow, and profitability growth.
Whatever their segment or product focus, asset managers today face a future in which growth isn’t a given. Superior investment performance does not guarantee greater market share. The dynamics of competitive advantage have changed.
Achieving growth will require managers to ramp up their execution game in order to differentiate themselves. In particular, they will need to generate more value through end-to-end, The Asset Manager’s Go-to-Market Survival Guide —from design to execution—by leveraging their marketing, sales, and pricing capabilities.
Although the traditional framework for maximizing go-to-market performance remains intact, the competencies needed to achieve excellence are shifting. In many cases, the winning managers gain advantage by developing and deploying advanced capabilities in data-driven decision making.
Many of today’s most effective managers focus their efforts on three capabilities: marketing effectiveness, sales force productivity, and enhanced customer experience.
In addition to sparking growth through their go-to-market capabilities, asset managers should look for growth potential in Asia-Pacific as the industry rebalances toward that region. That shift is already overdue, and there is plenty of room for more growth, as we discuss in the article “Catching Asset Management’s Tilt Toward Asia.”
How should managers access this opportunity? Asia-Pacific must be approached as a set of diverse markets. Differences in market maturity, scale, regulation, demand, and channel economics make Asia a complex environment, where each opportunity is paired with its own challenges and success factors.
If global managers get only one market right, it must be China. Still, gaining access to China’s domestic investors can be complex.
This report, like its predecessors, is the product of market-sizing research and an extensive benchmarking survey. The benchmarking involved 135 leading asset managers—representing $39 trillion, or 53 percent, of global AuM—and covered more than 4,000 data points per player. The aim of our annual research is to gain insights into the state of the industry and its underlying sources of profitability to help managers build prosperous paths to the future.
The additional assessment of go-to-market functions conducted this year, noted above, covered managers’ organization setups across those functions, product innovation metrics, sales and marketing efficiency ratios, incentive policies and drivers, performance-monitoring metrics, use of advanced data analytics including big data, and digital and social-media metrics.
A Snapshot of the Industry
The profit pool of the global asset-management industry rose 7 percent to $102 billion in 2014, matching its historic peak reached in 2007 before the financial crisis. Profits were buoyed by the increasing market value of professionally managed assets, which hit a record high for the third consecutive year, and by new flows unchanged from last year’s level.
Assets Under Management Rise to a Record $74 Trillion
Globally, assets under management (AuM) increased 8 percent in 2014 to a record $74 trillion—a healthy advance but slower than the pace in recent years, including the 13 percent increase in 2013. While market impact was the main source of AuM growth, net new flows provided support by remaining steady at 1.7 percent of 2013 AuM, compared with 1.6 percent of 2012 AuM in 2013. Still, net flows remained well below their peak years before the 2007 financial crisis. (See Exhibit 1.)
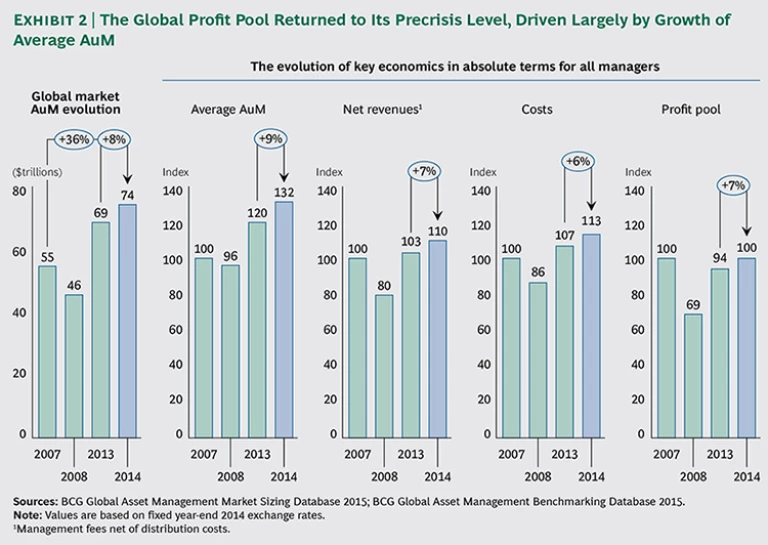
The return of industry profits, in absolute terms, to their precrisis peak of $102 billion was mostly driven by the rise in AuM. Operating margins—or profits as a percentage of net revenues—remained at 39 percent of net revenues as in 2013, compared with the precrisis high of 41 percent.
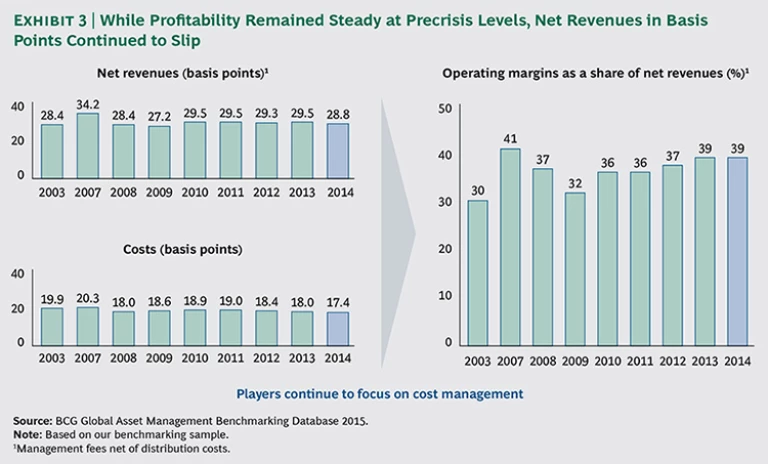
However, net revenue growth of 7 percent fell short of the greater than 9 percent growth of average AuM in 2013 as pressure on fees squeezed price realization. (See Exhibit 2.) Indeed, net revenues measured in basis points—or on an asset-adjusted basis—continued to decline. (See Exhibit 3.) This occurred despite the slightly faster growth of the higher-price retail business over institutional business discussed in detail below.
Europe’s Net Flows Rebound, Catching Up to Those in the U.S.
Growth driven by net flows rebounded in Europe in 2014, catching up with that in the Americas and making Europe one of the fastest-growing regions for net flows after being the weakest following the crisis. European net flows in 2014 reached 1.7 percent of prior-year AuM, compared with 1.3 percent in 2013. Growth was driven in particular by very high net inflows in Spain and Italy and continued healthy flows in Scandinavian countries and Germany—despite weak performance in France and the UK.
The rise of net flows in Europe reflected, in part, the progressive resumption of mutual fund sales by European banks. In the initial years following the crisis, the banks focused instead on deposit account sales in order to fulfill regulatory mandates to improve their balance sheets.
In the Americas, net flows inched up to 1.7 percent of prior-year AuM, compared with 1.6 percent in 2013—with a repeat performance of 1.6 percent in the U.S. and even stronger performance in both Canada and Latin America at 2 percent and 3 percent, respectively.
In Asia-Pacific, growth of net flows slowed to 3 percent—following robust growth of 4 percent in 2013—owing largely to lower risk appetite in Japan and Australia. Excluding those two markets, flows in the rest of Asia-Pacific grew more strongly, at 4 percent—a higher rate than was expected in developed markets.
Viewed by segment, assets in the retail segment grew more rapidly than institutional assets, thanks to very solid net new flows of 3.7 percent of 2013 AuM, while net new institutional asset flows were just 0.1 percent of 2013 AuM. However, the higher retail net flows had little impact on retail assets’ share of total industry AuM, which remained at 39 percent.
Growing Pressure on Fees Impacts Net Revenues
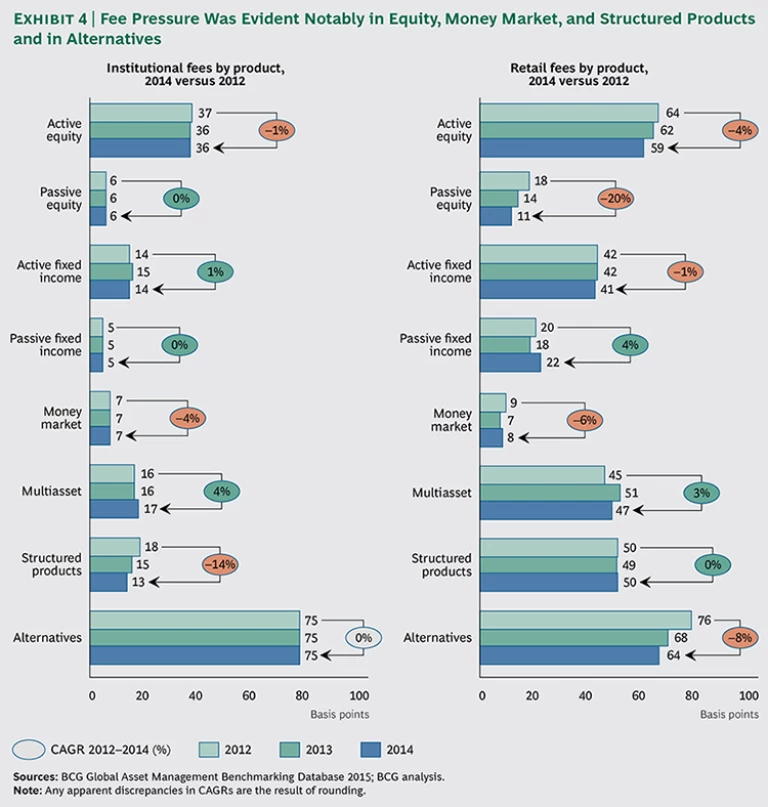
This is not the first year that fee pressure has contributed to a continuing decline in revenue margins for both retail and institutional managers. (See Global Asset Management 2014: Steering the Course to Growth, BCG report, July 2014.) Institutional investors continue to monitor fees more closely, challenging and renegotiating them.
In the retail segment, channel consolidation resulting in a more aggressive posture by intermediaries—particularly in the U.S.—and regulatory measures that bring increased transparency are both driving fees lower.
Product mix also continues to put pressure on fees, but only marginally. The continued stronger-than-average growth of low-price categories, such as passive products and liability-driven investments (LDIs), was offset by growth of higher-price products, such as retail solutions and real estate funds, and the decreasing value of money market assets. (See Exhibit 4.)
This trend is visible in the evolution of net revenues and costs in basis points as shown in Exhibit 3: revenues decreased from 29.5 basis points in 2013 to 28.8 basis points in 2014, and costs dropped from 18.0 basis points to 17.4 basis points. As a result of price pressures, many companies remained vigilant about their costs and kept the growth in costs at 6 percent in absolute terms—lower than the growth in average industry AuM at 9 percent.
Regulation, as noted earlier, is contributing to the pressure on fees in the retail segment. More broadly, regulatory change continues to be a substantial element of the challenging and uncertain environment that asset managers face globally. (See the sidebar “Surviving Regulatory Change and Vanishing Liquidity.”)
SURVIVING REGULATORY CHANGE AND VANISHING LIQUIDITY
Despite sustained record-level asset growth and profits, asset managers continue to face a challenging and uncertain environment, particularly regarding regulation—whether it addresses them directly or is part of a broader regulatory initiative such as that related to market liquidity.
In the U.S. market, regulation is driving profound change. In May 2015, the U.S. Securities and Exchange Commission announced a series of new reporting initiatives that will boost its industry oversight. As a first step, the agency is significantly increasing the volume of data it collects, requiring mutual fund firms to provide more detailed information—and to report with greater frequency—about fund assets. The initiatives require funds to give an account of their use of complex and potentially risky derivatives products. Currently, that data is captured neither frequently nor consistently.
Compliance with the new measures will increase costs and require additional screens and challenges for managers weighing new products in the U.S. market, as it will for managers based outside the U.S. that are considering whether or not to enter the U.S. market.
There is increased regulatory pressure and uncertainty in other regions as well. In Europe, the Markets in Financial Instruments Directive now impacts managers across the value chain—from product offerings and distribution to investment and operations.
At the investment level, too, there is increased uncertainty in major product areas, such as fixed-income, as well as in money market funds. Liquidity, or the lack of it, is a real issue for specific fixed-income instruments. In corporate debt, for example, the buy side today holds much more than sell side banks. This significant reversal of the historic norm is largely driven by banks’ inablility or unwillingness to hold those assets and take the balance sheet hit, thereby diminishing their historical market-making role. Meanwhile, buy side institutions continue to seek out higher-interest-bearing products. This new dynamic may be fine—that is, until the buy side becomes motivated to get out of its positions and banks are not there to step in as they once did. Some players have called for reforming corporate-debt issuance, making the process much more commoditized and therefore much more liquid. Yet little has changed.
As a result, asset managers must develop greater capabilities in pricing assets, taking into account enhanced risk analyses. Furthermore, despite recent growth, they need to continue to manage costs closely.
Positive Results Across All Regions and Segments
Results by managers were positive in all regions of the world in 2014, with relatively narrow differences in growth of AuM, revenues, and profits. This contrasts with previous years when, overall, U.S.-based managers fared better than others. This year, managers based in Asia-Pacific increased their average AuM slightly faster on average than those in the Americas and Europe—12 percent for Asia-Pacific, compared with 10 percent for the Americas and 9 percent for Europe.
While positive results were recorded across all regions on an averaged basis, not all managers benefited or did consistently well. Indeed, about 20 percent of managers experienced declining profit in absolute terms.
Measured by profit growth, Asia-Pacific and European managers fared slightly better than U.S. managers by boosting revenues faster than costs. U.S. players’ revenues increased 6 percent, but their costs rose 7 percent, resulting in operating-profit growth of just 4 percent. By comparison, Asia-Pacific players’ revenues and profits advanced 9 percent and 13 percent, respectively, while those of European asset managers advanced 6 percent and 10 percent.
Overall, this means that global asset managers should push for strong performance in every region and segment. Yet they must also recognize that positive results in one region or segment are not necessarily transferable, because success factors are often quite different from one region and segment to the next.
Unlike prior years, independent managers and managers affiliated with banking or insurance groups achieved, on average, very similar asset- and profit-growth rates. In the four years that ended in 2014, independent managers, on average, performed better than affiliated managers.
Some managers with affiliated distribution networks benefited from the recovery of retail distribution networks, especially in Europe. Still, their results continued to suffer in comparison with those of unaffiliated clients. Indeed, mostly captive players—those with more than 75 percent affiliated AuM—suffered net outflows from their unaffiliated business, registering –0.4 percent of their 2013 AuM in external retail channels and –3.8 percent with third-party institutional investors.
Success in unaffiliated channels for managers with mostly captive assets is challenging—because of their generally simpler, less diversified offerings—but it is not impossible. Some managers have succeeded by leveraging their captive business to fund innovation efforts against unaffiliated channels. Still, few of these players have managed to build the internal culture needed to promote this type of innovation and third-party focus in parallel with a captive focus.
The most significant difference across managers was the higher growth in AuM and profits of those focusing on the retail segment. Retail-oriented managers’ assets grew 12 percent in 2014, and their revenues and profits rose 9 percent and 11 percent, respectively. In contrast, managers focused on institutional markets increased their assets by just 8 percent and revenues by only 3 percent, while their profits shrank 1 percent.
The Product Shift Continues to Passives, Solutions, and Specialties
The product shift of recent years—from traditional actively managed products to passives, solutions, and specialties—held true in 2014, although the move toward specialties slowed.
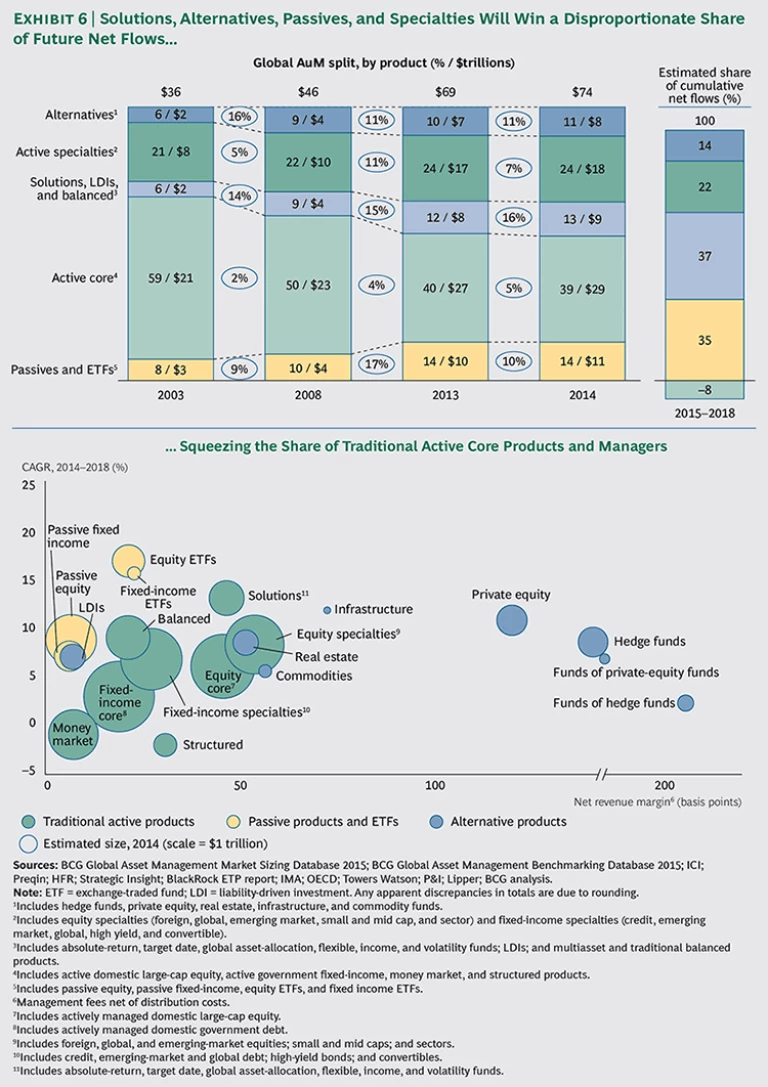
The AuM of traditional active products represented 39 percent of AuM at the end of 2014 compared with 59 percent in 2003, while alternatives grew from 6 percent to 11 percent, passive products from 8 percent to 14 percent, solutions from 6 percent to 13 percent, and specialties from 21 percent to 24 percent.
This ongoing shift reflects investors’ persistent hunt for more outcome-oriented products, greater portfolio diversification, and less-expensive products in core categories. Asset managers’ efforts to meet those needs helped drive 16 percent growth in assets held in solutions, including LDIs and retail solutions. In the U.S. and Europe, for example, target date funds and flexible funds have contributed to this growth.
In parallel, the ever-changing macroeconomic environment continues to drive the rotation of successful products. In 2014, the growth of specialty asset classes slowed, while active core product growth was boosted by rising equity markets and continued solid bond returns in Europe as rates continued to decline.
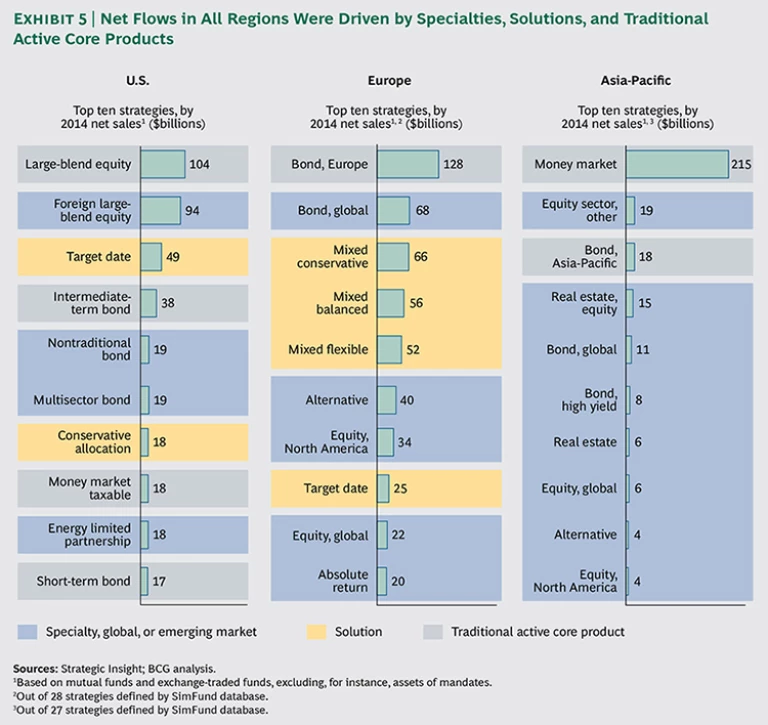
These trends were evident in the net flows ranking of mutual-fund product strategies across all regions. (See Exhibit 5.) Some active core products staged a comeback. European bonds in Europe and money market funds in Asia—both typical core products—took top positions in the rankings, reversing their comparatively weak performance in recent years. Specialties such as foreign equity, global bonds, and nontraditional bond funds still generated a hefty share of the net flows.
We continue to believe that the structural shift from active core products to solutions, alternatives, passive products, and specialties will continue. In particular, solutions and passives are likely to get a disproportionate share of the net flows, relative to their current size. They therefore will remain the fastest-growing categories, squeezing the share of active core products and managers as those products suffer net outflows. (See Exhibit 6.)
“Winner-Take-All” Accelerates in the U.S., Flattens in Europe
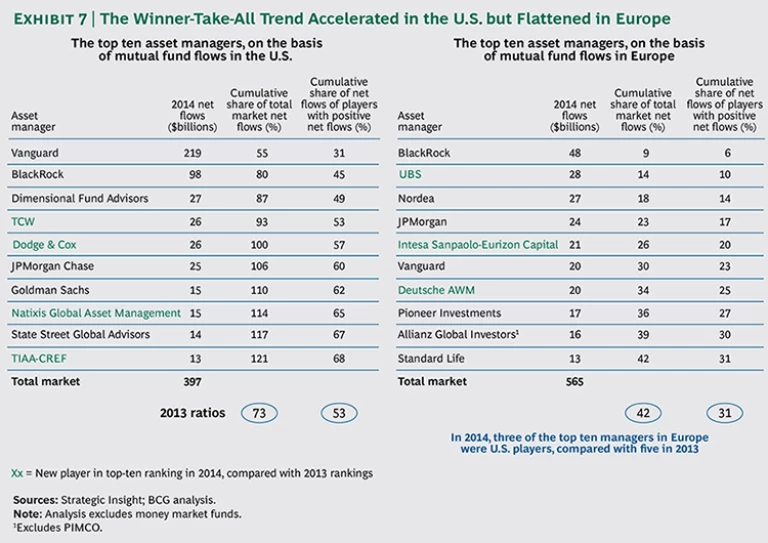
The winner-take-all trend of recent years—in which the top managers in mutual fund flows also capture a large share of net new asset flows—accelerated in the U.S. in 2014. The top ten U.S. managers, based on mutual fund flows in 2014, captured 68 percent of all flows from players with positive flows, compared with 53 percent in 2013. (See Exhibit 7.)
In Europe, the winner-take-all phenomenon remained unchanged and less pronounced. The top-ten table there comprises just 31 percent of players with positive flows, the same share as in 2013. This is not a surprise in Europe’s more fragmented markets, where local managers are still the leading players in each country.
The higher concentration in the U.S. market relative to Europe is driven largely by the shift in investor preferences, particularly toward passive products such as exchange-traded funds (ETFs), and the high concentration of leaders in those products, compared with smaller or slower-growing product categories. ETFs represented 50 percent of mutual fund flows in the U.S., 12 percent in Europe, and 20 percent in Asia-Pacific. The increased penetration of passive products in the U.S. in 2014 explains the rising strength of the winner-take-all trend there.
Once again, the composition of the top-ten asset-manager lists for each market remained relatively consistent with the year before, with six holdovers in the U.S. and seven in Europe. Top positioning, as always, was achieved by managers that dominated in the right product categories. Distribution capabilities also play a strong role. Both underscore the importance, understood by leading managers, of taking a systematic approach to the critical levers of go-to-market excellence.
Acknowledgments
First and foremost, the authors would like to thank the asset management institutions that participated in our current and previous research and bench-marking efforts, as well as the other organizations that contributed to the insights contained in this report.
The authors offer sincere thanks to their BCG colleagues Humberto Aboud, Eric Bajeux, Federico Burgoni, Pierre Catuli, Manish Saxena, Nishant Tripathi, and Andrea Walbaum, as well as to Fadwa El Khalil for external support. In addition, this report would not have been possible without the dedication of many other members of BCG’s Financial Institutions and Insurance practices.
