The container-shipping industry has a highly fragmented value chain, marked by complexity, overcapacity, and low returns. On the “sea side” of container shipping, the industry’s value chain comprises five main segments: brokers, financiers, owners, builders, and carriers. Each segment is highly fragmented, with many companies competing for market share and excess capacity everywhere. For example, across the chain, most leading companies command market share of only about 10 to 15 percent, while in each segment the top ten companies cumulatively account for less than 50 percent of market share.
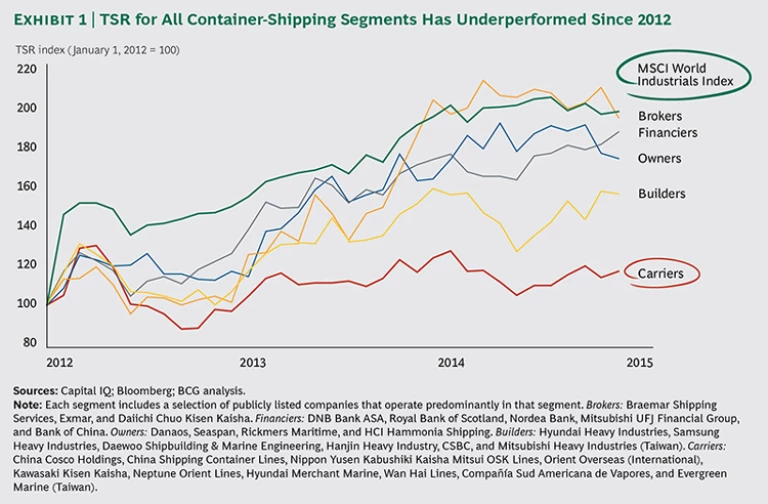
This dangerous combination of fragmentation and overcapacity has fueled a downward spiral that has decreased earnings and, thus, shareholder value. Since early 2012, total shareholder return (TSR) for all segments in the industry’s value chain has underperformed the MSCI World Industrials Index.
Destabilizing Change in the Industry
What can explain these disappointing figures? In part, most of this industry’s segments are experiencing destabilizing change.
- Ship Financing. Some large, traditional European banks started to withdraw support from the industry following the demise of Germany’s KG system and ship owners’ loan defaults resulting from TC rates for some vessel classes that were near operating-expense levels.
2 2 The KG system in Germany formerly consisted of as many as 1,600 Kommanditgesellschaft—or KG—shipping funds. Still, we’re seeing continued ordering of new tonnage financed by alternative sources such as Asian banks and financial investors. - Shipbuilding. The year 2014 saw shipyard utilization of only 65 percent, owing to a tenfold increase in shipbuilding capacity from 2002 through 2012, particularly in China. Thus, the shipbuilding industry has an incentive to push tonnage into the market. 3
- Ship Ownership. Many vessel owners continue to struggle with the new normal of low TC rates. Moreover, carriers’ redeliveries of chartered tonnage place an increasingly large portion of the idle-capacity burden on owners’ shoulders.
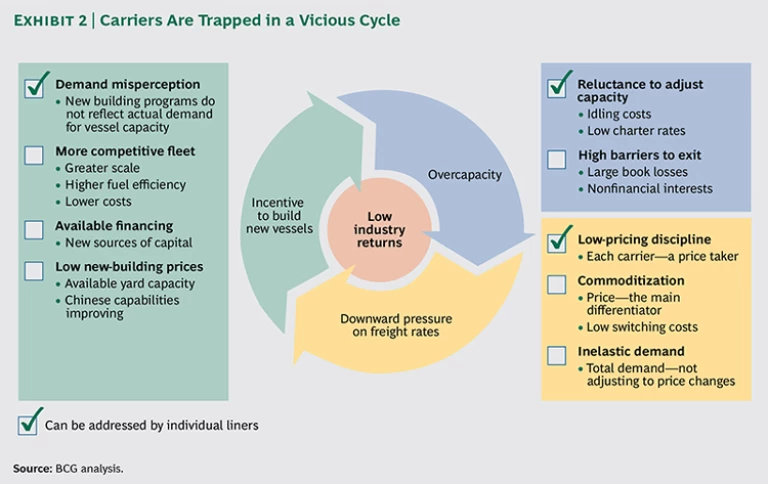
- Carriers. Many midsize carriers have negative operating margins as a result of low and volatile freight rates and poor operational performance. The industry is entrapped in a vicious cycle: to survive downward pressure that overcapacity has imposed on prices, carriers seek to lower slot costs by acquiring new, larger, and more efficient vessels. The net influx spawns further overcapacity and lowers vessel utilization, putting even more downward pressure on prices. Many forces are driving this cycle, and individual liners can address only a few of them. (See Exhibit 2.)
Scale Leader or Niche Specialist: The Key to Profitability
Since 2011, the container-shipping industry has lifted its overall profitability curve from a level at which very few carriers broke even to one at which some are able to post profits and register a return on the cost of capital employed. However, most carriers remain unprofitable. The handful of carriers that have managed to record a profit have maintained a laser-sharp focus on operational improvements in response to persistently decreasing freight rates. Disciplined network rationalization and cost-reduction programs—along with an increase in average vessel size aimed at lowering unit slot costs—have improved these companies’ earnings before interest and taxes (EBIT) margins.
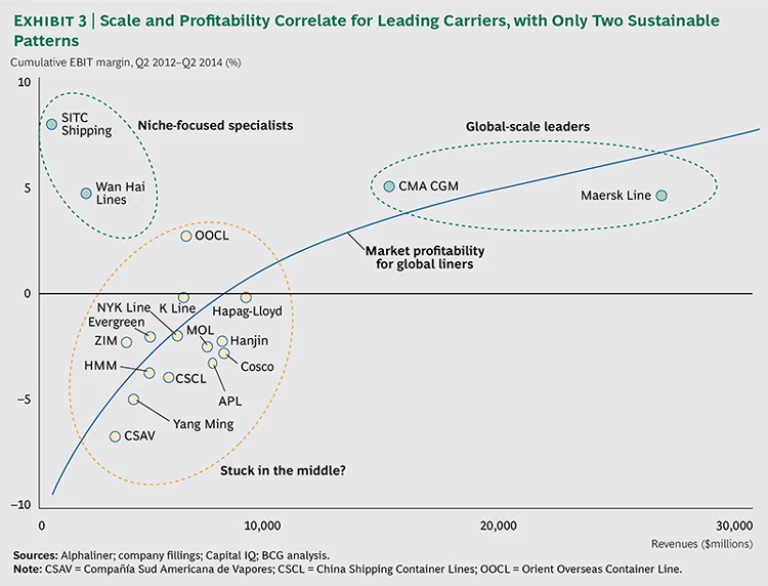
The two carrier types that have fared best are global deep-sea-scale leaders and niche-focused specialists. (See Exhibit 3.) The rest—midsize carriers—remain stuck in the middle, trapped between those two extremes.
Global deep-sea-scale leaders (with annual revenues ranging from $15 billion to $30 billion) leverage economies of scale to minimize slot costs, recording operating margins of about 5 percent in recent years. In 2014, however, some of these companies extracted more value from their scale, lifting their operating margins closer to 10 percent.
At the other extreme in terms of size, some niche-focused specialists have developed a sustainable competitive advantage in a specific region. For instance, many differentiate themselves by adopting an operating model that is specifically tuned to local needs. Although they bring in lower revenues than the global-scale leaders, the leaders in this group typically boast operating margins of 5 to 10 percent, thanks to their niche advantage.
Although we expect overall financial results for 2014 and the first quarter of 2015 to improve owing to rapidly falling bunker prices, carriers would be wise to view the improvement as a one-off event. Our analysis shows that because of overcapacity in the market and calculations used for bunker adjustment factor (BAF) surcharges, carriers will pass a big chunk of their fuel-cost savings on to customers, albeit with a two-month lag time (subject to individual carriers’ application of surcharges, pricing practices, and contracts). Hence, this will be a temporary profit windfall that will erode quickly, and it could give unwary carriers a false sense of sustainable profitability.
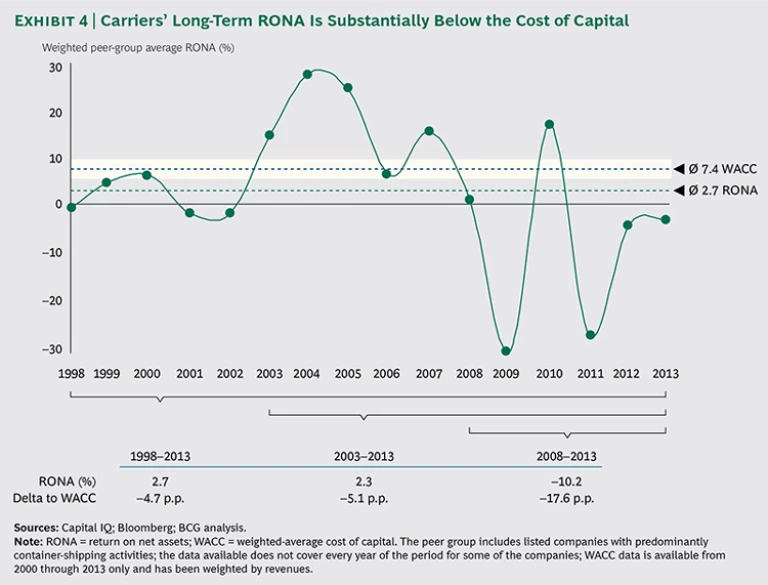
In covering their estimated cost of capital, most carriers face an uphill battle. (See Exhibit 4.) Indeed, over the past 15 years, their return on net assets (RONA) has been only about 3 percent. This is well below the 9 percent RONA of the S&P 500 for the same period, and it falls far short of covering the roughly 7 percent cost of capital needed to finance the assets deployed. Hence, not only have these carriers returned substantially less than companies in other industries, they have also destroyed significant value over a lengthy period.
Lifting Profitability: A Two-Step Approach
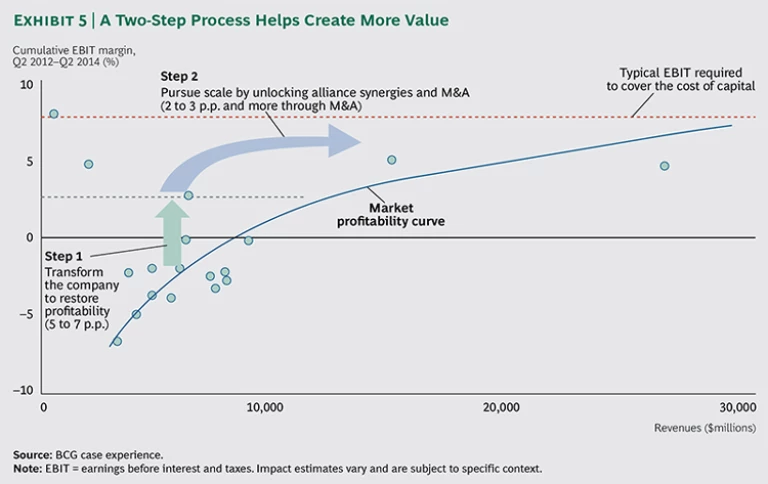
To lift their profitability, global carriers will need to adopt a two-step approach. (See Exhibit 5.) First, they will have to transform themselves internally by making the following moves:
- Extracting more value in the short term from commonly used cost- and revenue-improvement levers
- Defining a winning business model that spells out a clear and compelling value proposition, delivering on their value proposition by building the right operating model, and pursuing “next frontier” cost and revenue levers that can help them sharpen their competitive edge—and keep it sharp
- Designing a flatter and more agile organization by simplifying reporting layers and defining the right spans of control for managers, building a skilled transformation team, and fostering a performance culture by establishing the right performance indicators and setting the right targets
Second, carriers wanting to continue in the global deep-sea-scale business will need to create the required scale by unlocking the full synergy potential of their alliances or by pursuing mergers and acquisitions. Many carriers haven’t effectively implemented all aspects of their existing alliance agreements, and those alliances are sacrificing considerable value. More sophisticated alliances could help carriers capture that value by achieving more synergies through moves such as extended joint procurement, joint operations, and equipment pooling. In the long run, carriers could also pursue joint back offices or shared-service centers, as well as joint IT development, to create additional value.
Adopting more sophisticated alliance models would enable carriers to achieve an additional 2- to 3-percentage-point improvement in their operating margins, with further potential increases if they execute a full merger
These possibilities provide a light at the end of the tunnel for the many carriers stuck in the middle. However, to achieve such gains, carriers will have to stretch themselves to reach far beyond their current practices.
Acknowledgments
The authors would like to thank Dinesh Khanna, Seungwook Oh, Byung Nam Rhee, Tomer Tzur, Jesper Præstensgaard, Jihoon Kang, Mads Peter Langhorn, Sanjaya Mohottala, Yossi Arouch, Rüdiger Wolf, Mathias Thomsen, David Stone, Alexander Rasmussen, Johannes Schlingmeier, Johannes von Dungen, Iulia Tarata, Jonas Lorentzen, Dorota Korenkiewicz, Dustin Klimczak, Robert-Alexander Koch, and the team members of BCG’s Shipping Benchmarking Initiative.
