The growth of global private wealth hit a speed bump in 2015, especially in the developed markets, with all regions other than Japan experiencing a slowdown relative to the previous year. This development, combined with the ongoing decline of revenue and profit margins—all amid shifting client needs in both traditional and nontraditional segments—is forcing wealth managers to reevaluate their strategies.
Global Wealth 2016
- Navigating the New Client Landscape
- Three Areas for Action by Wealth Managers
- New Strategies for Nontraditional Client Segments
This year’s Global Wealth report includes two traditional features—the global market-sizing review and the wealth-manager benchmarking study—as well as a special examination of shifting client needs. The market-sizing chapter outlines the evolution of private wealth from both a global and regional perspective, including viewpoints on different client segments and offshore private banking. The benchmarking analysis is from a survey of more than 130 wealth managers and involves more than 1,000 data points related to growth, financial performance, operating models, sales excellence, employee efficiency, client segments, products, and trends in different markets and client domiciles.
We focused Three Areas for Action by Wealth Managers this year on three trends that are altering the face of wealth management worldwide: tightening regulation, accelerating digital innovation, and shifting needs in traditional client segments. These trends have already had an impact on wealth managers’ costs and profitability as banks scurry to implement new compliance measures, update their IT systems, and train their sales forces. Yet the inherent revenue potential is still largely untapped, signaling “areas for action” for agile wealth managers.
In New Strategies for Nontraditional Client Segments , we particularly look at how demographic and socioeconomic trends are setting the stage for the rise of nontraditional client segments—currently underserved or rising in importance—that do not necessarily fit the standard, net-worth-based service approach. Two such segments offering significant growth opportunities are female investors and so-called millennials (people born between 1980 and 2000). With investing profiles that often differ from those of others with similar levels of net worth, these two groups require a different mode of engagement that can address the mismatch between what they are seeking and what wealth managers are currently offering. A survey of more than 500 wealth-management clients led to some eye-opening findings.
In preparing this report, we used traditional segment nomenclature familiar to most wealth management institutions, dividing the client base into categories on the basis of private wealth holdings, as follows:
- Ultra-high net worth (UHNW): more than $100 million
- Upper high net worth (upper HNW): between $20 million and $100 million
- Lower high net worth (lower HNW): between $1 million and $20 million
- Affluent: between $250,000 and $1 million
Moreover, in order to clearly gauge the evolution of private wealth in nearly 100 markets worldwide (representing more than 99 percent of global GDP in 2015), we updated our market-sizing methodology this year to reflect both the availability of enhanced data sources and new research on the topic of private financial wealth. Refinements were made in such areas as how private wealth is defined, the comprehensiveness of data on wealth distribution among client segments and regions, and how future global wealth is estimated. All growth rates are nominal with fixed exchange rates.
As always, our goal in Navigating the New Client Landscape: Global Wealth 2016, which is The Boston Consulting Group’s sixteenth annual report on the global wealth-management industry, is to present a clear and complete portrait of the business, as well as to offer thought-provoking analysis of issues that will affect all types of players as they pursue their growth and profitability ambitions in the years to come. We provide a holistic view of the market, emphasizing how the entire wealth-management ecosystem interacts and where the best opportunities for wealth managers can be found.
Global Wealth Markets: A Slowdown in Growth
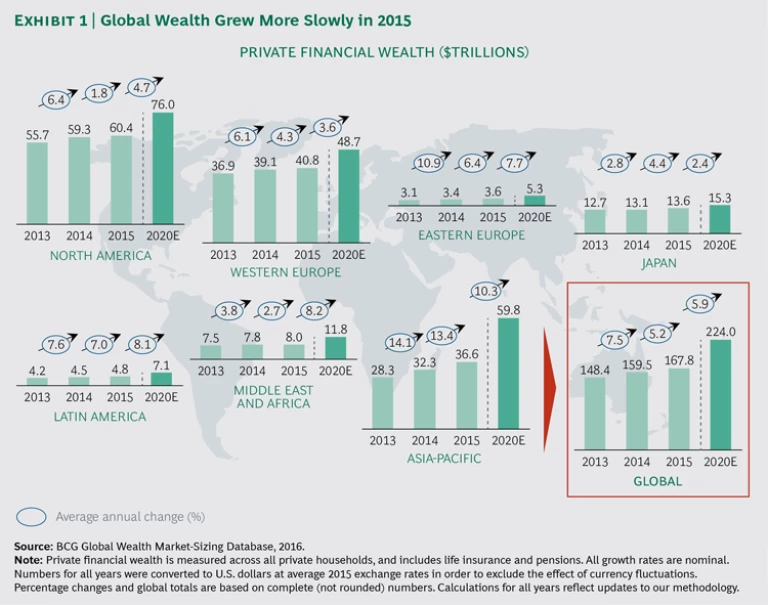
Global private financial wealth grew by 5.2% in 2015 to $168 trillion.
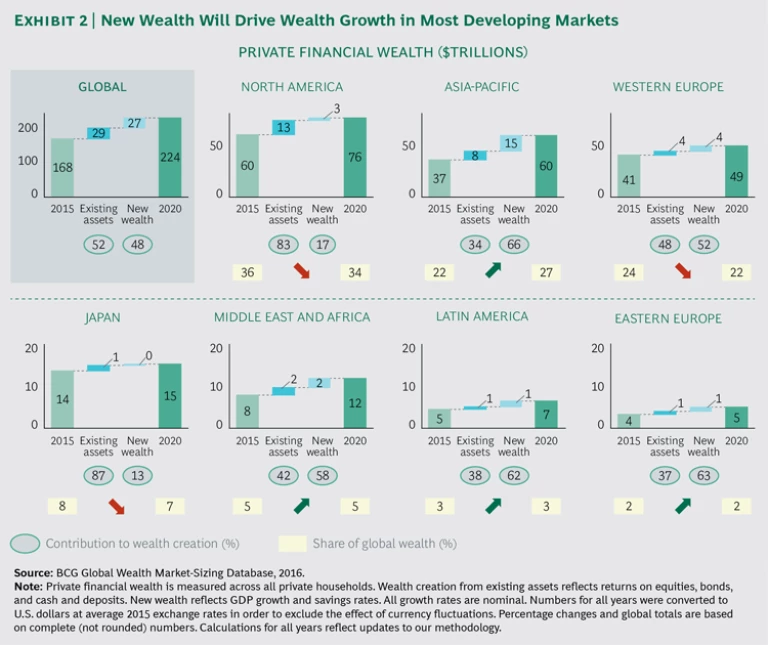
Unlike in recent years, the bulk of global wealth growth in 2015 was driven more by the creation of new wealth (such as rising household income) than by the performance of existing assets, as many equity and bond markets stayed fairly flat or even fell.
Significant slowdowns were seen in North America (2% in 2015 versus 6% in 2014), Eastern Europe (6% versus 11%), and Western Europe (4% versus 6%), with North America posting the lowest growth rate of any region. In Western Europe, uncertainty about the future of the European Union and continued low commodity prices weighed on equity and bond markets despite a generally promising start to the year. Some developing regions experienced significant slowdowns because of political unrest, international sanctions, and general economic tension. As in recent years, the highest growth in private wealth was seen in the Asia-Pacific region (13% in 2015, versus 14% in 2014), while the lowest growth in the developing markets occurred in the Middle East and Africa, or MEA (3% in 2015, versus 4% in 2014), where low commodity prices and political instability led to lower equity and bond markets.
If financial markets recover over the next five years, the rise of private wealth globally will return to being driven in roughly equal shares by the performance of existing assets and the creation of new wealth. (See Exhibit 2.) From a regional perspective, however, the principal driver of wealth growth will vary, with returns to existing assets dominating in North America and Japan, and newly created wealth generally playing a larger role in developing markets. As in 2015, the highest growth rates will likely be seen in Asia-Pacific, which combined with Japan is projected to overtake North America in total private wealth soon after 2020. The Asia-Pacific region is also expected to surpass Western Europe as the second-wealthiest region in 2017. Overall, private wealth globally is projected to rise at a compound annual rate of 6% over the next five years to reach $224 trillion in 2020.
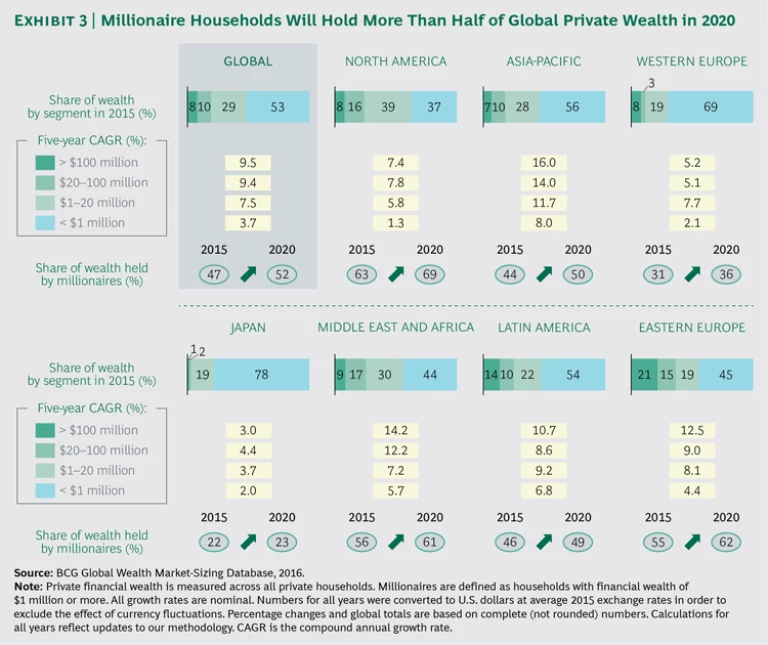
In terms of wealth distribution, the upper-HNW segment saw the strongest growth in wealth in 2015 (7%), particularly in Asia-Pacific (21%). The number of millionaire households grew by 6% globally in 2015, with their share of global wealth reaching 47%—a share projected to reach 52% in 2020. (See Exhibit 3.) Several countries, particularly China and India, saw large increases in the number of millionaire households in 2015, although there were no significant shifts in millionaire density compared with 2014, with Liechtenstein and Switzerland maintaining the highest concentrations.
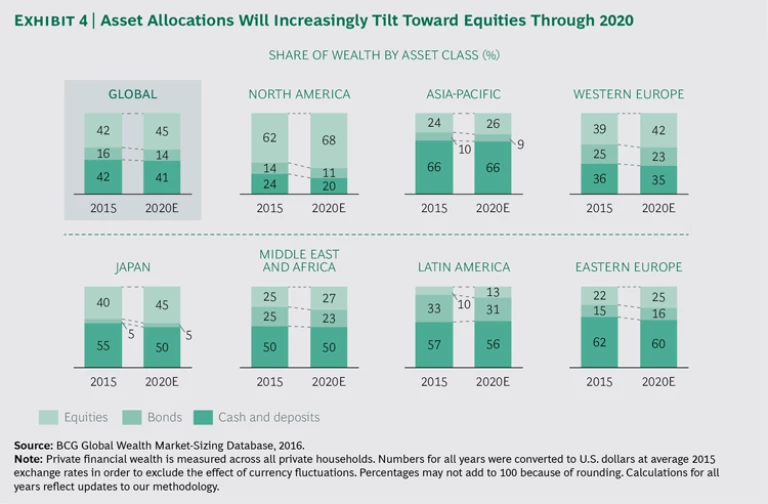
The vast majority of private financial wealth in 2015 was split evenly between cash and deposits on one side and equities on the other, which combined made up more than 80% of wealth assets globally. (See Exhibit 4.) Allocations varied by region, with Western Europe generally aligned with the global average, North America tilted more toward equities, and Japan dominated by cash and deposits. The picture was more uniform in developing regions, with cash and deposits typically being the most popular asset class.
Owing to generally disappointing financial-market performance, wealth held in equities grew at lower rates in 2015 than in recent years. If financial markets recover, assets will be expected to increasingly tilt toward equities over the next five years rather than cash and deposits or bonds, which in a low-interest-rate environment will continue to be less-attractive asset classes.
Highlights by Region
North America.
The November 2016 U.S. election is still a wild card with regard to its effect on financial markets. With a respectable stock market recovery, however, North American private wealth is expected to grow by nearly 5% per year to reach $76 trillion in 2020. The U.S. will remain the world’s wealthiest country, although North America is expected to be surpassed by Asia-Pacific (including Japan) soon after 2020.
The lower-HNW segment experienced the slowest wealth growth in North America in 2015, while the upper-HNW segment posted the strongest expansion, although still at a modest rate (2%). Millionaire households continued to control the majority of private wealth in North America (63%), the highest share of all regions. With a higher allocation to equities, wealth held by these households is expected to grow at a significantly higher rate than that of nonmillionaire households through 2020. In general, 62% of North American private wealth was held in equities in 2015, the highest share of all regions.
Western Europe.
The growth that was achieved was driven primarily by the performance of existing assets, albeit with some differences in equity market performance among countries. France and Italy, for example, enjoyed positive stock market performance, while U.K. equities were in negative territory, partly driven by a drop in the commodity sector. Regional wealth growth is expected to continue at rates similar to those in recent years, although this expansion could be held back by the low-interest-rate environment and the potential exit of Great Britain from the European Union. Further pressure could come from economic slowdowns in countries outside the region—such as China—in which Western European nations have high investment stakes.
In terms of wealth segments, the highest growth in Western Europe was registered by the lower-HNW segment (9%), with wealth held by the UHNW segment growing by 5%. There was variation among countries depending on specific stock-market results.
Equities stayed just ahead of cash and deposits as the most popular asset class in Western Europe. Over the next five years, the share of Western European wealth held in equities is expected to increase.
Eastern Europe.
Poland and the Czech Republic, the region’s two wealthiest countries after Russia, witnessed reasonable growth, while Ukrainian wealth declined by 6% largely as a result of political instability. With markets predicted to recover and commodity prices rising again, Eastern European wealth is expected to expand more strongly over the next five years, driven mainly by Russian wealth.
In terms of wealth distribution, the UHNW segment saw the most robust growth in Eastern Europe in 2015, with upper-HNW households also showing strength. Wealth held by both of these segments is expected to grow more rapidly through 2020—12% for the UHNW segment and 9% for upper-HNW households. The share of wealth held by millionaire households is expected to increase from 55% to 62% in 2020.
In terms of asset allocation, the highest share of Eastern European wealth remained invested in cash and deposits in 2015. The share of equities and bonds is expected to increase through 2020 at the expense of cash and deposits.
Asia-Pacific.
The upper-HNW segment posted the strongest growth in 2015, although this expansion is expected to lose some momentum in the run-up to 2020. The UHNW segment also achieved robust wealth growth in 2015 (15%), and is expected to grow at even higher annual rates until 2020 (16%), making it the fastest-growing segment in the region. As in all other regions, wealth held by millionaire households in Asia-Pacific is expected to grow faster than that held by nonmillionaire households, raising the share of wealth held by the former to 50% in 2020.
The highest share of Asia-Pacific wealth remained invested in cash and deposits, although the trend was moving somewhat toward equities. Bonds lost ground in 2015, a downward trajectory that is expected to continue through 2020.
Japan. Private wealth in Japan grew by 4% to $14 trillion in 2015, a higher rate than the 3% posted in 2014, making Japan the only region whose wealth growth surpassed that of the previous year. The growth in wealth in Japan was generated more from the performance of existing assets than from new wealth creation, as equities performed fairly well. In addition, corporate profits were strong and the central bank injected more money into the market. Wealth growth is expected to moderate through 2020 as capital investment and consumer spending remain sluggish, the low-interest-rate environment persists, and exports are dampened by decelerating growth in China.
The upper-HNW segment posted double-digit wealth growth in 2015 (13%), although this expansion is expected to slow through 2020 (to 4% annually) with its overall share of Japanese wealth remaining modest (2%). The lower-HNW segment should continue to hold nearly one-fifth of all Japanese wealth. Wealth held by millionaire households is expected to grow faster than that held by nonmillionaire households, but the difference in their growth rates will be modest, with Japan continuing to have a low share of wealth held by millionaire households (23%) in 2020.
In terms of asset allocation—and in contrast to other developed regions where equities are generally the preferred asset class—the highest share of Japanese wealth was held in cash and deposits in 2015. Wealth held in equities grew the most robustly, and is expected to continue to grow at a strong pace. Bonds will remain a less-attractive asset class given the low-interest-rate climate.
Latin America.
There were no significant shifts of Latin American wealth across segments in 2015. Wealth held by the UHNW as well as by the upper- and lower-HNW segments is expected to grow by 9% to 11% per year through 2020 owing to the anticipated equity-market recovery. The higher expected growth of wealth held by millionaire households (compared with that held by nonmillionaire households) will increase the former’s share of regional wealth to a projected 49% in 2020.
More than half of Latin American wealth remained invested in cash and deposits in 2015. In Brazil, however, the largest share of wealth remained in bonds. The share of wealth held in equities is expected to increase in the region through 2020.
Middle East and Africa.
Wealth distribution was unchanged in MEA in 2015, with no significant shifts among segments. Millionaire households, already holding more than half of all regional wealth in 2015, are expected to see their share grow over the next five years. Roughly half of MEA wealth remained invested in cash and deposits in 2015, but the share of equity-based wealth is expected to rise.
The Offshore Perspective
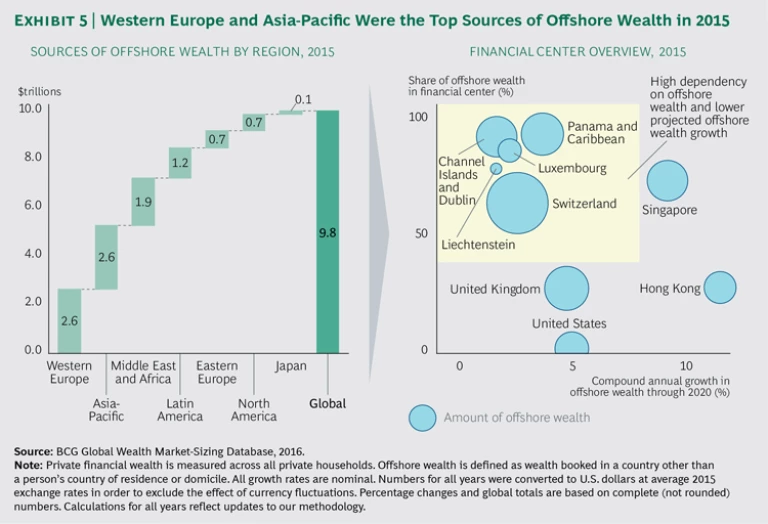
Private wealth booked in offshore centers grew by about 3% in 2015 to almost $10 trillion. A key factor was the strong repatriation of offshore assets by investors in developed markets. Indeed, offshore wealth held by investors in North America, Western Europe, and Japan declined by 3% in 2015.
On a regional basis, the largest sources of offshore wealth were Western Europe (mainly the U.K., Germany, and France), Asia-Pacific (mainly China, Taiwan, Hong Kong, and Indonesia), and MEA (mainly Saudi Arabia, Nigeria, and the United Arab Emirates). (See Exhibit 5.) The top three source countries were China, the U.S., and the U.K., although their offshore shares relative to total wealth varied significantly (1% for the U.S. versus 6% for the U.K.).
Overall, the shift from developed regions (the “old” world) to developing regions (the “new” world) as the primary source of offshore wealth has become more pronounced. Today, 65% of offshore wealth originates from the new world, compared with 57% five years ago. In addition, the share of wealth held offshore varies significantly among regions, with MEA and Latin America being the front-runners, both with roughly 25% of total private wealth held offshore. In these regions, economic and political tensions (as well as access to financial products not available onshore) have continued to contribute to the flow of wealth offshore as investors actively search for the most attractive locations in which to domicile their assets.
The annual growth of offshore wealth globally is expected to pick up again through 2020, although at a lower rate than onshore wealth (5% versus 6%). One factor is that although regulatory measures aimed at fighting tax evasion will continue to persuade some old-world investors to repatriate their wealth, regulation also stabilizes the market and provides new opportunities to move fully taxed wealth offshore in search of better service quality, product diversity, and economic stability. Offshore wealth originating in the old world is expected to show positive growth again (2% annually through 2020, compared with 6% sourced from the new world). Nonetheless, the overall share of total global wealth booked offshore is projected to decrease from 6% in 2015 to an estimated 5% in 2020.
Among offshore centers, Hong Kong and Singapore saw the strongest growth (about 10%) in 2015. Switzerland remained the largest destination for offshore wealth, holding nearly one-quarter of all offshore assets globally, followed by the U.K. and the Caribbean, including Panama.
The outlook for offshore centers located in the new world remains positive given their proximity to high-growth regions. Offshore wealth booked in Hong Kong and Singapore is projected to grow at roughly 10% annually through 2020, increasing their combined share of the world’s offshore assets from roughly 18% in 2015 to 23% in 2020. Despite the high projected growth of most new-world offshore centers, Switzerland is expected to remain the largest single center through 2020 owing to its high service quality, diverse product offerings, political stability, safe-haven currency, and attractive location in the center of Europe.
The Shifting Competitive Climate Among Offshore Players. While the reasons that many investors send assets offshore remain more or less the same, the provider side is changing significantly. Indeed, many banks with offshore operations are engaged in rigorous portfolio analyses. Their objectives are essentially threefold: reducing regulatory risks, achieving scale and growth, and focusing on the core business.
- Reducing Regulatory Risks. The rapidly rising cost of ensuring regulatory compliance, especially with regard to anti-money-laundering and tax compliance rules, is making it very difficult for offshore banks to remain active in smaller markets. Some banks have shed assets originating from clients in certain domiciles in order to reduce not only complexity along the value chain but also operational and reputational risks.
- Achieving Scale and Growth. Amid the rising cost of doing business, reflecting not only regulatory measures but also the ongoing need for IT investment, banks that lack scale and the resources to expand will continue to face pressure to consolidate. Many have been active on the M&A front. In addition, with regulatory frameworks such as the so-called European passport (which grants a bank licensed in any EU member state the right to operate freely across the European Economic Area), a number of players have begun to regionalize their wealth-management operations, effectively blurring the lines between onshore and offshore bookings. Domiciles such as the U.K. and Luxembourg have attracted a number of Chinese, Russian, Middle Eastern, and Swiss wealth-management institutions that have ambitions to serve the entire European market.
- Focusing on the Core Business. The complexity of managing too many domiciles has prompted some larger offshore banks to retrench and concentrate their businesses in core markets, exiting regional or more far-flung areas. This trend, in addition to the search for scale among smaller players, has contributed to consolidation across the offshore industry. And with our offshore-focused benchmarking participants in 2015 each still serving an average of 108 client domiciles, the peak of consolidation has likely not been reached. M&A activity may also give nontraditional players an opportunity to enter the market, as some retail and investment banks have already done.
Evolving Front-Office Models. With the emphasis shifting to core domiciles, front-office structures are becoming more team-based and market-focused. Given increased service complexity and more onerous compliance requirements, relationship managers (RMs) are concentrating on fewer markets. For banks that have made this transition in their operating models, the number of markets served per RM has decreased from an average of 15 to 20 to an average of 3 to 5 in any specific region.
Client Interaction with RMs. The level of interaction between offshore clients and their RMs has increased. This trend is due to both difficult market conditions (such as low interest rates and high stock-market volatility) and the amount of client information banks must gather to satisfy new transparency obligations. Although digital technology can help make processes smoother, banks need to obtain detailed histories of clients and their sources of wealth and fully adhere to all relevant regulatory and compliance standards. Such requirements are making offshore banking more resource-intensive, leading to front-office costs per client that are close to those of onshore operations (21 basis points on client assets and liabilities). Nonetheless, more frequent interaction should also provide opportunities for wealth managers to serve clients better. The value propositions of leading offshore bankers are putting more emphasis on service models that are highly customized by market, region, and segment, since being offshore is no longer an attractive selling proposition in and of itself.
