In 2015, the asset management industry recorded its worst performance since the 2008 financial crisis. Growth in assets under management (AuM) stalled, and net new flows of assets, revenue growth, and revenue margins all fell. Fee pressure on managers continued to rise.
Tepid markets and turbulence, which persist in 2016, are today’s reality. That becomes clear at the outset of this report, The Boston Consulting Group’s fourteenth annual study of the asset management industry worldwide. A summary of financial performance and a discussion of competitive trends in this article emphasize that asset management continues to rank among the world’s most profitable businesses. At the same time, the results highlight the continuing dependence of many managers on rising financial markets to boost asset values rather than on long-term competitive advantage to generate net new flows.
Market-driven asset growth is in the rearview mirror. That gives asset managers an opportunity—and a mandate—to assess the real state of their business and the step change in capabilities required to prevail when market growth isn’t a given.
As they do so, it will become increasingly clear that competence in advanced data and analytics will define competitive advantage in the industry in the not-too-distant future. Today’s managers face a fundamental and indisputable need to support their investment processes by developing increasingly advanced capabilities in these digital technologies. The alternative, for most firms, is to risk becoming irrelevant and trailing others in the ability to generate superior investment returns.
Armed with these cutting-edge techniques, asset managers have the potential to gain a significant information arbitrage advantage over their peers and are positioned to understand, monitor, and fend off the growing array of risks that confront managers, their clients, and the global financial system.
Global Asset Management 2016: Doubling Down on Data As the views of managers and regulators converge, firms have a clearer path to their next risk investments. This report’s discussion is informed by extensive additional benchmarking, including measurement of key capabilities defining a comprehensive risk management function.
While the strategies that guide investment decisions have evolved considerably over the years, the tools and analyses underlying them have remained largely the same. Now, however, the wave of new digital technologies, techniques, and data brings huge potential advantage. Crucial to that endeavor is the An Asset Manager’s Guide to Data and Digital Disruption , the blueprint of an asset manager’s ideal future state. Once considered the province of just a small subset of alternative managers, advanced technologies that include machine learning, artificial intelligence, natural-language processing, and predictive reasoning are beginning to join the mainstream. They’re giving fast-moving firms and financial-technology providers the ability to model scenarios that push the boundaries of traditional analytics, and they’re delivering targeted insights with unprecedented precision and speed.
This report, like its predecessors, is the product of market-sizing research, an extensive benchmarking survey, and insights gathered from our activities in the marketplace. The benchmarking involved nearly 140 leading asset managers—representing $40 trillion, or more than 55%, of global AuM—and covered more than 3,000 data points per player.
The more detailed assessment of the risk management function in this year’s survey included measurements of fundamental capabilities that define the risk management function, such as governance, scope, organization, data, and systems; a review of the organizational model; and detailed benchmarking of risk management staffing and spending.
The aim of our annual research is to provide new insight into the state of the industry and its underlying sources of profitability to help managers build prosperous paths to the future.
Read More On This Topic
Global Asset Management 2016
- Doubling Down on Data
- Asset Managers Get Real with Risk
- An Asset Manager's Guide to Data and Digital Disruption
Global Assets Under Management Stall at $71.4 Trillion
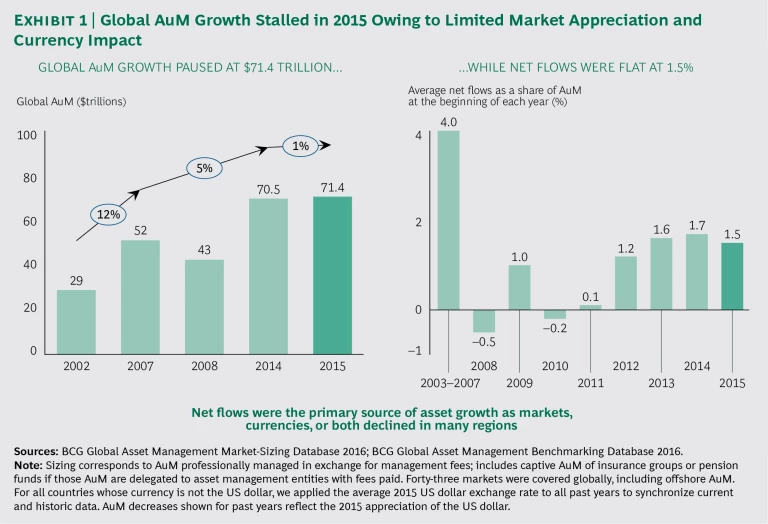
The global asset management industry endured a year of flat growth in 2015. Weak financial markets and currency turbulence conspired to produce the industry’s weakest overall performance since the 2008 financial crisis.
The global value of assets under management (AuM) remained essentially flat in 2015, rising just 1%, to $71.4 trillion from $70.5 trillion, after growing 8% the year before and at an average annualized rate of 5% from 2008 through 2014.
The lack of growth was due largely to continued tepid net flows and the generally negative and turbulent performance of global financial markets, which failed to buoy the value of invested assets as in prior years. At the same time, the rising value of the US dollar reduced asset values in dollar terms. (See Exhibit 1.)
Net new flows, the lifeblood of the industry’s growth, dipped slightly in 2015 to 1.5% of prior-year AuM, remaining in the same range as during the three previous years.
The results underscored the continuing
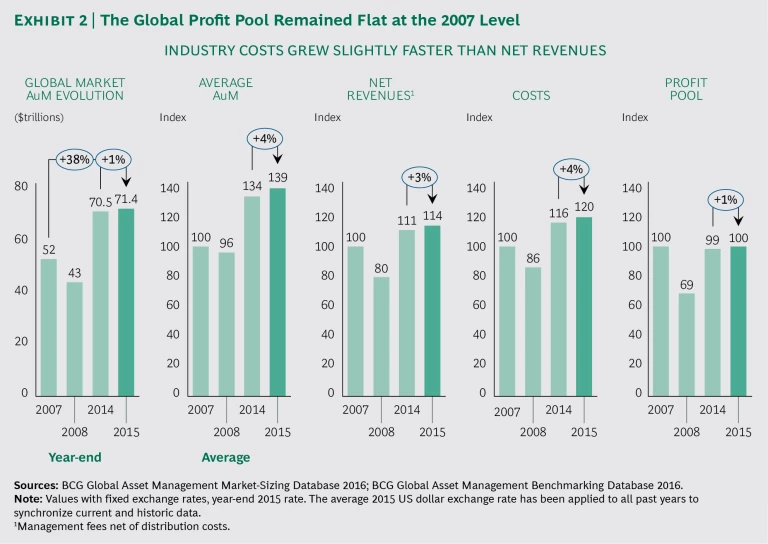
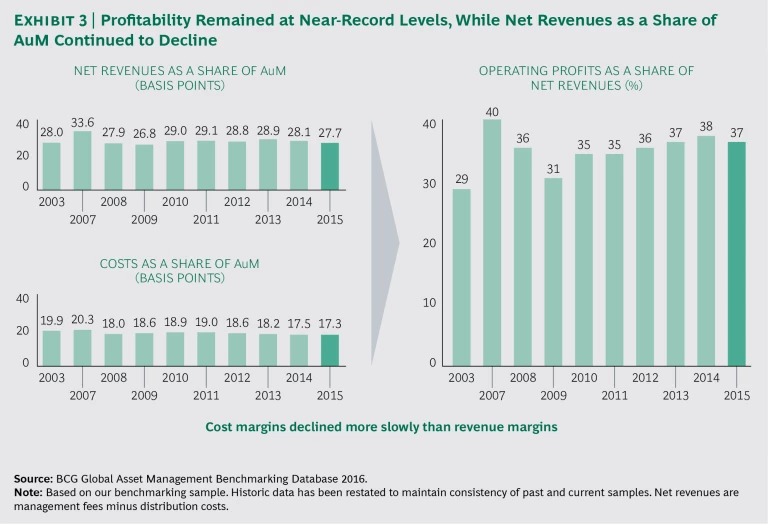
Profits remained relatively stable in 2015, rising 1% to reach $100 billion. Profits as a percentage of revenues remained at a healthy 37%, just slightly below the 2014 level, due to increased cost management by asset managers. However, because industry costs rose 4% in 2015, ahead of the 3% growth in net revenues, asset managers will need to undertake even bolder efficiency measures to slow the growth of costs and to make their cost structures more flexible in response to shifting sources of revenue growth. (See Exhibit 2.)
Timid net revenue growth of 3% in absolute terms in 2015 was constrained by slow growth of only 4% in average AUM and by the decrease in overall revenue margins in basis points. After remaining essentially flat from 2010 through 2013, margins fell substantially from 28.9 basis points in 2013 to 28.1 basis points in 2014 and to 27.7 basis points in 2015, as asset managers continued to face fee compression. (See Exhibit 3.)
The decline in revenue margins was visible across client segments. On the institutional side, the decline was driven by intense market competition and increasing vigilance by institutional investors over fees. On the retail side, distributors’ growing power and regulators’ push for fee transparency and fairness helped compress margins.
Notably, the net decline in revenue margins in 2015 was not the result of shifts in product mix, which historically have been the main source of decline. A decrease in active specialties and an increase in liability-driven investment and money market assets put downward pressure on revenue margins, but the pressure was offset by an increase in solutions and alternatives. Now, however, margin compression resulted from strong pressure on fees, which was particularly acute for most traditional asset managers.
The weak results in 2015 provided fresh evidence that the industry’s business models are increasingly susceptible to long-term trends—a vulnerability that has been masked by the high profits earned by the industry and the historically strong growth of assets generated by strong capital markets globally.
AuM Grows in Asia-Pacific, Europe, and Latin America
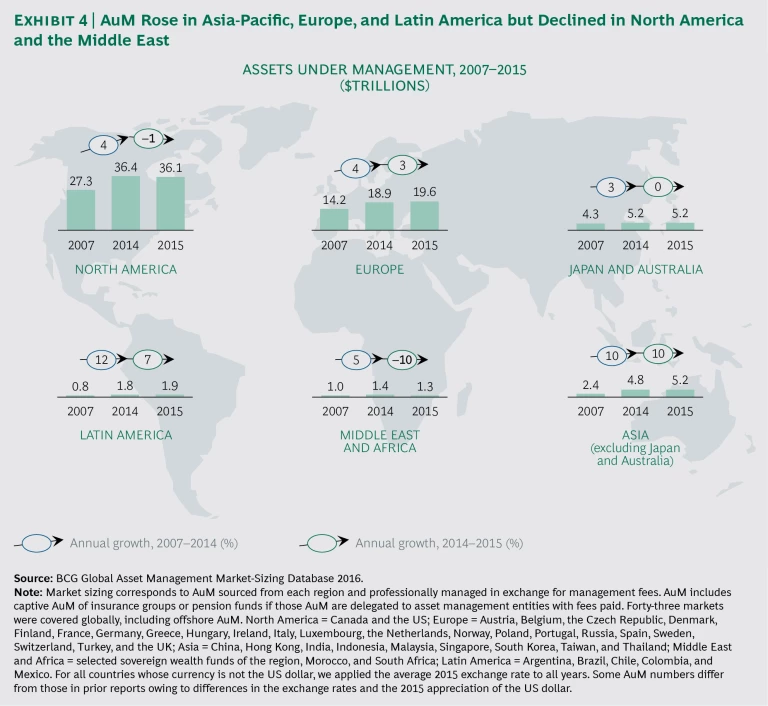
Growth as measured by AuM varied widely by region in 2015. AuM decreased in North America and the Middle East but rose elsewhere. Growth was modest in Europe and strong in Latin America and Asia, excluding Japan and Australia. (See Exhibit 4.)
The 10% growth of AuM in Asia was relatively robust, but it once again trailed the rapid expansion of the region’s private wealth. (See Global Wealth 2016: Navigating the New Client Landscape , BCG report, June 2016.) Asset management’s penetration of the wealth market in Asia continues to lag behind its penetration in other parts of the world, restraining the industry in the region that is setting the global pace of private-wealth expansion.
For global and regional asset managers, that disparity should signal a missed opportunity in a region whose wealth is quickly gaining on Europe’s.
The regional AuM results reflected, in part, the pattern of performance by global equity markets in 2015. Markets were largely positive in Europe—especially in France, Germany and Italy—and mostly negative elsewhere, especially in the US, the UK, China, Australia, and most emerging markets.
For fixed income, very low returns were ubiquitous globally in 2015—less than 1% on average and negative in some Asia-Pacific markets.
The US dollar’s appreciation against other currencies in 2015 hurt results for international business, undercutting AuM in dollar terms. For some managers, the dollar’s rise was the leading cause of declining AuM.
Net Flows Are Strong in Europe and Asia-Pacific
Net new flows of assets varied widely by region. Flows were robust in much of Europe and Asia-Pacific but tepid in the US. Flows in Europe and Asia-Pacific reached 2.5% and 3% of 2014 AuM, respectively, showing strength in most of those regions’ markets. This performance marked a recovery of net flows in France, Benelux, and Eastern Europe. It reflected continued improvement in Germany, Spain, and Italy—where net flows were above 5%—as European banks resumed or accelerated mutual fund sales efforts that had been curtailed in recent years. In Asia-Pacific, China and India were among the markets where net flows exceeded 10% of prior-year AuM.
The UK was weak for a second consecutive year, with net flows at 0.4% of 2014 AuM. In the US, net flows slowed to about 1% of prior-year AuM, compared with 1.7% in 2014.
Retail’s Performance Lead over Institutional Widens
The growth gap between the retail and institutional segments widened for the fourth year in a row. Retail AuM increased its share of global AuM to 40% at the end of 2015, compared with 37% at the end of 2011. The growing share reflects a significantly higher rate of net flows in the retail segment. The institutional segment attracted 2015 net inflows of only 0.3% of 2014 AuM, while the retail segment achieved 3.3%.
The retail segment continued to benefit from the worldwide rise in private wealth, although that growth slowed in nearly all regions in 2015. Overall, global wealth—led by Asia-Pacific—is expected to rise at a compound annual growth rate of 6% over the next five years, reaching $227 trillion in 2020.
Retail managers also benefited as long-term investments, such as insurance and retirement products, continued to increase their share of investors’ overall savings.
The institutional segment’s weak flows, in contrast, were the result of several factors. One was the “decumulation,” or distribution, of both defined-benefit and defined-contribution pension plan assets. Another factor was the trend among pension funds to reduce costs by moving investment management in-house. This was especially the case for traditional products, as well as for new types of real assets—including alternatives such as infrastructure, real estate, and private debt—of the largest pension funds.
Continued flows out of sovereign wealth funds also weakened institutional performance, a reversal of the funds’ recent record in attracting new money. Sovereign funds have now suffered significant outflows for two years owing to volatility in commodities—in particular, the sharp decline in oil prices.
We believe that the institutional trends described above will remain true for the medium term. These trends will benefit managers with strong access to retail and defined-contribution channels.
However, some institutional clients did generate positive net flows. Among them were European insurers that benefited from continued access to investment sales from their retail insurance clients. European insurers, separately, increasingly consider outsourcing to external investment managers to offset persistently low fixed-income yields through enhanced diversification of assets. (See “US Insurers Consider the Alternatives.”)
US INSURERS CONSIDER THE ALTERNATIVES
The quest to diversify assets as insurers hunt for higher returns in a low-interest-rate environment suggests that there might be a significant opportunity for asset managers—both independent and insurance owned—to curate and offer alternative investment products for small insurance companies in the US.
Although alternative investments have expanded quickly as an asset class among larger US insurers, relatively few small carriers have direct access to alternatives. That’s because small players lack the scale and resources to properly assess and manage alternative providers and products—or to oversee the complex issues of diversification. A targeted offering from asset managers would allow small insurers to benefit from alternatives’ potentially higher returns and greater diversification without having to allocate the billions of dollars in investments that are usually required.
Such third-party offerings could fit well with the recent trend among asset man-agers to profit by providing outsourced chief-investment-officer (oCIO) solutions for insurers. Instead of focusing on specific mandates within asset classes, oCIO solutions target all of an insurer’s assets and liabilities and offer asset liability management and strategic asset allocation for their customers. In the case of alternatives, this would include determining the optimal exposure to alternatives—taking into account the structure of liabilities, risk, and capital allocation of the entire asset base.
For asset managers, offering oCIO services is an opportunity to monetize investments in data, analytics, and risk management capabilities that they already are undertaking on their own behalf.
Alternative investments have grown significantly as an asset class among US insurance companies, increasing from 3.8% of insurers’ general accounts in 2008 to 5.4% in 2014. That represents a net inflow of roughly $150 billion—nearly double the total value of alternatives held in 2008.
However, those alternative investments are heavily concentrated among the largest carriers. In life insurance, the five leading carriers of the roughly 800 US life insurers account for more than half of all alternative investments. In property and casualty, alternative investments are similarly concentrated among the largest carriers.
Whether or not large insurers are nearing a saturation point in alternatives, smaller insurers have ample room to expand their relatively modest allocations tremendously before reaching similar levels.
The Shift to Passives, Alternatives, Specialties, and Solutions Persists
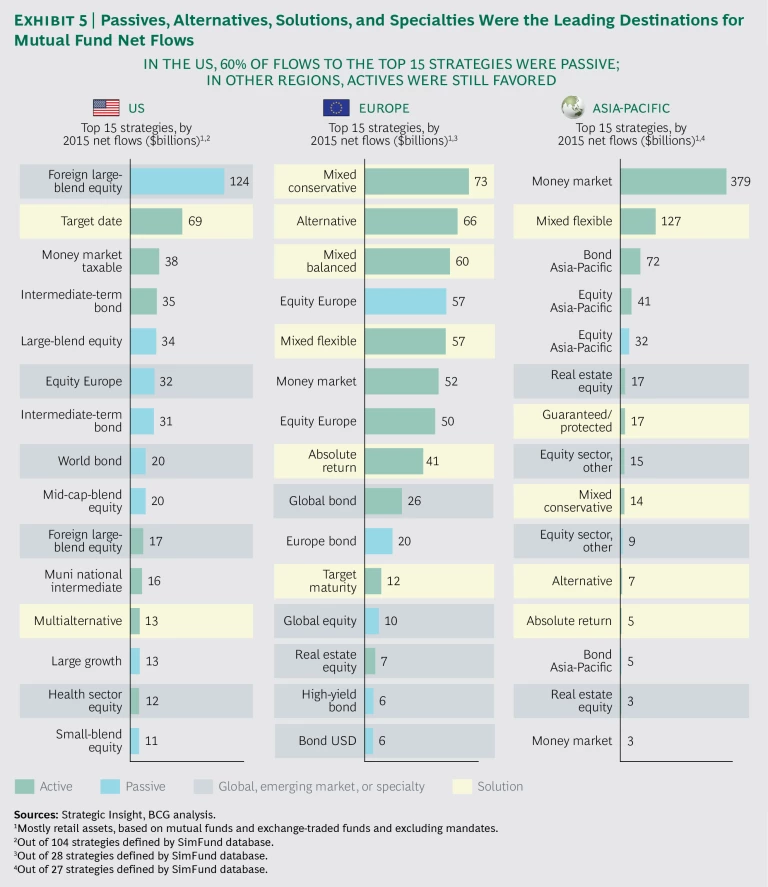
Recent investment product trends accelerated in 2015 with a continuing shift from traditional active core products to passives, alternatives, specialties, and solutions. This was evident in the 2015 league tables for mutual fund flows domiciled by region. Still, the dynamics are at different maturity levels across regions. (See Exhibit 5.)
The trend to passives was particularly striking in the US, the most sophisticated and mature passive market. Of the top 15 mutual fund categories, by net flows, 8 were passive, with strength evident both in equity and fixed-income assets. Passive foreign large-blend equity was the top product category by net flows. It is interesting to note that passive is expanding beyond core asset classes into specialty asset classes.
In Europe, passives were not as strong but still showed solid growth with 5 of the top 15 mutual fund categories. This reflected inroads made by passive bond funds and also, notably, by passive specialty funds. European equities, the top equity category, attracted more net flows into passive funds than into active.
In Asia-Pacific, the shift to passives accelerated, representing 3 of the top 15 mutual fund categories. Net flows to those passive strategies nearly matched the flows to equivalent active strategies. The shift suggests that the region’s investors have begun a strong swing to passives, similar to the trend in the US and Europe. Strong money market flows, particularly in China, reflect interest rate liberalization that is inducing investors to move funds out of bank deposits.
Specialties (including passively managed specialties) and solutions also remained key drivers of net flows, although less so than in recent years.
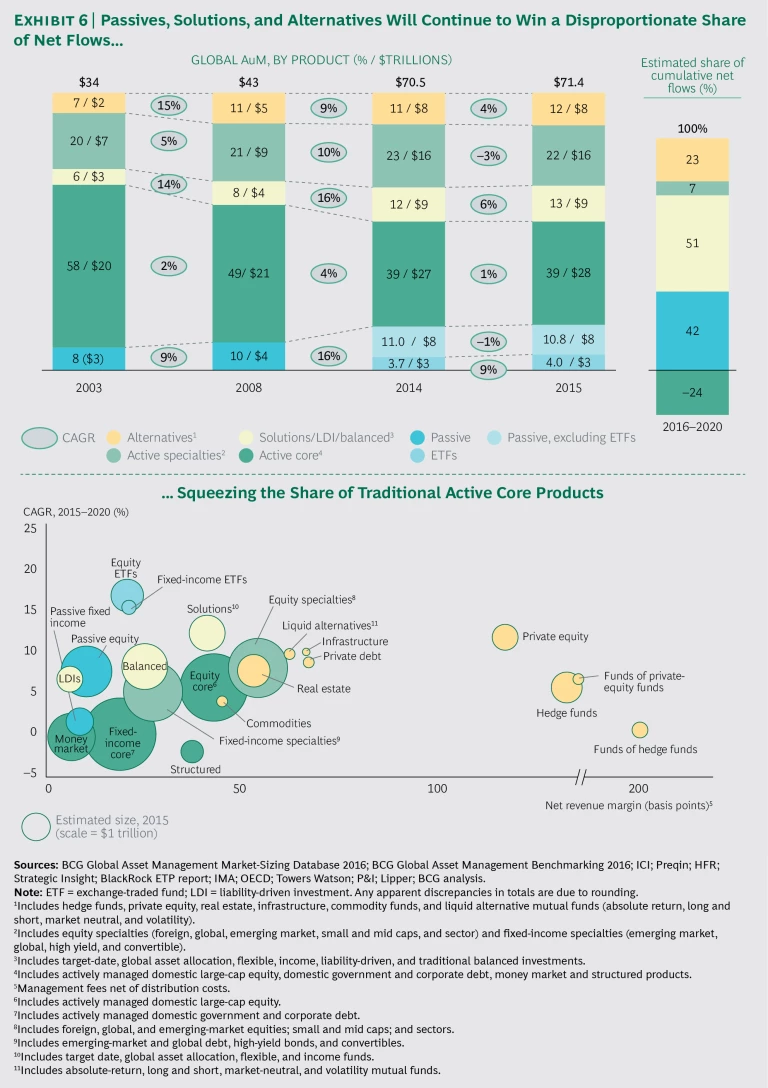
The 2015 pause in the long-term growth of passives—which had grown from 8% of industry assets in 2003 to 15% in 2014—resulted largely from a decline in the assets of large passive mandates and non-exchange-traded funds (non-ETFs), from outflows at some large institutional segments, such as sovereign wealth funds, and from market and currency impact. ETFs, however, continued to achieve unrelenting growth and gains in market share.
Overall, we believe that the shift in investor preferences in recent years to passives, solutions, specialties, and alternatives will continue to squeeze the share of traditional active core products. (See Exhibit 6.)
The Range of Successful Business Models Will Narrow
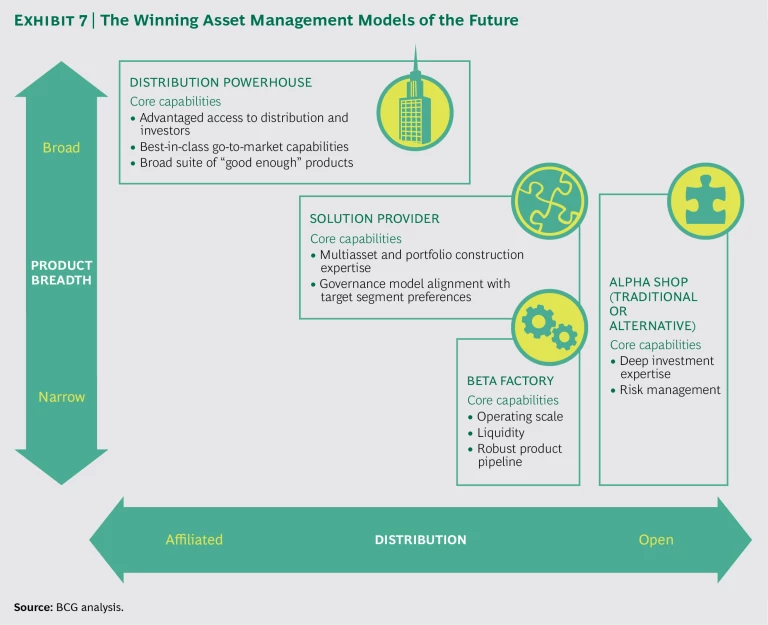
On the basis of sustained industry trends and their underlying—macroeconomic, regulatory, technological, and investor—drivers, we have identified four business models that are best positioned for success in the future:
- Specialized alpha shops
- Beta factories
- Solution providers
- Distribution powerhouses
The sustained industry trends and expected slow growth will create specific challenges and opportunities for asset managers. Those that lack a sustained competitive advantage will be particularly challenged.
The four identified models for success are grounded in one or more clear, compelling, and sustainable sources of competitive advantage for asset managers. (See Exhibit 7.)
- Capability to generate alpha grounded in deep investment expertise in specific asset classes and investment strategies, known as specific scale, and supported by experience curve benefits
- Operating-model efficiency and strong liquidity
- Capability to deliver solutions (for example, multiasset class portfolio construction, asset allocation, manager selection, and monitoring) to target investors
- Advantaged access to distribution
Specialized Alpha Shops. Active managers will nonetheless maintain a sizable AuM share and an even larger share of revenues despite the declining share of overall industry assets, as passive assets gain share. Specialized alpha shops will employ long-only strategies, leveraged strategies, or both, as the distinction between active management of traditional and alternative assets diminishes. Active management will continue to appeal to institutional investors (directly or through consultants) in the asset classes in which investors are willing to pay higher fees for the promise of alpha. In the retail market, however, specialized alpha shops will focus on financial advisors and private-wealth managers who seek to bring active management to their high-net-worth and sophisticated retail investors, either as standalone products or as a component of a multiasset class solution.
Successful alpha shops will differentiate themselves through deep investment expertise in a specific asset class or investment strategy in which their specific scale has allowed them to move farther up the experience curve than other managers. Experience curve benefits in a specific asset class or investment strategy far outweigh the efficiency benefits of firm-wide scale. Large alpha shops with scale in more than one specific asset class or investment strategy can be successful, but smaller managers are more likely to maintain the focus that is required to achieve specific scale. Larger managers benefit from brand spillover, their ability to support robust new-product-development pipelines in the face of changing investor preferences, and their ability to coinvest when needed. Yet, even for small firms, climbing the experience curve is growing more challenging and complex. The emergence of increasingly sophisticated data and analytics capabilities is raising the bar for all asset managers. As more asset managers invest in advanced analytics, machine learning, and big data, these capabilities are becoming mainstream, making it more difficult for all managers to generate alpha. Successful alpha shops will be forced to adopt these capabilities, An Asset Manager’s Guide to Data and Digital Disruption to realize the benefits.
Alternative and active specialty managers have already demonstrated their ability to attract flows and achieve growth rates well above the rest of the industry.
Beta Factories. Although passively managed assets represent less than 15% of industry assets, they are rapidly increasing their share, capturing the majority of net new flows into the industry. Passive products have become relevant to most investor segments and distribution channels. And asset managers are now using passive products for both tactical and strategic purposes.
While efficiency and liquidity provide sustainable advantage to the largest passive players, the growing revenue pool associated with passive exposure to new asset classes and with more innovative investment strategies—specifically smart beta—offers compelling revenue potential to attract small managers that are well positioned to drive innovation. The unique and evolving needs of individual investor segments will continue to encourage innovation efforts by passive managers.
The efficiency imperative in the beta factory model will drive efforts to digitize and automate operations, leveraging scale to justify these investments. The efficiency leaders will leverage their cost leadership to increase their flexibility on pricing and their ability to fund product innovation efforts to win in the market.
Solution Providers. Growing investor demand for outcome-oriented investment products will benefit asset managers that are skilled in multiasset class portfolio construction, as well as in manager selection and oversight in open markets such as the US.
Direct access to the end investor provides a unique advantage in bringing multiasset class solutions to the investor. In the retail mass-market and mass-affluent segments, in which more rudimentary multiasset class solutions are appropriate, providers with direct access to the end investor, as well as sufficient scale to support in-house asset allocation and packaging capabilities, will leverage their advantaged position with investors to bring multiasset class solutions to the market even if they do not have in-house or affiliated asset management capabilities. These providers will engage asset managers as parts providers.
However, asset managers are, and will continue to be, well positioned to bring multiasset class solutions to the following investor segments:
- Mass-market and mass-affluent investors being served by small providers, such as financial advisors, who lack sufficient scale to support in-house portfolio construction capabilities and look to asset managers to provide prepackaged multi asset solutions or asset allocation and portfolio construction tools
- High-net-worth investors who seek more sophisticated and open-source, outcome-oriented solutions
- The institutional segment, including defined-contribution-plan sponsors, pension plans, and endowments, that seek more diversified and customized multi-asset class solutions. (In this market, asset managers face the greatest competition from outsourced chief-investment-officer (oCIO) solutions and other more independent providers of investment solutions. Offering oCIO services of their own is an opportunity for managers to monetize investments in data, analytics, and risk management.)
Distribution Powerhouses. While regulatory efforts worldwide have pushed to strengthen the standard of advice offered to retail investors, distribution powerhouses will continue to retain some advantages over unaffiliated managers, allowing them to win in the mass-market, mass-affluent, and lower high-net-worth segments. Distribution powerhouses must continue to play a proactive and Asset Managers Get Real with Risk to ensure that their interests are represented on issues of investor protection and on other relevant regulatory topics.
Distribution powerhouses will go to market with a broad suite of “good enough” products and will differentiate themselves not on the basis of first-quartile performance but instead on their advantaged access to end investors and their favorable positioning with retail intermediaries in terms of branding, communication, digital distribution, and advisor practice support.
Investors of all kinds seek the guidance and endorsement of their advisors in selecting investment products. Institutional investors have high levels of investment acumen but still engage investment consultants. In the retail market, guidance and endorsement take multiple forms, typically linked to the distribution process. Examples include the affiliated branch distribution networks of a retail bank, the
variable-annuity sales force of an insurer, an employer’s selection and implicit endorsement of a defined-contribution record-keeping provider, and an independent advisor’s endorsement of a particular manager or product. In all cases, advantaged or affiliated distribution provides a source of advantage.
Sophisticated analytics and big data capabilities provide additional competitive advantage in distribution. To win, distribution powerhouses need to employ leading-edge analytics to redefine their sales and marketing strategies. Sophisticated marketing analytics, superior knowledge of existing and prospective investors and their advisors, and influencers will expand sales opportunities while focusing managers’ time and resources on the most promising opportunities and increasing the probability of winning new business.
Of course, successful managers may benefit from going to market with a model that draws on more than one enduring source of competitive advantage. But their success will ultimately be most closely tied to one primary source of advantage. We would expect successful managers—specialized alpha shops, beta factories, or distribution powerhouses—to employ some element of the solution provider model.
However, we do not expect the combination of a specialized alpha shop and a beta factory—unless they are run as largely independent businesses—to achieve success in the market.
Asset managers must evaluate where they fit into this framework and determine which model is best suited to supporting their success. Their capability-building efforts and investments should be aligned with their target model. For some, this may require a material change in mindset, culture, and approach.
For example, given the importance of specific scale and deep investment expertise to generating alpha, specialized alpha shops must focus their attention and efforts on managing money, risk, and clients. They should avoid distractions from noncore operational activities, such as those in the areas of finance, human resources, or technology infrastructure. A shared-service model with an outsourced partner would better position these managers to achieve sustained focus on most critical core activities.
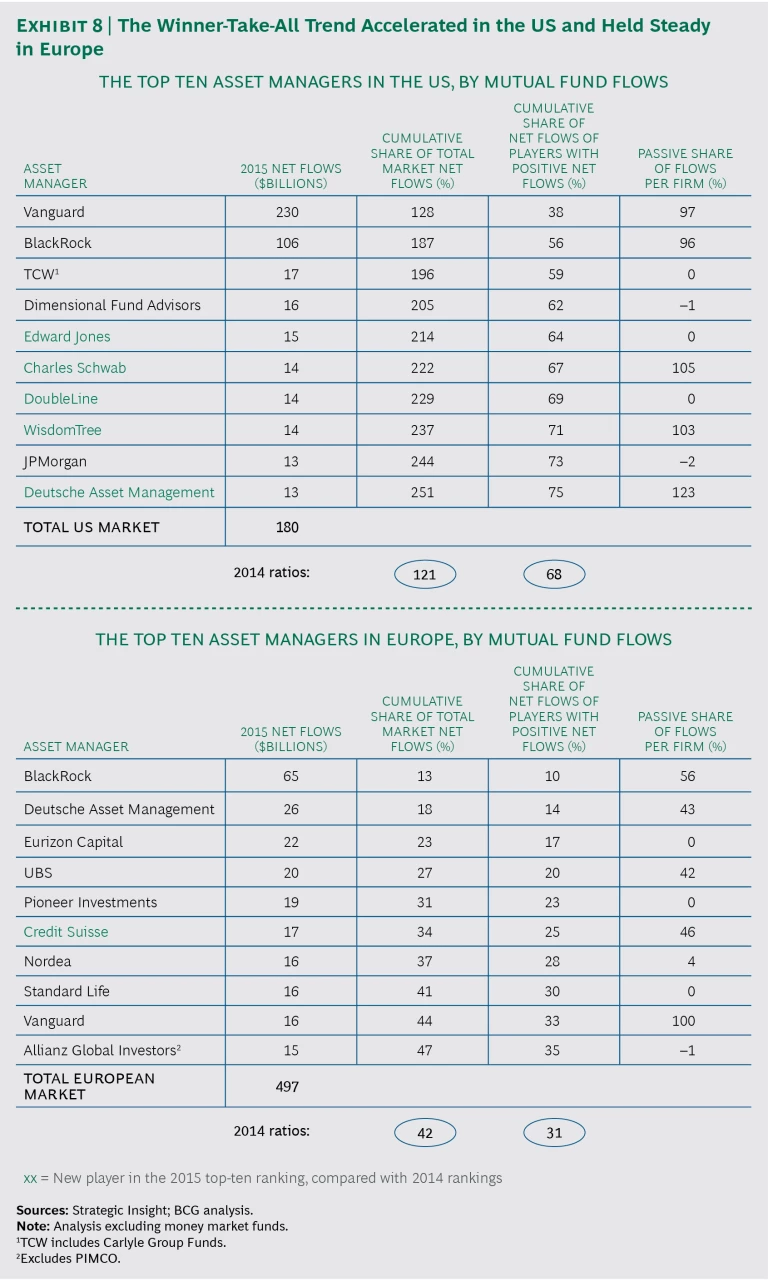
Historical net flows confirm that the industry is migrating toward these distinct business models. The beta factories are well established and are most successful in terms of net flows. In fact, they are capturing an increasingly disproportionate share of the total market flows, accelerating the winner-take-all trend in the US, where they represent five of the top ten players. (See Exhibit 8.)
Capabilities in solutions and advantaged distribution can further bolster the success of the beta factory model. The distribution powerhouses can boost their own success by leveraging their ability to deliver solutions to their target investors (those for whom they have advantaged distribution access) rather than focusing on alpha generation. While alpha specialists overall struggle to achieve top standing in net flows and in revenue and profit growth, the strongest performers among them regularly rank high.
The situation is similar in Europe. Competitive advantage for successful managers there is based on the use of affiliated distribution networks, a focus on passive products or solutions, a differentiated offering with alpha performance, or some combination of all these approaches. This dynamic explains the strong concentration of net flows captured by just a few players. In the US, the top ten fund managers won 250% of the market’s total net flows—taking into account outflows from other players. And the top ten accounted for 75% of the flows to players with positive flows, up significantly from 68% last year.
Concentration of flows increased in Europe as well. The top fund managers captured 47% of net flows and 35% of flows for players with positive flows—compared with 42% and 31%, respectively, last year. But net flows are less concentrated than in the US, owing to Europe’s more fragmented market and regional and local differences in distribution structures. Nevertheless, the accelerating product trends in Europe will continue to push the concentration of flows higher.
It is notable that the number of new asset managers in the top-ten ranking is significant in the US (five new managers among the top ten in 2015, four in the 2014 ranking). This demonstrates that success is not a question of legacy and existing scale. Instead, opportunities to succeed exist for asset managers regardless of their size or historic rankings. In some underserved markets, firms are gaining a disruptive advantage by building powerful distribution arms. This has been the case recently in China in particular.
