Unfavorable economic conditions, escalating capital requirements, and stubbornly high costs continue to depress the performance of many investment banks. Their collective 6% ROE in 2015 capped off five years of dismal revenue results.
Yet the same cannot be said for the capital markets industry as a whole—the ecosystem that includes buy-side firms, sell-side firms, information service providers, and exchanges. Indeed, even as regulation forces investment banks to retrench and hinders their ability to compete, other players remain unaffected and will even, in some cases, benefit. Over the next five years, revenues in the capital markets industry will grow by an estimated 12%, increasing to $661 billion from $593 billion in 2015.
GLOBAL CAPITAL MARKETS 2016
- The Value Migration
- How Value Is Shifting in the Capital Markets Ecosystem
- How Investment Banks Can Transform Their Business Models
The asset base of buy-side entities is expected to reach around $100 trillion by 2020, up from an estimated $74 trillion in assets under management (AuM) in 2014. If this transpires, the buy side will generate nearly $300 billion in fees by 2020, constituting 45% of the overall capital markets revenue pool (assuming favorable market conditions and current fee structures). However, investment banks, on the sell side, are expected to generate just over $205 billion by 2020, a decrease to 31% of the total revenue pool from 53% in 2006.
Information service providers and exchanges are poised to benefit. They will profit from increased demand for technology solutions and greater access to market information and analytics. Growth in electronic exchange trading and the use of central clearing will mean that their share of the capital markets revenue pool will grow to 19%, representing an estimated $125 billion, by 2020—an impressive rise from 8% in 2006.
Yet even as competition intensifies, opportunities for investment banks will continue to arise. Some larger or niche players will be able to absorb market share from those that are retrenching. Others will require a change in mindset and approach to explore alternative revenue opportunities beyond their traditional roles as capital raisers and market makers. Such players might consider leveraging internal data and technology systems to diversify revenues and enhance their market positions. They should build on their already mature sourcing strategies to push to the next level of operational and process efficiencies. Opportunities include leveraging utility models for nondifferentiating business processes and driving factory-like efficiency in the back office through end-to-end process redesign. These players should also leverage their remaining positions of strength across the value chain. In particular, it is imperative that they help their clients achieve success, not only by offering high-quality products but also by providing valuable information, such as research, benchmarks, market prices, and other intellectual property. Yet they should avoid giving away this information in the hope of generating revenues through alternative channels, such as trading. Indeed, the industry as a whole is moving away from implicit charging and so-called soft-dollar arrangements. Investment banks must keep pace and consider charging explicit fees for the services that they now provide in addition to the products they supply.
Moreover, the role of capital itself is changing. Escalating capital costs, occurring simultaneously with the growth of buy-side assets and revenues, indicate that the industry is moving toward leveraging benchmarks and other index products aimed at passive investors. Both the ability to discover liquidity and the demand for risk transformation services are becoming less dependent on capital. If investment banks are to compete, they must recognize their ability to generate revenues as information companies.
Ultimately, investment banks will need to be the right size, develop the right model, and take the right approach to return to consistent profitability. Dealers must learn to compete within the critical sectors of the new capital-markets ecosystem—data and financial technology. How they fit themselves into increasingly electronic, standardized, and transparent markets will be crucial. They are losing the battle so far, but that does not mean they will lose the war.
This report, BCG’s fifth annual study of the global investment banking business, emphasizes the challenges that investment banks face and examines the consequences of new and diverse players in the overall capital markets ecosystem invading their territory. Traditional revenue streams are migrating to these entities, and it is still unknown whether—or when—this trend will reverse. Either way, the investment banking industry has entered a highly dynamic, largely unpredictable era. It is time for players of all stripes to assess their current strengths and weaknesses and to plan for the future.
Key Market Developments
Revenues declined in 2015 for the global investment banking industry as trading in fixed income, currencies, and commodities (FICC) businesses continued to act as a drag on performance. Economic uncertainty, monetary policy change, and further implementation of bank regulations were the driving factors behind the negative change in market sentiment during the second half of the year.
Revenues
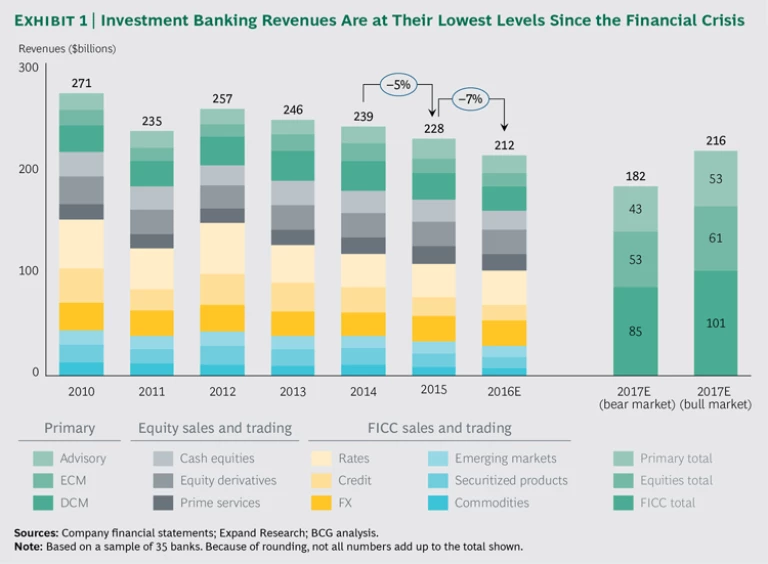
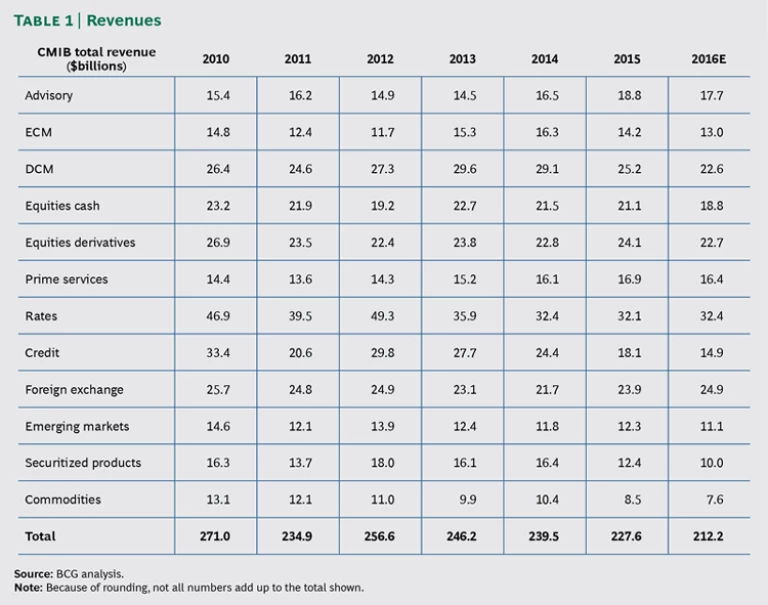
Global investment banking revenues declined to $228 billion in 2015, down 5% from $239 billion in 2014 and 16% from $271 billion in 2010. (See Exhibit 1.) Total revenue was lower last year than at any point since 2009, as the prospect of central-bank tightening in developed markets was swamped by a severe downturn in emerging markets. As we predicted in last year’s Capital Markets report, investment banking ROE fell to a 6% postcrisis low (excluding fines and litigation costs) as revenues were dragged down by relatively weak performance in secondary trading and by high business costs overall. (See Global Capital Markets 2015: Adapting to Digital Advances , BCG report, May 2015.)
Some specifics are as follows:
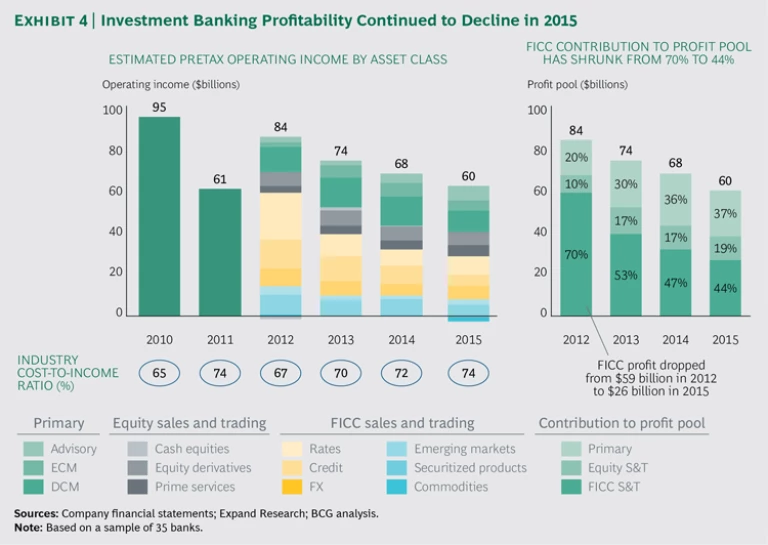
- FICC revenues fell by 8% year over year (YOY), from $117 billion to $107 billion, reflecting a further decline in credit, commodities, and structured products. FICC profitability has fallen from 70% ($59 billion) to 44% ($26 billion) of the total profit pool over the past three years. Continued pressure on dealers’ ability to warehouse assets drove down revenues in credit, commodities, and securitized products by between 20% and 25% YOY. Foreign exchange (FX) and rates have been bright spots, benefiting from volatility related to changes in central-bank policy. Event-driven volatility in FX—specifically with regard to the Swiss franc, the Russian ruble, and the Chinese renminbi—has also presented dealers with an opportunity to reprice larger transactions, widening spreads to regain ground on their loss-leading businesses in smaller-ticket, highly electronic, major currency pairs. The introduction of mandatory derivatives clearing under the European Market Infrastructure Regulation has been a precursor to wider market change in the region. As we have seen in the US, trading venues and alternative liquidity providers will likely emerge to challenge investment banks and reduce margins. Generally speaking, the regulatory burden has fallen hardest on FICC, dramatically slowing a traditional driver of revenues.
- Equities revenues, driven by stock market volatility, rose by 3%, to $62 billion. Cash trading volumes increased during the first half of 2015, while equity derivatives and prime services flourished in the second half as both hedging and speculative flows increased. A stock market devaluation in the third quarter forced banks to take major write-downs on inventory and proprietary positions, further testing the top line and demonstrating that banks are still vulnerable to swings in asset prices.
- Primary market revenues fell by 6%, to $58 billion, erasing gains made in 2014. The fall was precipitated by a 13% YOY decline in revenues for equity capital markets (ECM) and debt capital markets (DCM), both down from solid performances during the previous year. Revenue performance in M&A was strong, rising by 14% and building on gains made the previous year. The first quarter of 2015 was the strongest since 2009, with many banks reporting record profits from advisory services. Fees in the US rose by 28%, driven both by the deployment of record levels of private equity activity as well as by consolidation in the media and health care sectors. This strength was short-lived as revenues tailed off in the second half of the year. Overall, investment banks maintain strong control of the primary market, where they face lower competition from technology firms and the regulatory burden is less intense. The average primary market ROE for a sample of nine investment banks, for example, was roughly 20%, according to our estimates. Primary markets represented 37% of investment banking profits in 2015, compared with 20% in 2012.
Balance Sheets
Investment banks have struggled to rationalize their balance sheets in the face of increasing capital costs and leverage ratio requirements. In terms of capital consumption, a minimum leverage ratio of 3%, as well as an enhanced leverage ratio for global systemically important banks (G-SIBs), will increase the cost of doing business relative to the size of assets held. US banks continue to be relatively better positioned than their European peers, which struggle with legacy, illiquid, long-dated instruments on their balance sheets. In Europe, the publication of final margin rules for uncleared derivatives means that additional funding in the form of initial margin will increase by €200 billion to €420 billion, according to analysis by the European Banking Authority.
The introduction of revised rules for market risk (the fundamental review of the trading book, or FRTB) will present new challenges to risk-weighted asset (RWA) optimization programs. The FRTB imposes a new approach to calculating risk. Banks using the internal-models approach will have to apply additional fees, such as an expected-shortfall measure, a default risk charge, and charges related to nonmodeled risk factors. Banks using the standardized approach (SA) will face significantly higher capital charges in the form of a default-risk charge as well as a residual-risk add-on fee for exotic products. Depending on the composition and complexity of their portfolios, banks can expect a sizable increase in capital costs.
In addition, counterparty credit risk (CCR) and credit value adjustment (CVA) are two measures that require banks to set aside capital in order to mitigate counterparty credit risk exposure, especially for uncollateralized exposures. Furthermore, the introduction of minimum levels of capital requirements, or capital floors, on the basis of the SA will present additional hurdles. Capital floors will affect not only loan books but also trading books, pushing banks to calculate their RWAs according to a minimum equivalent to the SA. The proposal for credit risk, for example, is to mandate that banks calculate the capital set aside against RWAs at 60% to 90% of the total required under the SA.
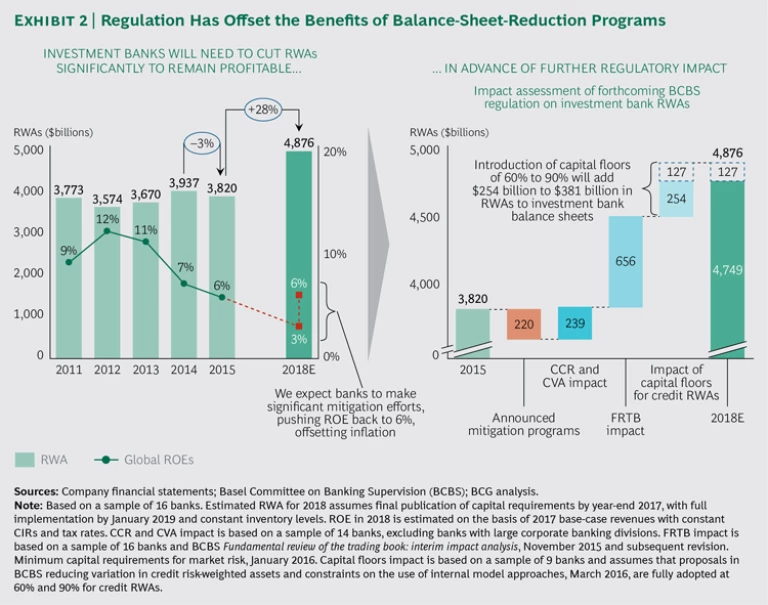
We estimate that the new regulations will lead to a 28% increase in investment banks’ RWAs. If we assume a base-case revenue projection of about $200 billion in 2017 (a decline of 13% from 2015), and no improvement in the current cost base, the increase in RWAs resulting from regulation could drive down ROE for investment banks from 5.7% to 3.4%. Given a cost of capital of 10% to 15%, an ROE of just 3.4% would mean that banks would fail to cover their cost of capital by a significant margin, necessitating further cuts to their balance sheets. Management will seek to deleverage, rather than increase the share of their balance sheet dedicated to capital markets. That said, mitigation efforts have generally struggled to keep pace with both the regulatory agenda, which has raised the bar significantly on risk management, as well as the rate of revenue deterioration. In 2015, banks managed only a 3% reduction in RWAs, to $3.8 trillion (net of FX adjustments).
We expect these regulations to incrementally increase the size of RWAs for the industry. Despite announced mitigation efforts of $220 billion in 2015, RWAs for a sample of 16 banks increased by between $1.1 trillion and $1.3 trillion, according to our estimates. This breaks down to $239 billion as a result of CCR and CVA, $656 billion resulting from the introduction of FRTB, and between $254 billion and $381 billion stemming from the proposed percentage range for capital floors applied to credit RWAs. (See Exhibit 2.)
Costs
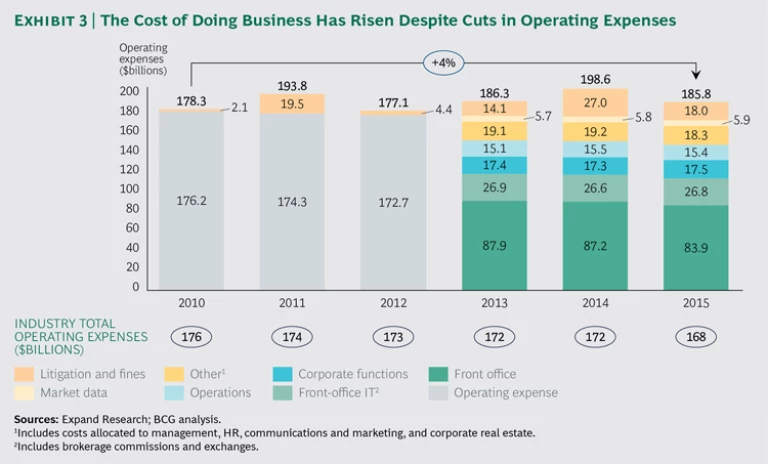
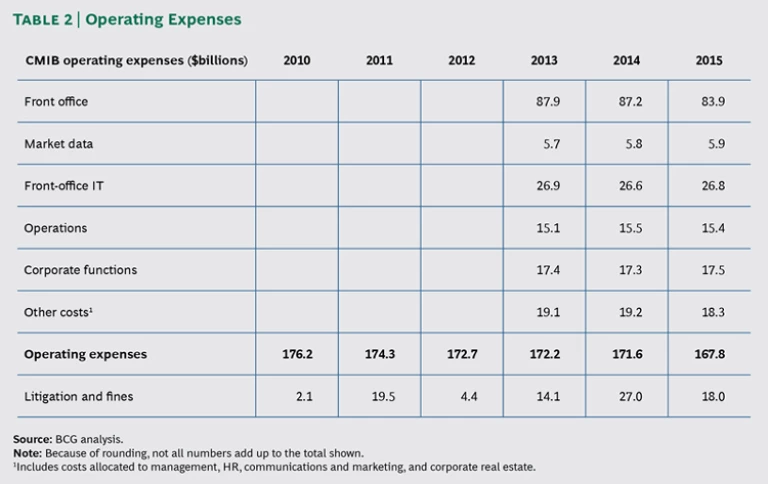
On the positive side, several major investment banks are finally benefiting from successful cost reduction programs. Business line transformations, strategic exits, and rationalization have begun to filter through to the bottom line. Operating expenses YOY fell by 2%, driven primarily by reductions in head count, operational spending, and lower litigation expenses. Yet since 2010, and despite cuts of roughly $8 billion in operating expenses, the overall cost of doing business for investment banks has risen by 4%. (See Exhibit 3.)
Of course, the cost of compliance and technology in the industry remains high. In 2015, cost-to-income ratios (CIRs) increased by two percentage points, to 74%, matching 2011 highs. Some cost benefits can be gained by moving to electronic and centralized trading. However, it still costs about five times more to process an interest rate swap than an FX option, even as swaps are being migrated to electronic platforms. Legacy architectures of banks remain complex, weighed down by a series of bolt-on solutions and spaghetti systems. FICC sales and trading IT budgets have nearly doubled since 2012. Moreover, adding to business-unit costs are group costs, such as those for risk and cybersecurity, which increased by approximately 10% during the same period. Group costs are allocated across the businesses, investment banking being no exception, weighing further on CIR.
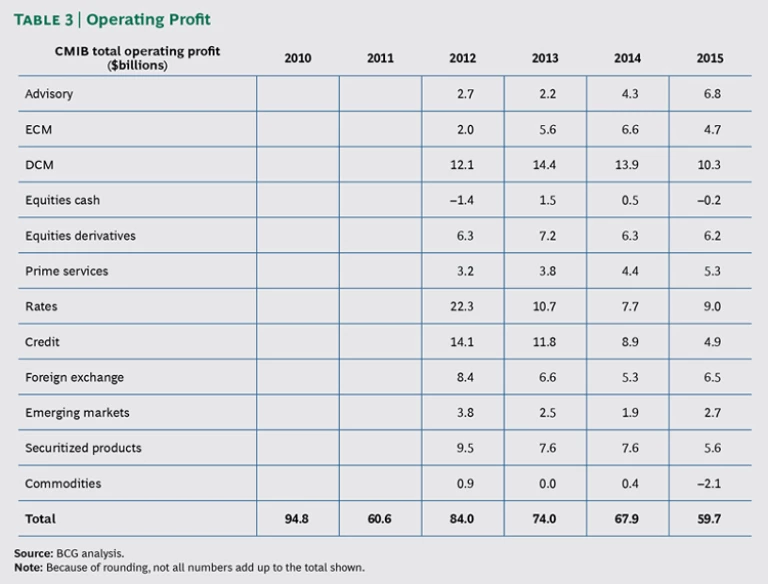
As a result, the overall profit pool for investment banking fell from $68 billion in 2014 to $60 billion in 2015. (See Exhibit 4.) The downturn was driven by a combination of declining revenues and escalating CIRs, with each percentage point rise in the CIR costing the industry, on average, about $3.7 billion in profit. Of course, CIRs vary dramatically by business line. At one end of the spectrum, the CIR for commodities—which posted a revenue loss in excess of $2 billion in 2015—ranges from 90% to 110%. Highly electronic markets, such as cash equities, also have a CIR that can exceed 100%. Indeed, despite the increase in cash equities revenues in 2015, the business line did not manage to break even. DCM and M&A were among the most lucrative business lines in 2015, posting profits of $10 billion and $7 billion, respectively. Primary markets have some of the lowest CIRs in the industry.
Overall, declining revenues and difficulties in achieving consistent reductions in costs have eroded banks’ ability to return value to shareholders. Regulatory headwinds have compounded this problem. The need for a comprehensive and surgical assessment of business lines and client coverage continues. The greatest opportunity for ROE improvement lies with the institutions that have a clear strategy for reducing their overall costs, optimizing their balance sheets, and deepening their client relationships.
Appendix
Below please find comprehensive tables for the capital markets and investment banking (CMIB) industry concerning revenues, operating expenses, and operating profit since 2010. Blank spaces indicate that data was not readily available.
