The economic turmoil in Brazil is a big story of a country in crisis. The national economy contracted by almost 4% in 2015, and estimates for 2016 are not much better. Consumption—once an engine of growth—declined by 1.5% last year and shows no clear signs of improvement.
Headline numbers such as these make it easy to write off Brazil—a member of the once-heralded BRICS nations (Brazil, Russia, India, China, and South Africa)—as one more boom-to-bust tale. But like many other generalized judgments, such an assessment is both simplistic and misleading. Brazil is a nation of more than 200 million people and is the fifth-largest country by land mass in the world. Its continental dimensions, geographic variety, and economic and sociodemographic diversity define heterogeneity. Although it is one country, it comprises many local, regional, and sector-specific economies, each with its own defining characteristics, drivers, and trends.
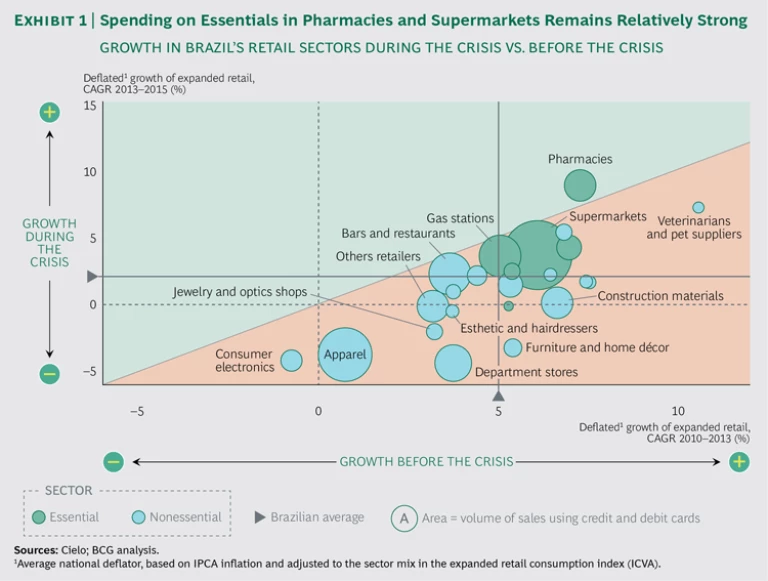
The economic crisis that brought Brazil’s accelerated growth trajectory to a sudden halt is a clear reminder that volatility is as common in emerging markets as growth is. Playing successfully in a country such as Brazil requires not only the ability to grow a business fast but also a deep understanding of the many realities that define a dynamic and heterogeneous market, and the ability to adapt to these conditions. For example, retail spending in 2015 grew faster (by 1.8 percentage points) in interior cities than in major metropolitan areas; and in many cities (mostly in agricultural areas), spending growth remains strong. Despite overall decimation in the retail sector, pharmacy retail sales are growing at almost 9% per year, supermarkets at more than 3.5%, and bars and restaurants at more than 2%. (See Exhibit 1.)
Recently, BCG and Cielo, Brazil’s largest credit- and debit-card payments processing company, undertook a major study of trends in Brazilian consumption based on a database of between 5 billion and 6 billion transactions per year from 2011 through 2015, involving 160 million credit and debit cards. We also analyzed dozens of economic and sociodemographic variables related to consumption in more than
The crisis has hit hard, but its impact varies; Brazil is diverse. Smart companies—whether Brazilian or multinational—can employ a sophisticated approach based on real spending data from real people and places. These companies can adjust their strategies so that they make the most of the islands of opportunity that exist in the current downturn while positioning themselves to take maximum advantage of the eventual recovery.
Beneath the Headline Trends
Consumption has been a big force behind Brazil’s economic growth, and it is a major factor in its decline. Consumption has been more volatile than GDP in the recent past, dropping by 6.3% between the second half of 2014 and the second half of last year. BCG’s survey of consumer sentiment in 2015 found that respondents planned to reduce spending in every single product category. That said, national consumption patterns and those of individual states differ significantly. For example, the state of Tocantins has generally fared better than the country as a whole, and the state of São Paulo has generally fared somewhat worse. Both have suffered since the crisis hit, but even though the growth rate in Tocantins fell further than São Paulo’s, it remains healthier thanks to its strong numbers prior to the crisis.
As we noted in 2015, Brazil’s interior cities are bucking broader trends as consumption demand moves inland. (See Capturing Retail Growth in Brazil’s Rising Interior , BCG Focus, April 2015.) We said then that as consumption in leading retail locations slowed and consumer demand shifted to the interior, retailers would need to determine how to profitably reach those markets. Indeed, interior cities showed higher nominal growth in retail sales in 2015 than either the national or regional capitals, and smaller cities (those with populations ranging from fewer than 50,000 to 1 million) grew faster—often significantly—than major metropolitan centers.
There are also big differences in how well various retail segments have held up. Stores selling essential items, such as food and household, health, and hygiene products, have performed better than those in other segments—and in some instances have even shown growth. Sales at pharmacies, for example, especially at large chains, have shown growth levels higher than their precrisis levels. The number of pharmacy stores increased by more than 4% from 2014 to 2015, and the average number of transactions per store rose by almost 8%.
Supermarkets have been another relatively successful sector during the crisis, growing at a slightly faster rate than overall retail has. Alternative store formats (such as atacarejos and smaller stores) are showing generally good results, and bars and restaurants continue to do brisk business. The ubiquitous trend toward e-commerce continues to thrive across all categories, particularly as interior consumers embrace the expanded selection and choice that they find online and as price-conscious consumers hunt for better deals.
Not surprisingly, spending is holding up better among high-income consumers than among low-income individuals, and low-income consumers are using debit cards more—perhaps owing to credit constraints or as a way to manage household budgets. Companies—especially those that owe a large portion of their recent growth to the emergent middle class—need a good fix on who and where their customers are and how they have been affected by the downturn.
Six City Clusters
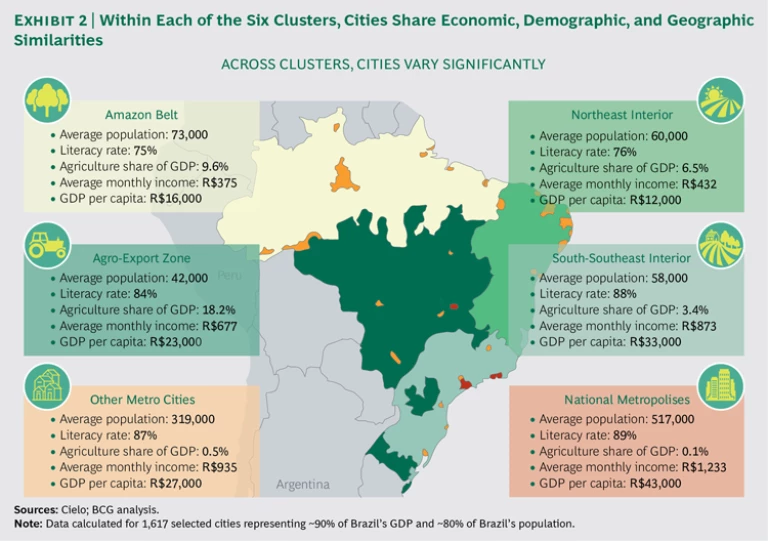
Beyond the national numbers, our analysis reveals six clusters of cities that have similar economic, demographic, and geographic characteristics. Each cluster has manifested its own consumption patterns, both before and in response to the crisis. Each also has its own underlying reasons for growth and its own resilience. In descending order of percentage of national retail sales, the six clusters are national metropolises, other metro cities, the south-southeast interior, the agro-export zone, the northeast interior, and the Amazon belt. (See Exhibit 2.)
The three largest clusters currently account for 92% of all retail sales. But size isn’t everything. The principal factors that determine a cluster’s consumption behavior and performance are its economic profile, its levels of wealth and education, the share of export agriculture in its overall economic activity, and the extent of social welfare it provides. The agro-export zone and the northeast interior have registered the highest growth rates since the advent of the crisis; and national metropolises and the Amazon belt, the lowest.
National Metropolises (39% of National Retail Sales). Because of their size, wealth, diversity, educated population, and influence on the national economy, these metropolitan areas (São Paulo, Rio de Janeiro, Brasilia, and their surroundings) are the most stable in Brazil. They have avoided the wide economic swings and the divergent growth patterns of some other regions, and they have shown the most stability in the face of crisis, with consumption growth only moderately affected.
The economies of the national metropolises are largely service based. Unlike spending by high-income consumers in other clusters—such as those in the south-southeast interior and in the agro-export zone, whose spending has continued to increase—spending by big city high-income households was essentially flat in 2015. Comparing the results for 2010 to 2013 with those for 2013 to 2015, the cluster’s growth rate dropped by 1.8 percentage points (compared with a 3.4 percentage point national decline) to 0.5%. All major retail segments are growing more slowly in this cluster, but essential segments have struggled the least. Spending at supermarkets has declined by a couple of points, spending at bars and restaurants is flat, and pharmacy growth has accelerated moderately.
Other Metro Cities (30%). This cluster consists of state capitals, their surrounding areas, and a few other large cities. It has experienced stronger-than-average growth thanks in part to a “demographic dividend”—a temporary increase in the size of the working population relative to the total population. The level of economic diversification within this cluster is relatively high, although it is still lower than that of the national urban centers.
Taken together, the cities in this cluster are a microcosm of the national circumstance; one can find the good (pockets of strong growth), the bad (widespread areas of significant decline), and the average. The downturn hit these cities much as it did the country as a whole. Their growth rate dropped by 3.2 percentage points from the three-year period of 2010 to 2013 to the three-year period of 2013 to 2015, but the cluster still showed positive growth (1.3%) in 2015. Smaller cities with lower income levels surrounding the state capitals have tended to perform better than larger cities, where growth has stagnated. For example, retail sales growth in Camaçari in the state of Bahia and Paulista in Pernambuco in 2013 to 2015 was as strong as or stronger than it was in 2010 to 2013. The economic behavior of each metropolitan region has varied considerably, however, and the surrounding regions have not necessarily tracked the performance of the main city.
Segment-by-segment consumption patterns in this cluster differ significantly from those in other clusters. While pharmacies have performed very well since the crisis hit, supermarket growth has slowed. Apparel retailers and furniture and home décor stores have performed better than average, and bars and restaurants worse.
South-Southeast Interior (22%). Despite being very hard hit by the downturn (a 4.4-percentage-point drop in consumption growth from the years 2010 to 2013 to the years 2013 to 2015), this cluster should nonetheless remain a priority for most businesses. It combines size, wealth, and continued growth (2.7%), owing to booming agricultural exports, including sugar, coffee, and oranges, and relatively high literacy levels. It has the second highest per capita GDP in the country and includes several major pockets of wealth, such as Ribeirão Preto in the state of São Paulo. The south-southeast interior has a relatively high share of industrial activity, too, which has contributed to the painful impact of the downturn in this region.
Consumption patterns in this cluster are strikingly uneven. The cities of Brazil’s south-southeast interior that achieved the strongest growth are smaller and have relatively diversified economies as well as greater exposure to agribusiness. There are almost 150 such cities in the cluster, many of whose economies are growing at 5% to 10% (or more) per year. On the other hand, cities in which industry typically makes up a third or more of the economy have seen stagnation or contraction; and most of them are in recession.
This cluster also contains some of Brazil’s most popular tourist destinations, including Angra dos Reis, Rio de Janeiro; Ilhabela, São Paulo; and Camboriú, Santa Catarina. Consumer sales in all of these localities are growing faster than before the crisis. Most retail segments have continued to grow more quickly in this cluster than in the nation as a whole, including nonessential segments such as hotels (almost 4%) and veterinarians and pet supplies (almost 9%).
Agro-Export Zone (5%). This remains Brazil’s fastest-growing cluster. Agriculture was a major bright spot before the crisis, providing growth and a major source of exports; and it has continued to outperform other sectors of the economy as the crisis has put the brakes on them. Agriculture represents more than 18% of this cluster’s GDP, compared with 4.5% nationwide.
The agro-export zone had Brazil’s highest growth rate in the period just before the crisis, and even though that rate dropped by 6.9 percentage points from the years 2010 to 2013 to the years 2013 to 2015 (the second largest drop of any cluster), the cluster still managed strong overall growth of 4.2% during the latter period.
Economic performance within the agro-export zone has varied. Cities with stronger exports, superior infrastructure, and more-balanced income distribution have fared better than others. Cluster-wide, however, almost all retail segments—including department stores, apparel stores, and consumer electronics—are continuing to grow. This is the only cluster where such across-the-board growth prevails. Pharmacies, supermarkets, and other retail segments that sell essential goods have maintained growth levels similar to those they were experiencing before the crisis.
Northeast Interior (3%). In this cluster, the second-fastest-growing one in Brazil, the overall impact of the crisis has been the second lowest in the country. The downturn’s impact has been softened by several factors, including a reasonably diversified economy and the support of social welfare programs in poorer cities. Coastal cities that are popular tourist destinations have suffered less, while areas that depend on local family agriculture have struggled more. Several cities, such as Petrolina, in the state of Pernambuco, and Vitória da Conquista, in Bahia, have benefited from significant levels of infrastructure investment prior to the crisis, which helped improve productivity and competiveness.
Pharmacies, travel agencies, and leisure-oriented businesses have experienced accelerated growth during the crisis. Most retail segments grew at rates exceeding the national average, with department stores and pharmacies in particular outperforming the average and with tourist-related industries such as hotel and rental cars also showing strength. The overall growth rate for the cluster dropped by 2.8 percentage points to 3.3% from the years 2010 to 2013 to the years 2013 to 2015.
Amazon Belt (1%). This is Brazil’s smallest cluster in terms of population and GDP, and it is home to the poorest and least educated population. The regional economy depends largely on extraction industries and is therefore quite vulnerable to downturns in the volatile markets for minerals and oil and gas. Not surprisingly, it has been the hardest hit by the crisis. The growth rate plunged by almost 12 percentage points to -0.6% from the years 2010 to 2013 to the years 2013 to 2015. A few small cities have suffered less severely because of healthy local agribusiness and relatively strong welfare programs, but the cluster as a whole lacks a diversified economic base capable of sustaining growth. All retail segments in this cluster have struggled.
A Heterogeneous Picture Emerges
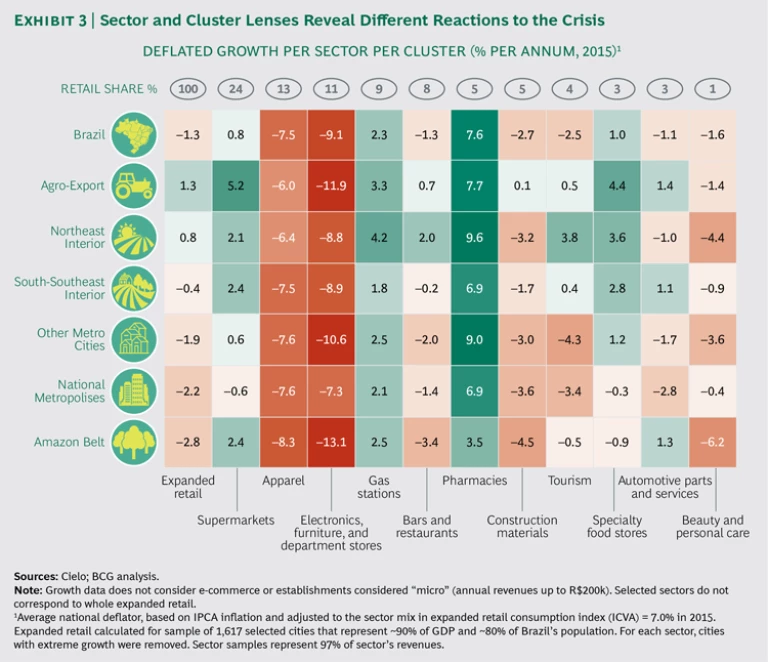
A comparison of growth rates by cluster and retail segment highlights Brazil’s highly heterogeneous retail spending landscape. (See Exhibit 3.) The impact of the crisis is evident, but it is far from evenly—or similarly—distributed. Most segments in the agro-export zone have continued to grow, but the national metropolises show few segments with positive growth, and the Amazon belt evidences broad and deep decline.
Consumers have concentrated their spending on essentials—a trend reflected in sales at pharmacies and supermarkets compared with sales at electronics and furniture retailers and department stores. Specialty food shops have generally held up well, while apparel retailers have suffered. Spending on tourism highlights the ways consumers are adapting. Tourism revenues have retreated in large urban areas but have increased in smaller cities within regions with popular vacation destinations. Evidently, Brazilians are still traveling for leisure—but instead of going abroad, they are staying closer to home.
One pocket of high performance nationwide is e-commerce sales, which have continued to provide a growth engine for most segments. As we wrote in 2015, the internet is a pervasive force in Brazil, influencing more than half of all retail purchases. (See “ Shopping in Brazil: The Influence and Potential of Digital ,” BCG article, December 2015.) Even as consumption stumbles, the influence of digital technologies on consumer shopping behavior is rising, driven by wider connectivity, advances in technology, and new services. Digital’s impact on consumer commerce is especially evident among relatively affluent consumers and among consumers in the nation’s interior. (See “Brazil’s Digital Retail Revolution Rolls On.”)
BRAZIL’S DIGITAL RETAIL REVOLUTION ROLLS ON
Crisis? What crisis?
Online consumption in Brazil continues to increase—and to outperform brick-and-mortar sales—during the recession. Even categories that rank among the hardest hit in offline sales, such as consumer electronics and department stores, show continuing growth online.
One reason for this phenomenon is that relatively affluent consumers, on whom the crisis has had less impact, account for a disproportionate number of online purchases. In 2015, the growth in e-commerce in high-income households was 1.6 times greater than the national average and more than 5 times greater than in middle- to low-income households.
Another reason for the resilience of online sales is that more Brazilians—including millions of people in small cities deep in Brazil’s interior, who account for more than half of the country’s population—are doing more online. These consumers value the broader product offerings and tailored value propositions they find online, and these factors are likely to become increasingly important. Beyond strict e-commerce figures, the internet influences more than half of all retail purchases in Brazil. Online activities play a role in almost three-quarters of all product discovery activities and in nearly two-thirds of all research activities. Almost every connected Brazilian consumer—amounting to some 106 million people, or more than half of the nation’s population—uses the internet at some point for some purchases.
Marketers and retailers are looking at big changes in how and where people buy, shifts that will evolve over the next several years as Brazil pulls out of recession. So far, the internet’s impact is most extensive and powerful in the prepurchase and postpurchase stages of the customer purchasing journey, but the fact that e-commerce numbers are rising in the face of severe economic headwinds indicates that the internet is playing an increasingly important role in the purchase phase as well.
Consumers use digital tools in different ways, depending on the product category. For products that people buy repeatedly, such as health and beauty aids, price is less critical in the purchase decision; brand engagement is high, and so is the need to replenish frequently. Consumers often try such products in a store (in order to see the color of lipstick or nail polish, for example), and then go to online merchants for repeat purchases. According to our data, the share of health and beauty aids sold online is still small (4.1% in 2015), but online growth from 2013 to 2015 was almost 30%, compared with 9.7% in stores.
Especially in the current recession, e-commerce presents a rare avenue of opportunity for marketers and retailers that master the intricacies of this channel.
The picture today is far different than it was just a few years ago, but it is hardly one of unremitting gloom. Consumers are taking stock and resetting their priorities depending on who they are, where they are, and what the economic outlook in their region or city cluster seems to be. They are making rational financial decisions that reflect their circumstances, and they are spending accordingly, a model that smart companies should follow.
The Next Level of Segmentation
Thus far the analysis shows many parts of Brazil in a different light and points companies toward areas and retail channels where consumption patterns remain attractive, if not robust. But it pays to dig a level deeper. Cielo’s detailed geographic data, combined with big-data analytics, enables companies to explore previously impractical tactical actions based on highly precise segmentations that reach down to street level. As we observed in 2015 with respect to large and diverse developing markets—in that case, markets in India—targeting street-by-street market segments can be a very successful strategy. (See “ Street-Level Segmentation in India: Winning Big by Targeting Small ,” BCG article, December 2015.)
Street-level segmentation has at least four advantages over more-traditional approaches:
- Companies can identify high-potential markets wherever they exist, rather than treating each city as a single large, homogeneous market and (as a result) wasting human and financial resources.
- Street-level data facilitates more precise identification of target groups. It can help companies determine where potential customers live, shop, and work, which can aid in creating more-accurate retail and distribution strategies.
- Companies can distinguish highly competitive areas from locales where competition is less intense. The segmentation approach also helps companies identify “white spaces”—areas with high potential and low competitive intensity.
- Companies can use this approach to scrutinize the changing city landscape and identify promising areas where they can establish a foothold ahead of competitors. Street-level segmentation can also have a tangible impact on business development costs, particularly those involving real estate.
The credit- and debit-card data that BCG and Cielo analyzed opens up mapping opportunities at successively more precise levels in Brazil. Companies can assess retail economic activity at the cluster level (such as major metropolises), at the city level (São Paulo, for example), in zones within cities (São Paulo north, south, east, west, and central), in neighborhoods within zones (Pinheiros), and on streets within neighborhoods (Rua dos Pinheiros). (See “Zooming In to Street Level.”) They can see, for example, that while all zones of São Paulo entered recession in 2015, the center was hardest hit; they can also see that the north and west (which were the fastest-growing zones prior to the crisis) eked out small increases during the period from 2013 to 2015.
ZOOMING IN TO STREET LEVEL
A few blocks can make a big difference.
In São Paulo, retail activity in each of the city’s zones has varied significantly from the citywide average during the crisis. And within each zone, performance has differed widely by neighborhood. For example, in the high-income west zone, the street-level economies of five neighborhoods within a few square kilometers of one another grew (or contracted) at markedly different rates from 2013 to 2015, ranging from -2.9% to 3.3%, a spread of more than 6 percentage points. (See the exhibit.)
A street-level analysis can go even deeper, zooming in on a single street and revealing significant variations in retail activity. The economy in the west zone neighborhood of Pinheiros, for example, contracted by 1.6% from 2013 to 2015. Retail activity on Rua dos Pinheiros (Pinheiros Street), however, shrank by only 0.3% over the same period, thanks to a revitalization program centered on a new subway station. Moreover, as the Pinheiros neighborhood economy worsened in 2015, shrinking by about 4%, the retail economy of Rua dos Pinheiros actually grew by a robust (under the circumstances) 3%.
In times of trouble, it can pay more than ever to take a closer look.
But more interesting—and potentially much more valuable to marketers who might otherwise focus their resources on the high-per-capita-GDP west zone—pharmacy sales showed their highest rates of growth in the hard-hit center (about 13%) and in the south (10%), not in the west (less than 8%). Also of interest: supermarket sales in the center and north grew at about the same rate as in the west.
Much of this data is readily available and accessible in close to real time. There is no need for companies to wait to see how different regions are faring or how point of sale is doing in one very small area compared with another, for example. Companies can now react to shifts in consumption patterns as they occur, using real data.
Putting It All Together
As growth slows and competition intensifies, companies need to rethink their strategies and their priorities. Brazil presents a textbook case. While the assessment of growth potential remains important, company strategy must also focus on profitability and return on investment. Increasingly, companies are asking questions such as these: What is the investment risk in each of our markets? Which customer segments can we serve competitively? Do we have subregions in which slowing growth and declining profitability should lead us to question the viability of the business? Companies must review these questions through the lens of heterogeneous performance among segments and city clusters, if not individual neighborhoods.
Despite the crisis, advances in technology and data availability permit companies doing business in Brazil to direct their resources and activities toward high-potential clusters and retail segments. The ability to analyze markets at much finer levels of detail and far more cost effectively than ever before permits more-constructive allocation of resources, which in turn can substantially improve productivity and performance. To make the most of the opportunities hiding in plain sight throughout Brazil, companies should do five things.
Relearn how to use market data in a heterogeneous recessionary environment. Companies need to take a market-by-market view in making commercial and marketing decisions. They need to rethink product mix and portfolio strategies, pricing strategies, efficiency and efficacy in marketing and sales, and ways to improve operations. Different clusters, cities, neighborhoods, and streets today require approaches tailored to their particular circumstances and characteristics. Companies can plan for macro regional clusters, but they should also be prepared to target small when it comes to execution. They need to rethink their commercial approach to the marketplace, including such factors as pricing, partnerships, and service-level agreements.
Enforce discipline in resource allocation. Capital is a precious commodity, especially during a recession. Companies need to be rigorous in their investment decision making, especially with regard to footprint—where and how to invest (or divest). They also need to review, and in some cases overhaul, their distribution systems and networks according to a tight analysis of costs and sales potential.
Capture market share. For larger and stronger companies, downturns tend to be propitious times to accelerate market consolidation by absorbing smaller players. Brazil has plenty of weakened competitors these days, including both independent players and local chains that are struggling with slow sales and the inability to invest.
Embrace e-commerce. Companies looking for growth should focus on and invest in the primary retail growth engine today. They need to define a digital strategy, business model, and offering; use digital channels to connect with consumers; balance and connect e-commerce and brick-and-mortar channels; and factor digital channels into decisions about product portfolios, marketing, and operational improvements.
Review portfolio investment strategies (from an investor’s point of view). Companies should also use the downturn to assess opportunities to rebalance their business portfolios, analyzing the risk and return factors for each line of business and determining where (and how) to “milk the cow” and where (and how) it makes sense to invest in anticipation of the eventual recovery.
Brazil will recover. The most likely economic scenario indicates continued recession through 2016 and economic recovery beginning in 2017. But there’s no guarantee of when the recovery will occur or how rapid it will be. Different regions, city clusters, and retail segments are likely to recover at their own rates. Companies that take a heterogeneous view and engage in the kind of analysis we have described will benefit not only from being better prepared to deal with the downturn (especially if it lasts longer than expected) but also from being better positioned for the recovery.
Acknowledgments
The authors are grateful to Henrique Carvalho, Fernando Thiers, and Fabiana Reganati of BCG and Igor Yasuo Gushiken and Marcelo Idel Vasserman of Cielo for their assistance in preparing this report.
