Financial analysts typically use cost of goods sold as a percentage of sales (COGS%) to compare the operating performance of biopharma companies —but such comparisons are inherently misleading. The high variability of production costs across business units (those for small-molecule drugs versus those for biologics, for example) and differences in pricing models make it nearly impossible to get an apples-to-apples comparison using COGS%. What’s more, that metric masks other important drivers of cost performance.
A new benchmarking approach, drawn from our work with ten leading biopharma companies, makes it possible to avoid distortions from business unit mix and pricing and test an array of potential underlying factors of cost performance. It turns out that scale is the most important, but not necessarily in the ways you would expect. Not all kinds of scale have the same degree of impact on the business—and this has important implications for corporate and manufacturing strategies.
The Hidden Value of Scale
To correct for the distortions that occur when companies are compared simply on COGS%, we gathered data by business unit on both costs and pricing per pack from the ten companies in the analysis. (See the sidebar.) For small-molecule drugs, the production cost per pack ranged from $2.50 to $7.50. Given such a large variation, we investigated the factors that might explain these cost differences.
CORRECTING FOR DISTORTIONS
Among the ten biopharma companies we analyzed, COGS% ranged from 19% to 38%. This broad metric does not yield meaningful comparisons between companies, however, because of internal variation in two areas:
- Production Costs. The average production cost per pack varied markedly among business units: those that produced small molecules had a production cost of approximately $5 per pack, whereas for units devoted to biologics the per-pack cost was approximately $60. Consequently, companies with a high percentage of biologics sales had a higher average cost per pack, masking the cost performance of other business units.
- Pricing. COGS% for an individual business unit depends on both the cost of goods sold and the price charged. Consumer health business units, for example, may have a relatively high COGS% of 35% to 45%, but this is because they charge lower prices than pharma business units.
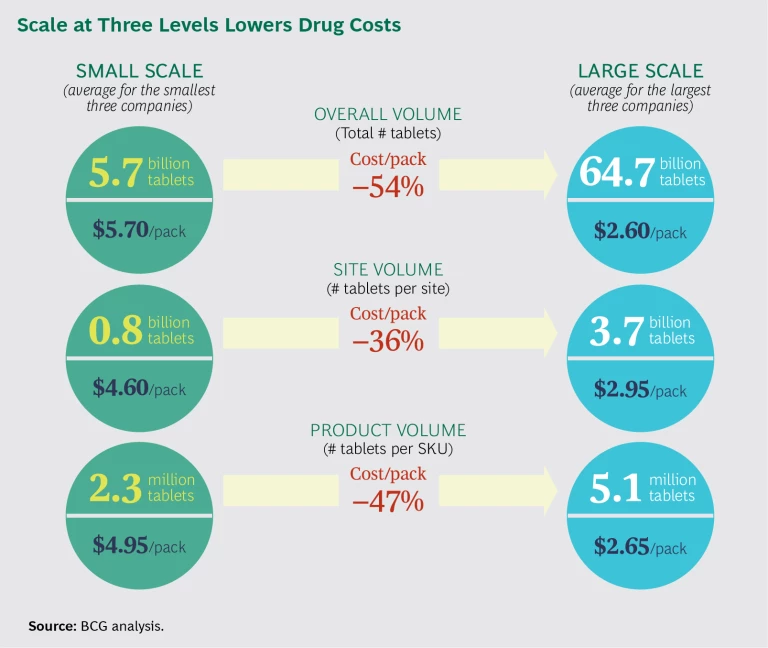
We corrected for these two effects by comparing cost per pack at a business unit level. (See the exhibit.) To ensure apples-to-apples comparisons between companies, we excluded pharma development costs and assumed the consistent treatment of royalties.
It quickly became obvious that the key factor in driving down production costs was scale. To dig deeper, we analyzed three types of scale: overall volume (the number of tablets produced within each business unit), site volume (the number of tablets produced at a given site), and product volume (the number of tablets per SKU). Simulations showed that a doubling of each type of scale does not affect production costs equally:
- Overall Volume. Company size was a significant factor in cost performance, with a 15% reduction in unit cost for every doubling of total production.
- Site Volume. Companies with larger sites (as measured by production volume) also had better cost performance, with a 17% reduction in unit cost for every doubling of site size.
- Product Volume. For each doubling of product volume, unit costs fell by 29%.
Of the three types of scale, product volume (producing a large amount of a limited number of SKUs) delivers the greatest reduction in manufacturing costs. (To see the actual effects of scale on cost performance in the companies in our analysis, see the exhibit. While it may appear that overall volume lowers costs the most, by 54%, it’s important to note that these savings require a more than tenfold increase in scale. Product volume, on the other hand, offers 47% savings at just double the scale.) This finding is consequential in part because product scale is the easiest to achieve. Doubling the size of the company or the size of a factory may improve cost performance, but both approaches require significant structural changes, whereas product scale requires only a focused review and realignment of the product portfolio. Companies that can eliminate unnecessary customization of products, standardize sizes and packaging, and streamline their portfolio of SKUs have a significant opportunity to improve efficiency and lower production costs. It is, of course, essential to work closely with the commercial team on these changes, but this is an area where companies can achieve quick wins.
For example, a company may have six factories that appear to be very busy, but many hours are consumed transitioning from one product to the next. If the company streamlines its SKUs, thereby eliminating costly changeovers, it allows for longer production runs and frees up capacity. This, in turn, increases the efficiency of operating equipment and potentially creates opportunities to consolidate sites. Improving product scale can therefore also help with network simplification, which in turn increases scale at individual sites.
The Limited Benefits of Offshoring and Outsourcing
We analyzed other factors—including the number of full-time employees per site, the percentage of sites in low-cost countries, and the percentage of outsourcing—to see if they lowered production cost per pack. To our surprise, we found almost no correlation. While individual business decisions in these areas, such as the decision to offshore or to outsource production, may improve cost efficiency, we found no evidence that these factors lower production cost per pack at the business unit level. For example, companies with 30% of their small-molecule production in low-cost countries had no cost advantage over competitors with 15% of production in low-cost countries. This may be because many of the factories in the low-cost countries were small-scale sites. It’s also possible that companies suffered from lower labor productivity in certain low-cost countries, which would explain the lack of correlation between cost per pack and number of full-time employees on site.
Implications for Biopharma
Scale is important in the biopharmaceutical industry. Four actions can help companies capitalize on it.
- Continue to pursue mergers and acquisitions. Given the cost advantage that comes with overall volume scale, biopharma companies will continue to benefit from M&A and targeted asset swaps. Savings from these transactions can be significant. After the merger of Pfizer and Wyeth, Pfizer reported saving more than $1 billion per year in manufacturing costs. Similarly, the GSK-Novartis transaction—which included a GSK oncology and Novartis vaccines swap as well as a joint consumer health venture—is another example of how companies can use M&A creatively to increase business unit scale.
- Consolidate networks. To achieve scale at the site level, companies must consolidate sites and create larger sites to offset lower capacity utilization. Novartis and Pfizer have divested or closed a total of more than 50 sites since 2010; we expect this trend to continue across the industry. It’s worth noting that the digital industrial technologies known as Industry 4.0 will gradually increase automation and improve asset utilization, thereby diminishing the importance of scale. But for now, the most successful companies will need to pursue the benefits of both scale and Industry 4.0.
- Reduce product complexity. The blockbuster model will continue to deliver major advantages, given the scale effect at the product level. But many benefits can also be achieved at the product level by reducing complexity, as we have seen with fast-moving consumer goods companies in recent years. It’s not enough simply to eliminate low-volume products (the “long tail”); such moves rarely address the root cause of complexity’s high costs. Companies need to combine insights about the market and supply chain to make the right tradeoffs between the value of diversity and the cost of complexity.
- Reevaluate offshoring and outsourcing. Given the limited benefits associated with offshoring and outsourcing, both approaches should be examined on a case-by-case basis. It is critical to understand the interplay among scale, complexity, labor costs, productivity, and logistics costs. For many companies, it may be advantageous to consolidate production at hubs in higher-cost countries.
Scale is a strong driver of production cost per pack—at the overall volume, site, and product level. As pricing pressures intensify, this important lever can allow companies to make a step change in performance. The biopharma companies that streamline their sites, technologies, and products can gain a meaningful advantage over competitors—and unlock additional benefits that will allow the business to thrive even in turbulent times.


