You’re sitting in the boardroom, about to make a big decision. Sales are booming, the stock market is on a tear, borrowing is cheap, and the latest internal capacity forecast suggests that all of your manufacturing plants will be operating at full capacity within two years. Isn’t now the perfect time to invest in a new plant or assembly line to meet surging demand?
It might be. Yet historically, management teams that have authorized large capital projects in this environment, particularly when acting late in an economic expansion, have often done themselves and their shareholders a disservice.
The purpose of capital investments is to fuel growth, and management teams’ carefully crafted business plans invariably anticipate heady returns on the invested capital. However, our analysis of 175 industrial goods companies over a ten-year period shows otherwise: overall, greater capital expenditures do not lead to better returns. Furthermore, most companies invest at inconsistent levels, and many mistime the market.
The best capex strategy turns out to be a consistent and conservative investment approach that enables best-in-class value creators to maintain stable capex budgets over time. Equally important, the best-in-class companies follow three crucial practices before undertaking a major investment: they pursue less cash-intensive alternatives first, they avoid unnecessary market exposure, and they minimize timing risk.
The best capex strategy turns out to be a consistent and conservative investment approach that enables best-in-class value creators to maintain stable capex budgets over time.
Overspending and Underdelivering
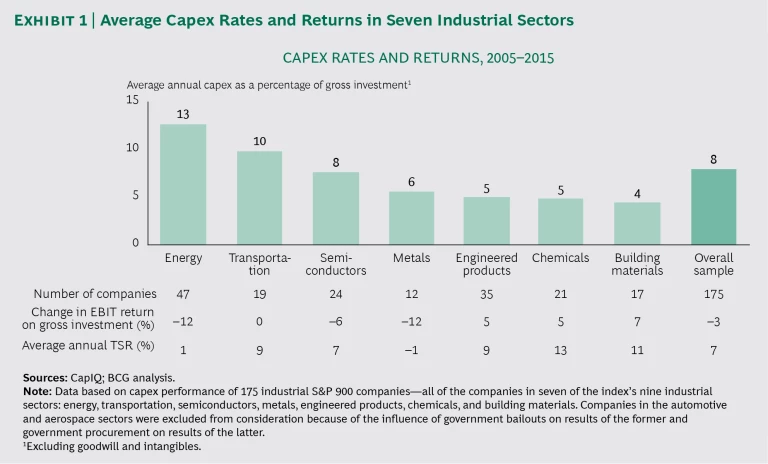
We analyzed the capex performance of 175 industrial goods companies in the S&P 900 from 2005 through 2015, a period comprising a full business cycle that included the worst recession in decades. Our study group consisted of every S&P 900 company that fell into any of seven sectors: energy, transportation, semiconductors, metals, engineered products, chemicals, and building materials. (We excluded two industrial goods sectors: automotive, because of the effect of government bailouts on its results, and aerospace, because of the impact of government procurement on its fortunes.) These companies reflected a range of investment rates and results. (See Exhibit 1.) It’s fair to assume that they expected a payoff on their investments in less than ten years. So if they were effective stewards of their capital, the companies that spent more on capex than their peers did should have generated better cash and shareholder returns.
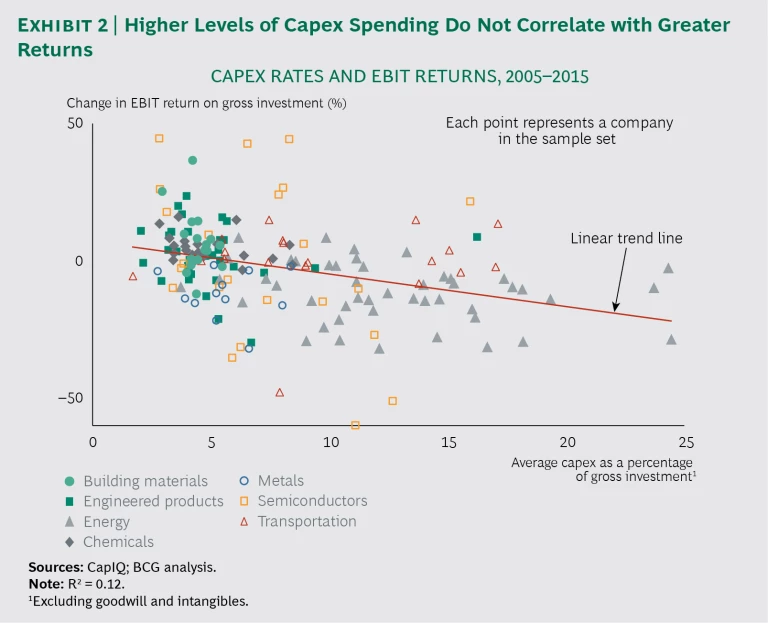
Yet we found no evidence of a consistent correlation between level of capex and level of returns. In comparing investment levels (measured in the form of capex as a percentage of gross investment) with changes in return on invested capital (expressed as the percentage improvement in EBIT return on gross investment over time), we found that companies that invested relatively heavily gained no advantage from having done so. This was generally true of every sector in almost every year we studied. Similarly, we saw a lack of correlation between investment level and total shareholder return. (See Exhibit 2.)
These findings suggest that, on the whole, companies in the seven sectors we examined failed to improve their returns through capex. The findings also reveal an optimism bias in the capex planning process: especially during up cycles, management teams’ projections tend to be overly optimistic.
Next, we classified the companies according to the investment approach they adopted throughout the ten-year cycle. Companies either maintained a relatively steady level of investment or spiked their investment during one of the three cycle phases: the runup to the peak (2005 through 2007), the trough (2008 through 2010), and the initial recovery (2011 through 2013). Because of the lag effect of investments, we did not analyze investment levels beyond 2013, as we would not expect to see any impact from these investments in our data. In five of the seven sectors we studied, at least one company followed each type of strategy.
Of the 175 companies in our sample, only 38 (22%) followed a consistent investment approach throughout the study period. The other 137 companies (78%) spiked their investments during one or more of the three periods, and 67 of them (38%) did so at the worst possible time—from 2005 through 2007, during the runup to the crash. Overall, the best strategy appears to have been to invest consistently over time: companies that adhered to this approach enjoyed a 13% higher average increase in ROGI and a 5% greater annual TSR than the others did.
This comparison, however, does not control for differences in overall sector performance, which can be substantial. Of the four sectors in which more than one company followed a consistent investment approach, three outperformed the average for all sectors by between 3% and 13%, and the fourth sector underperformed the average by a modest –2%.
Of course, there are many possible reasons for this disparity in performance. Indeed, a significant body of literature focuses on the problems common to executing large capital investments. These pitfalls include overly optimistic initial plans that underestimate project time or costs, insufficiently rigorous program management that leads to delays and cost overruns, a protracted construction timeline that creates a mismatch between the completed project and the company’s evolving needs, and investments that rely on unproven technology and thus fail to deliver expected results.
Execution complexities notwithstanding, our experience and the data indicate that a company’s investment approach has an impact on its chances of achieving and sustaining strong returns.
A Study in Contrasts
Consider the experience of two real companies: one that took a high and spikey approach to capex during the study period, and one that adopted a conservative and consistent approach. (We have disguised the company names and details.)
High and Spikey Capex. In early 2005, a manufacturer of engineered products announced plans to build a $200 million plant in order to boost the production capacity of its biggest business unit (BU-1) by 30%. Nine months later, the company announced three additional plant investments amounting to $150 million in two of its other business units, with the goal of increasing the units’ total production capacity by 20%. All of the new capacity was to be online by spring 2008. The company’s EBIT in 2005 was around $400 million, so these four investments represented major capital investments and cash commitments.
In fiscal 2007, BU-1 had record operating earnings of $290 million. Shortly thereafter, and just before the recession hit, the company completed work on the new plant. Then the recession struck hard: by 2009, the business unit’s operating earnings had fallen to just $20 million. In 2010, the company had to reduce capacity by idling one of BU-1’s plants. BU-1 earnings remained depressed for several more years; by 2016, they had rebounded somewhat, to around $180 million, but the plant that the company had idled in 2010 remains closed. Midway through the recession, the company aborted its expansion of the other two units.
Conservative and Consistent Capex. A leading manufacturer of paints and coatings followed a different approach. What’s instructive in this case is what the management team didn’t do: it didn’t spend heavily during the boom years. Capital expenditures from 2005 through 2007 averaged just $70 million per year, or about 5% of the company’s annual enterprise gross investment (GI). (In contrast, the engineered products company spent some $125 million a year on average, or 9% of its enterprise GI.)
In the company’s 2006 annual report, executives celebrated a three-year CAGR in sales of about 10%, but they tempered the good news by noting their concern about slowing economic growth. They vowed to continue focusing on reducing costs, improving productivity, and delivering value to customers. When the downturn hit, the company managed to maintain relatively solid performance. Although sales fell by almost 20% from 2008 to 2009, the company actually increased its net income through cost management and productivity improvements. From 2008 through 2010, the company gained market share and held its capex levels fairly steady at about $60 million (or 4% of GI). In contrast, the engineered products company curtailed its spending drastically, to just $20 million per year (about 2% of GI).
From an investor’s perspective, the two companies’ results differed dramatically. From 2005 through 2015, the conservative and consistent paint manufacturer returned an annual average TSR of 15%. During the same period, the high and spikey engineered products company returned an annual TSR of just 5%—some 180 basis points below that of the S&P 500. A $100 investment in the paint company in 2005 was worth $407 in 2015; that same investment in the engineered products company was worth only $170 in 2015.
The two companies sell different products and serve different customers. But both faced the same macroeconomic forces: an exuberant credit and housing market, followed by a major crash and a slow recovery. The paint company’s management approach during the boom years and its avoidance of large capital investments positioned it for success throughout the cycle.
Three Core Practices for Better Capex Decisions
By no means are we suggesting that companies should resist making needed capital investments. Nor are we saying that a company’s success depends on its ability to accurately forecast the business cycle (a near-impossible feat). In industrial goods sectors, large capital investments come with the territory. And as we have said in previous publications, using capex to support long-term growth is a central component of successful corporate strategy. (See “ The Art of Capital Allocation ,” BCG article, March 2017.) But clearly, many companies are not handling such investments effectively.
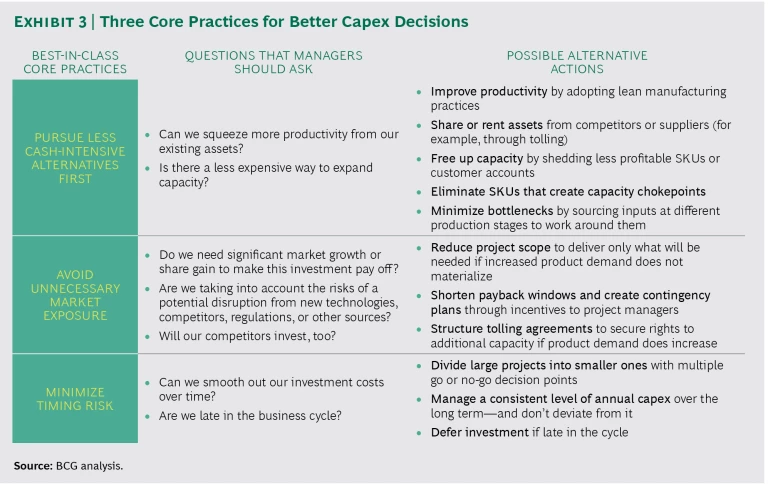
Best-in-class management teams take a consistent and conservative approach to their capex, spreading out the investments over time. In addition, when considering capex decisions, they abide by three core practices. (See Exhibit 3 for a summary of these practices, along with key questions to ask and possible alternative actions to take.)
Pursue less cash-intensive alternatives first. Many leaders start out convinced that capacity is lacking and that a big investment is necessary to increase it. But our empirical analysis and our client work suggest that best-in-class management teams avoid investing more than is required to support market demand during the cycle. So the first question leaders should ask is: Can we squeeze more productivity from our existing assets? Often, small investments in lean manufacturing practices can free up enough capacity to compensate for the anticipated shortfall.
Our empirical analysis and our client work suggest that best-in-class management teams avoid investing more than is required to support market demand during the cycle.
Similarly, concerns about capacity constraints should prompt management to take a closer look at product mix and pricing. By eliminating the lowest-performing SKUs—particularly SKUs that create choke points in capacity—companies may be able to unlock enough capacity to meet demand near the peak of the cycle, or they may be able to pursue new launches that will fuel future growth. Another option is to reevaluate customer profitability, renegotiating or terminating unprofitable contracts.
If these steps do not resolve the problem, managers should ask: Is there a less expensive way to expand capacity? The increase could come from assets that the company shares or rents but doesn’t own. Tolling, for example, can help one company overcome an undercapacity problem while enabling another to solve its overcapacity problem. Or the company could follow an alternative production strategy, such as sourcing inputs at different stages of production to relieve the pressure at bottlenecks.
Avoid unnecessary market exposure. Sometimes capacity constraints demand a capex solution. Or the capital investment under consideration involves adopting a new technology or launching a new product line. If so, managers should ask: Do we need significant market growth or share gain to make this investment pay off? All too often, companies base their investment plans on overly optimistic market forecasts. Sometimes company planners extend an unrealistic CAGR too far into the future without giving adequate consideration to underlying secular drivers (such as population growth or GDP). In still other cases, leaders count on the new product to help the company significantly increase its market share. But have these plans taken competitors’ behavior into account? What about the potential for disruption from new technologies, competitors, regulations, or other sources? By asking and thoughtfully answering these questions, best-practice companies avoid making larger investments than market demand justifies.
If their initial plans fail to address these questions satisfactorily, project teams should go back to the drawing board to develop scenarios (both optimistic and pessimistic) that will help the management team better understand the plan’s risks and rewards. Additional support for the scenarios can come from driver trees that make assumptions explicit and trace estimates back to foundational sources of data. In many cases, this more rigorous approach leads to a rational reduction in project scope. In others, it may lead to deferral of the investment, particularly if the plan emerges late in a long growth cycle.
Finally, managers must ask: Will our competitors invest, too? Although it’s impossible to answer this question with precision, you can put yourself in your competitors’ shoes and come to a reasonable approximation of what they might do. If your competitors are likely to make large capital investments in product lines similar to yours, it’s a good idea to move cautiously. Frequently, strong market growth drives an entire industry to invest in parallel, leading to overcapacity. A wise alternative to this approach is to sit out the capex cycle and focus instead on improving customer relationships and current portfolio mix. If demand does materialize, tolling agreements offer a cost-effective way to add capacity. If it doesn’t, the downside will be far less severe.
If your competitors are likely to make large capital investments in product lines similar to yours, it's a good idea to move cautiously.
Minimize timing risk. Another risk to mitigate is timing. In this respect, corporate investing is not all that different from personal investing. The best-performing companies invest consistently over time without trying to time the market. For this reason, managers should ask: Can we smooth out our investment costs over time? Doing so entails setting a long-term goal for the company’s rate of capex and then prioritizing projects to meet (but not exceed) that level of spending each year. It also makes sense to break large projects into smaller chunks, with multiple go/no-go decision points along the way, and to structure the decision approval process around anticipated payback time frames (ideally, the shortest possible periods). All plans should include contingencies that address downside risks. Finally, as noted above, the argument for deferring investment becomes stronger in the late stages of a long business cycle.
Of the many strategic choices that management teams must make, capital investment decisions are among the most important. Historically, most industrial goods companies have struggled to generate substantive returns from capex. But the best performers weather business cycles and emerge ahead of the competition by following a consistent and conservative approach and by adhering to three crucial practices. As the current growth cycle stretches toward its eighth year, now is the right time for directors and management to carefully evaluate their approach to capital expenditures—and to consider the powerful practices that enable best-in-class businesses to consistently come out ahead.


