CONVERGING TO A ONE-SPEED WORLD
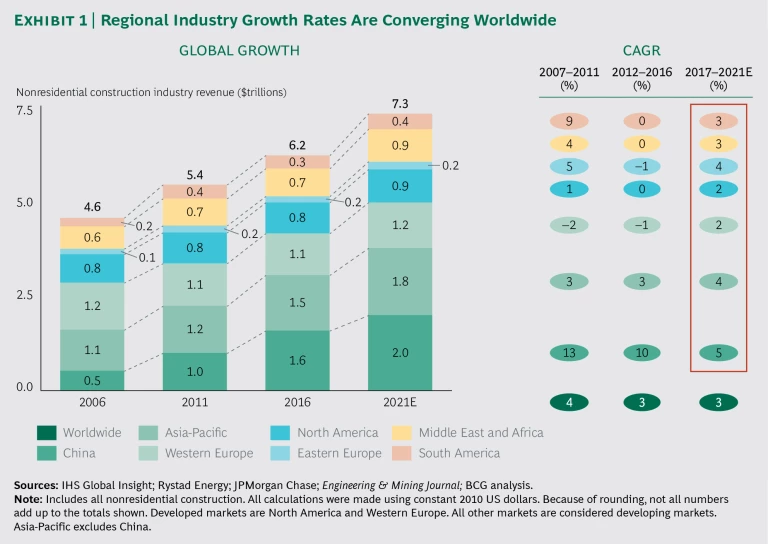
The regional growth rates of the engineering, construction, and services (ECS) industry are converging, with profound consequences for shareholder value. In the aggregate, the industry’s growth in developed markets will accelerate from 2017 through 2021, while its growth in developing markets will continue to decelerate. Specifically, we expect to see the industry return to growth in North America and Western Europe after flat or negative growth in the previous five-year period, while growth in China is forecast to slow significantly. This analysis is based on an assessment of the nonresidential construction industry, which serves as a proxy for the ESC industry. (See Exhibit 1)
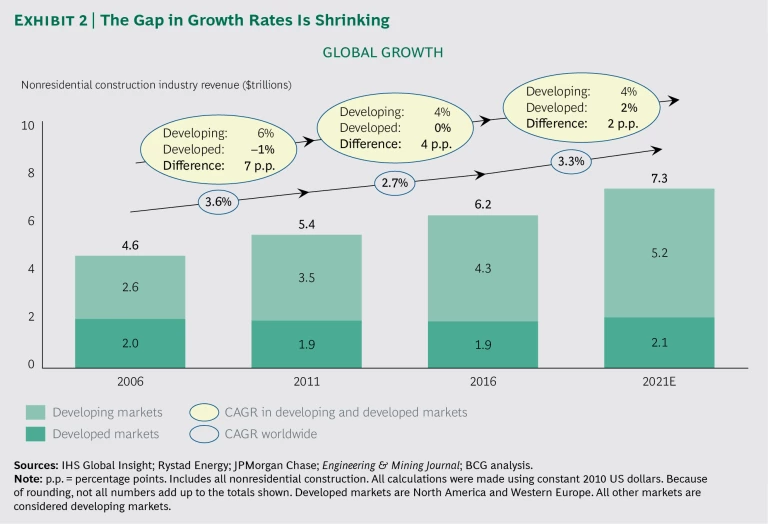
The difference in the compound annual growth rate (CAGR) of nonresidential construction revenue in developing and developed economies was 7 percentage points from 2007 through 2011 and 4 percentage points from 2012 through 2016. (See Exhibit 2.) We forecast that the gap will shrink to just 2 percentage points from 2017 through 2021, with both markets growing in the narrow range of approximately 2% to 4%.
As a result, developed markets’ share of global growth in ECS is expected to rise to 15% from 2017 through 2021, up from only 1% for the previous five-year period. The net effect of the convergence is an acceleration of CAGR of global nonresidential construction revenue. We expect CAGR to reach 3.3% from 2017 through 2021, up from 2.7% for the period from 2012 through 2016.
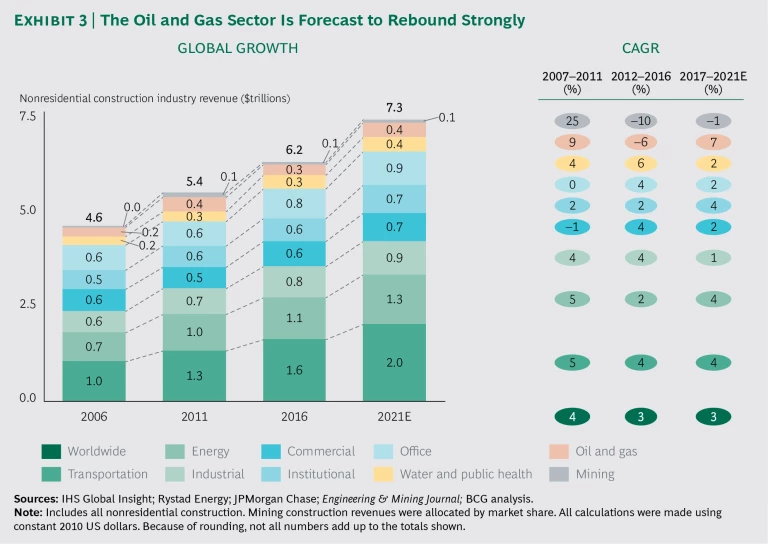
One important source of the tailwinds that are promoting the industry’s growth in developed markets is a rebound in construction spending in the oil and gas industry. (See Exhibit 3.) Construction spending fell sharply following the collapse of oil prices in mid-2014. Even though oil prices remain low, oil and gas companies need to increase their construction spending in order to maintain current levels of production. The industry’s construction spending is weighted toward developed economies—35% in North America and Western Europe, compared with 28% globally. As a result, developed markets will disproportionately benefit from the rebound in spending.
Another major source of the tailwinds is the renewed focus on investments in institutional and transportation infrastructure, which we discuss below in the context of growth forecasts for Western Europe and the US.
Western Europe Rebounds
Western Europe has been a significant challenge for incumbent ECS companies; it’s been difficult to find ways to grow in a market that has been shrinking over the past decade. We forecast a return to positive growth of 2% from 2017 through 2021. European ECS companies will welcome even this modest improvement, because many experienced low revenue growth and declining profitability from 2012 through 2016.
The growth of the ECS industry in the UK and the Eurozone is being stimulated by government plans to increase funding for infrastructure investments.
- UK. The UK’s most recent effort, the National Infrastructure Delivery Plan 2016–2021, calls for investing £297 billion. This represents a significant increase over the £200 billion proposed in the five-year plan announced in 2010.
- Eurozone. The first version of the European Commission’s Investment Plan for Europe (also known as the Juncker Plan) was announced in 2014. It recommended an incremental investment in infrastructure of €315 billion of public and private funds from 2015 through 2017. The second version, announced in late 2016, added €200 billion to the investment target and extended the investment period through 2020.
These plans rely heavily on private funding to overcome the constraints on public-sector financing. Because there is a significant risk that private financing will not materialize, the total amount spent may fall short of the proposed investment levels. However, the reliance on private funding creates an opportunity for ECS companies to win projects and grow market share if they can come to the table with comprehensive solutions that include financing.
US Companies Get a “Trump Bump”
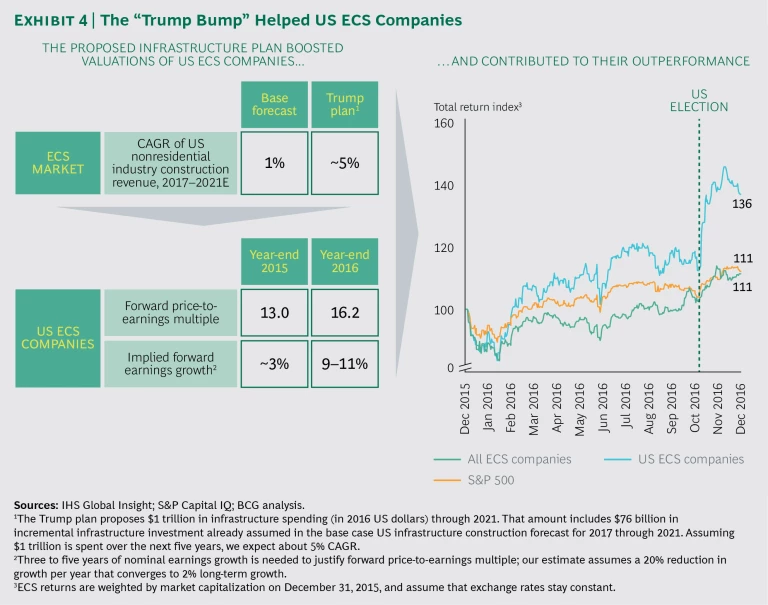
Valuations of US ECS companies soared after the 2016 presidential election, fueled by expectations that spending on infrastructure would increase dramatically under the Trump administration. By year-end, the forward price-to-earnings multiple for US ECS companies was 16.2, up from 13.0 at the end of 2015. (See Exhibit 4.)
Investors expected earnings to grow by 9% to 11% over three to five years beginning in 2017, compared with only 3% at the end of 2015.
In other words, at the end of 2015, investors expected the US ECS market to grow at the same rate as GDP, but at the end of 2016, they expected the market’s growth to outpace GDP. Moreover, forecast earnings growth for public US ECS companies in our sample exceeds the forecast maximum CAGR for the US ECS market of 5% in the event the administration’s infrastructure plan is enacted.
The “Trump bump” reflects the strong demand for infrastructure investment. In recent decades, funding for infrastructure construction has declined. For example, the US government has not raised the federal gasoline tax—long the primary source of funding for highway infrastructure—since 1993, when it adopted the current rate of $0.18 per gallon. The number of gallons of gasoline consumed annually in recent years has been fairly flat, leading to correspondingly flat nominal funding. Over the same period, input costs for infrastructure projects have increased, outpacing inflation.
The consequences of the shortfall in infrastructure investment are evident throughout the US. For example, the American Society for Civil Engineers (ASCE) has designated 9% of the nation’s 614,000 bridges as structurally compromised and in need of immediate repair to stay in service. The ASCE estimates that without remediation, underperforming infrastructure will cost the US economy $3.9 trillion by 2025.
Statistics such as these have motivated legislators and others to find ways to increase infrastructure investment. At the federal level, Congress and President Obama agreed to a five-year, $305 billion highway-funding plan in December 2015. State and local transportation-funding initiatives totaling $220 billion were approved in 2016, most of which were direct ballot measures. Even in this context of positive momentum, President Trump’s proposal to invest an additional $1 trillion had a seismic effect on growth expectations.
In May 2017, the administration included a fact sheet on the infrastructure plan in its 2018 budget proposal. The administration recommended achieving the targeted $1 trillion in infrastructure investment using a two-pronged approach: allocating $200 billion in new federal funding spread over ten years and providing incentives for states, cities, and the private sector to invest. The administration also proposed enhancing the environmental review and permitting processes in order to accelerate projects.
More details aren’t expected until the third quarter of 2017, however. Amid the uncertainty over the administration’s plan, US ECS companies experienced shareholder returns of –5% in the first half of 2017, while the S&P 500 generated a return of 9%.
Regardless of how infrastructure investment is funded, the prioritization of projects for investment will determine the extent to which the program achieves the administration’s ambitious goals for job creation. (See A Jobs-Centric Approach to Infrastructure Investment , a BCG and CG/LA Infrastructure report, April 2017.)
Chinese Growth Slows but Remains Strong
China is the world’s largest nonresidential construction market, with a 19% share of the 2016 global market. For the past five years, China has accounted for 77% of global ECS growth. Although the outlook for the industry’s growth in the US and Western Europe has turned positive, the growth rate in China is expected to fall to 5% from 2017 through 2021. This is half the industry’s growth rate of 10% from 2012 through 2016, but it is still more than twice its expected growth rate in developed markets.
In terms of total revenue, seven of the top ten global ECS contractors are Chinese companies.
In the coming years, we expect other Asian nations to overtake China and become the fastest-growing ECS markets. In India, ECS spending is expected to accelerate to 8% from 2017 through 2021, compared with 3% in the previous five-year period. In Indonesia, the ECS market is expected to grow by 6% from 2017 through 2021, the same rate as the previous five-year period. Companies based in East Asia should be well positioned to capture this local market growth. Indeed, two Indonesia-based companies in our Value Creators sample, Pembangunan Jaya and Wijaya Karya, were top-quartile TSR performers. From 2012 through 2016, these companies’ revenue growth (21% and 15%, respectively) greatly exceeded their home market’s GDP growth.
A REBOUND FOR SHAREHOLDER RETURNS
The convergence of industry growth rates has promoted a rebound in shareholder returns. After disappointing results from our previous analyses of five-year TSR performance, the ECS industry showed signs of bouncing back in this year’s study, which covers 2012 through 2016. TSR performance improved across the board, led by companies based in China and Japan and companies focusing on infrastructure construction. (See the sidebar “About the Study.”)
ABOUT THE STUDY
This study is part of BCG’s annual Value Creators series, which provides rankings of the world’s top value creators on the basis of average annual TSR over a five-year period. The series also distills managerial lessons from value creators’ success and highlights trends in the global economy and capital markets. (See “How Top Value Creators Outpace the Market—for Decades,” BCG article, July 2017.)
We use TSR to quantify and compare companies’ value creation performance. TSR, an objective measure of the value a company creates for investors, allows for the disaggregation of results into multiple factors. Readers of BCG’s Value Creators series are likely familiar with our methodology for quantifying the relative contribution of the sources of TSR. The methodology uses a combination of revenue (that is, sales) growth and margin change as an indicator of improvement in fundamental value. It then uses the change in the company’s valuation multiple to determine the impact of investors’ expectations on TSR. The improvement in fundamental value and change in the valuation multiple determine the change in a company’s market capitalization and the capital gain or loss to investors. Finally, the model tracks the distribution of free cash flow to investors and debt holders in the form of dividends, share repurchases, and repayments of debt in order to determine the contribution of free-cash-flow payouts to TSR.
The most common TSR metric we use in this report is five-year average annual TSR, which reflects year-over-year TSR smoothed out over five years. We calculated average annual TSR on the basis of a company’s reporting currency rather than on the basis of US dollars. The objective was to avoid any reduction in TSR that would result from the relative strengthening of the US dollar against a representative sample of global currencies in the observation period. When calculations such as weighted average TSR were made for comparative purposes, we used a constant exchange rate set at the beginning of the observation period. In some cases, the change to reporting currency resulted in higher absolute TSR figures, largely because of the US dollar’s recent strength; however, the change did not materially affect the ranking of ECS companies, the industry, or its segments.
The ECS Sample Shows a Positive Trajectory
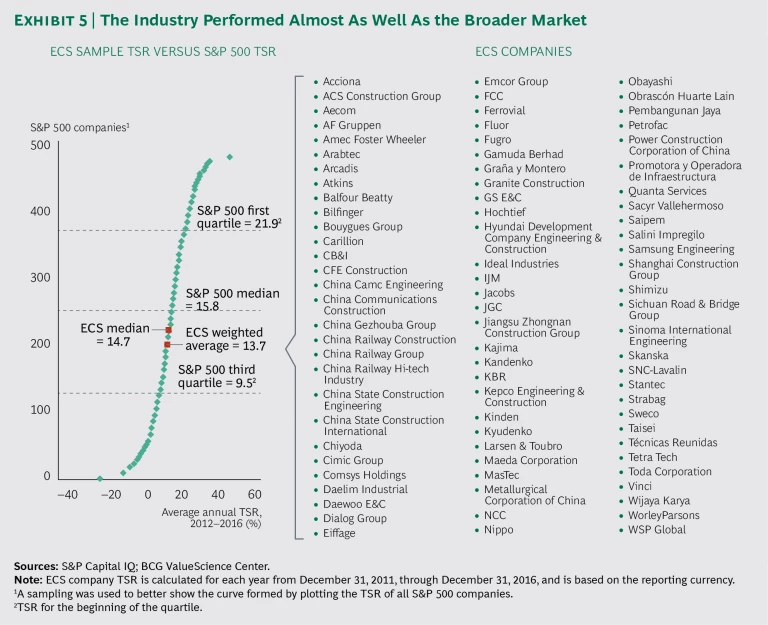
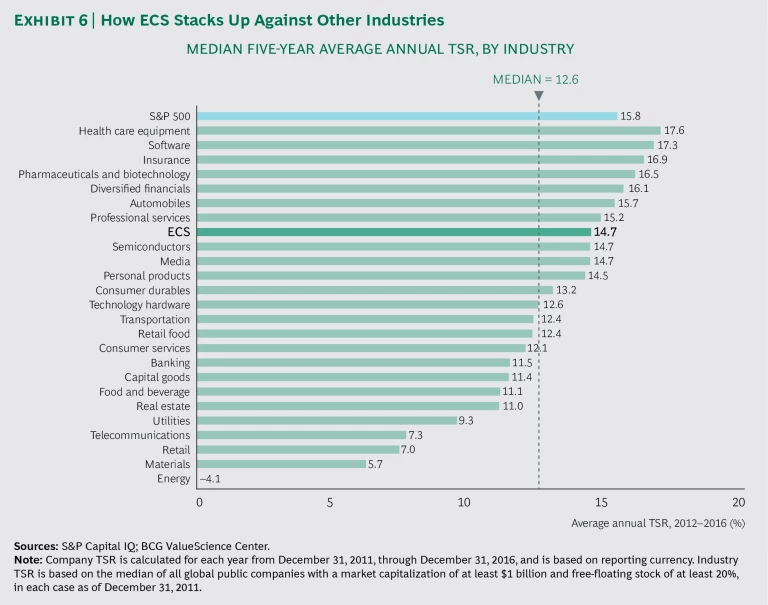
The 85 ECS companies in our sample delivered a median five-year average annual TSR of 14.7% from 2012 through 2016, compared with 15.8% for the S&P 500 over the same period. (See Exhibit 5.) The difference of 1.1 percentage points represents a significant improvement over the difference of 9.4 percentage points from 2011 through 2015. (Then, the median five-year average annual TSR was 3.2% for ECS companies, compared with 12.6% for the S&P 500.) Among the 25 industry sectors tracked by BCG, ECS finished in the top one-third (eighth place), 2.1 percentage points above the median of 12.6%. (See Exhibit 6.)
By comparison, ECS ranked in the bottom one-third in our previous two studies of five-year TSR performance. The improved performance reflects strong TSR in 2016. The relative strength is also attributable to weak performance in 2011 (the year prior to the current study’s five-year period), when the ECS sector’s median average annual TSR performance was –9%.
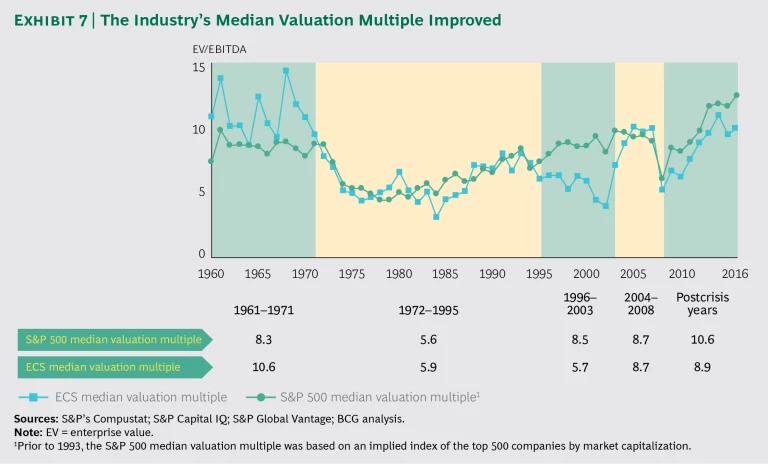
Much of the TSR improvement in 2016 was generated by an increase in the ECS industry’s median valuation multiple (the ratio of enterprise value to earnings before interest, taxes, depreciation, and amortization, or EBITDA), which rose to 10.0 at the end of 2016, from 9.5 at the end of 2015 and 7.6 at the end of 2011. Indeed, the industry’s median valuation multiple is at the high end of recent valuations—in the past 30 years, year-end multiples were higher only in 2005 and 2014. (See Exhibit 7.)
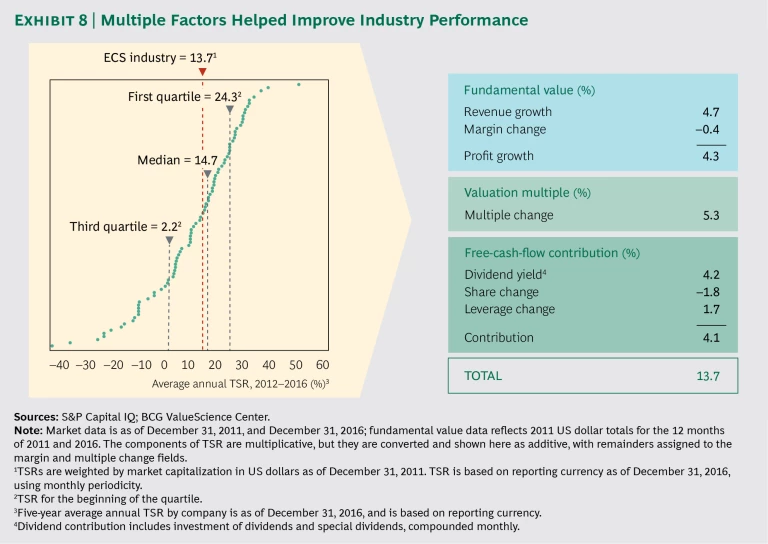
The ECS industry’s average annual TSR, weighted by market capitalization, was 13.7% from 2012 through 2016. (See Exhibit 8.) Revenue growth and the increase in valuation multiples were the most important contributors. Margin decline, although less of a drag than in previous five-year studies, continued to pull down overall TSR. Approximately 60% of ECS companies experienced declining margins during the five-year period studied. However, margins improved in 2016 and were the leading contributor to annual TSR, indicating a positive trajectory. For the ECS sector to sustain or exceed current levels of annual TSR, the positive margin trajectory must continue or other components, such as revenue growth, must increase. Because multiples are now near historical highs, the industry can no longer rely on higher multiples to be the main contributor to TSR.
Top Performers Drive Value Through Margins
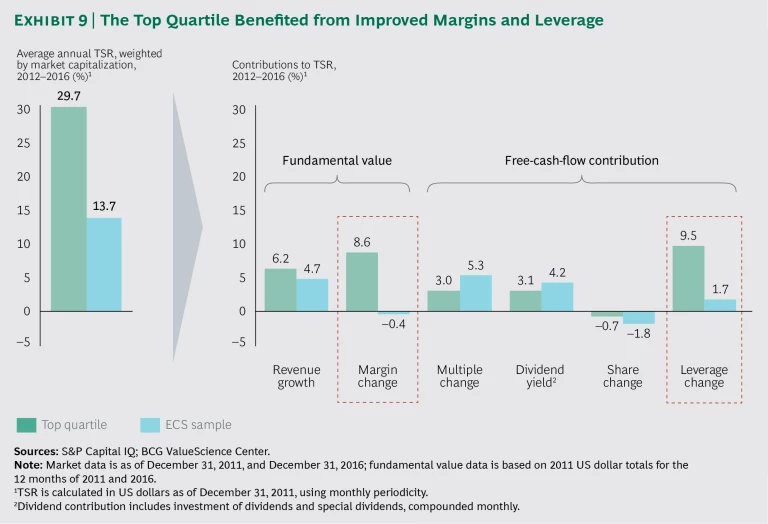
Top-quartile performers achieved a five-year average annual TSR, weighted by market capitalization, of 29.7%, more than double the full sample set’s performance of 13.7%. (See Exhibit 9.) Overall, the TSR of top-quartile performers was generated by stronger-than-average profit growth, driven by margin growth. The divergent margin trajectory for top-quartile companies, when compared with the overall sample set, is striking. Of the 16 percentage-point difference in weighted average annual TSR between top-quartile performers and the sample, more than half (9 percentage points) is attributable to the divergence in margins. The additional 7 percentage points are attributable to the change in net debt plus cash dividends. This indicates the importance of converting earnings into operating cash flow and, ultimately, into free cash flow, although doing so is often challenging in ECS companies’ complex operating environment.
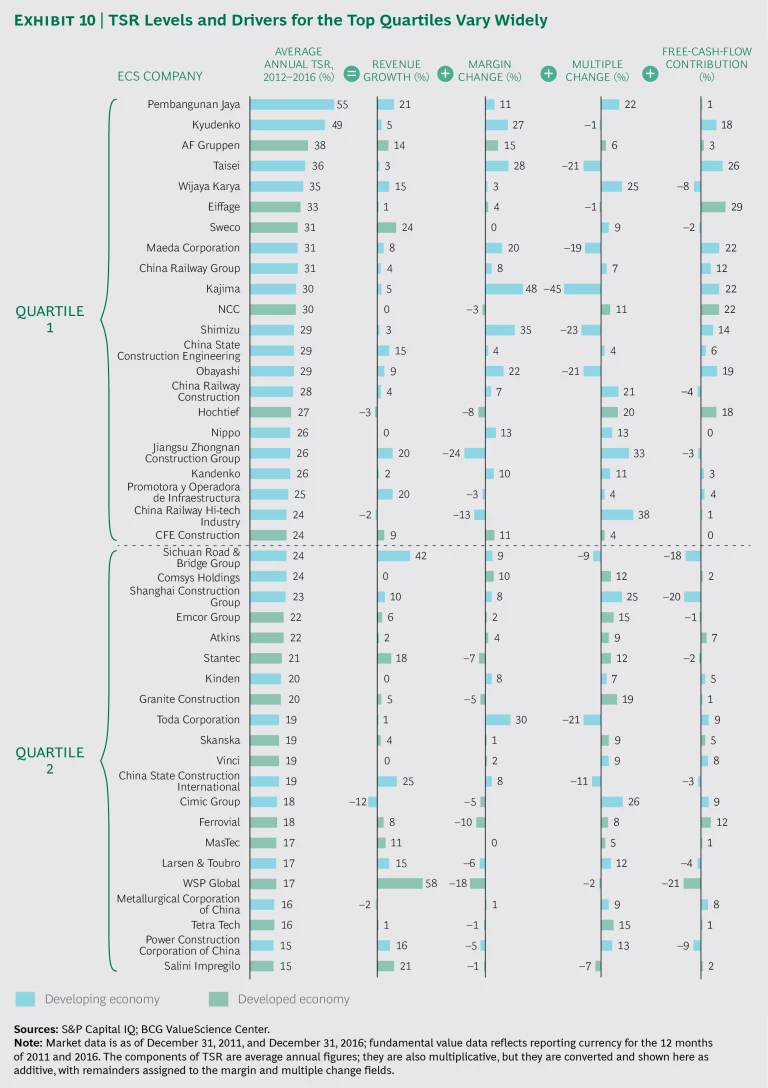
TSR levels and drivers for the top two quartiles vary widely. (See Exhibit 10.) The composition of the top-quartile companies has been remarkably stable: 66% appeared on the list in our previous study. Consistent with previous studies, infrastructure construction companies represented more than 60% (13 of 22) of the top quartile. Their strong presence reflects the continued outperformance of this business type, as well as the strength of the Japanese market, which is home to most of the top-performing infrastructure companies. As in our previous studies, Chinese and Japanese companies were the most numerous companies in the top quartile. Developing markets continued to have a larger share of top-quartile companies.
Pembangunan Jaya, an Indonesian infrastructure construction company, had the highest five-year average annual TSR in our sample: 55%. The $1.2 billion company operates primarily in its home country. Its market segments include buildings (34% of revenue), roads and bridges (21%), and harbors (9%). It also operates a smaller business line for process engineering, procurement, and construction (EPC) (14% of revenue) and a real estate development division (13%), both of which significantly diversify its operations.
Pembangunan Jaya’s sample-leading TSR performance was driven by its profitable growth in its home market. From an already strong position in Indonesia, the company generated average annual revenue growth of 21% from 2012 through 2016 in an economy that grew only by approximately 6% per year. Furthermore, margins increased, on average, 11% per year, or by 5 percentage points (to 14.9%) over the five-year period.
DIVERSE PERFORMANCE AMONG BUSINESS TYPES
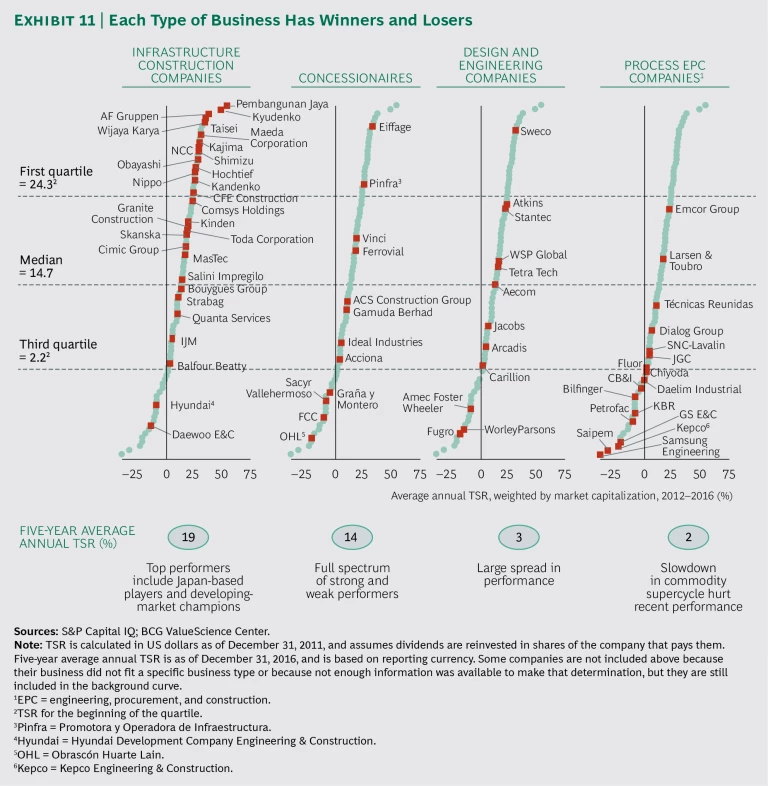
To better understand the trends affecting value creation, we categorized ECS companies according to their dominant type of business: infrastructure construction, concessionaire, D&E, and process EPC. In cases where companies have multiple business lines, we assessed publicly available information to identify the dominant one, although a determination was not possible in some cases. We excluded China-based companies and a Middle East-based conglomerate from the analysis owing to the absence of publicly available information about the prevailing business type. We found that each type of business has winners and losers. (See Exhibit 11.)
To derive additional insights into the drivers of TSR performance, we reviewed how companies in the same type of business have performed from a debt and balance sheet perspective. (See the sidebar “Trends in Leverage.”)
TRENDS IN LEVERAGE
Companies’ leverage ratio (defined as the proportion of net debt to EBITDA and weighted by EBITDA) across the four business types fell, on average, to 2.5 in 2016, from 2.7 at the end of 2011. (See the exhibit below.) Having lower leverage enhances operating flexibility, allowing companies to pursue M&A or other forms of growth investments and giving them breathing room if cash flows become constrained. Overall leverage ratios are well below the peak of 4.1 seen in 2007, prior to the global recession. However, variations in this downward trend are apparent when considering the type of business: concessionaires and infrastructure construction companies reduced leverage during the past five years, but process engineering, procurement, and construction (EPC) companies as well as design and engineering (D&E) companies increased leverage.
Concessionaire. Deleveraging has put concessionaires in their best financial shape since before the global recession. The leverage ratio for this segment fell to 4.5 at the end of 2016, from 5.2 at the end of 2011. In 2007, concessionaires’ average leverage ratio was 8.7. A decline in M&A volumes of more than 80% from 2011 through 2015 increased the cash flow available to repay debt. From 2012 through 2016, overall debt fell by 19% (at a constant exchange rate), more than offsetting a 5% decline in EBITDA.
Infrastructure Construction. For infrastructure construction, the leverage ratio fell to 0.8 at the end of 2016, from 2.1 at the end of 2011, mainly owing to EBITDA growth of 32% (at a constant exchange rate), the strongest of any business type. These companies’ strong balance sheets will enable them to be more creative in using their free cash flow during the next few years and provide protection against a market slowdown.
Process EPC. Process EPC companies had a net cash position in 2011, which gave them significant flexibility to weather the earnings downturn caused by the collapse of oil prices. Because this type of business is sensitive to commodity prices, the leverage ratio rose to 2.5 at the end of 2016. EBITDA has fallen by 24% (at a constant exchange rate), which has constrained cash flow. However, on a positive note, companies’ earnings rose in 2016, which helped them significantly reduce leverage last year. As earnings start to recover, we expect leverage levels to continue to decline.
D&E. The leverage ratio for D&E rose to 2.6 at the end of 2016 from 0.9 at the end of 2011, reaching nearly the highest level for this type of business in the past 20 years. The increase was generated by significant capital investments as well as low EBITDA growth of 8% (at a constant exchange rate) over the past five years. Announced M&A transaction values accounted for more than 90% of the EBITDA generated by D&E companies during this period. Among the leading transactions were Aecom’s $5.3 billion acquisition of URS in 2014 and Amec’s $3.3 billion acquisition of Foster Wheeler in 2013. If D&E companies maintain the same pace of M&A without reducing their debt to some extent, they will constrain their ability to use their cash flow in the future.
Infrastructure Construction: Standout Performance
Consistent with our previous ECS Value Creators studies, infrastructure construction companies stood out as the top performers; the segment had a five-year average annual TSR of 19%. Its strong performance from 2012 through 2016 was the result of margin growth among these companies, as well as a reduction in leverage. This is a turnaround from 2007 through 2011, when infrastructure construction had the weakest median performance among the four business types. During the earlier period, infrastructure spending shrank, especially in Japan and other developed markets.
This type of business was the only one in our study that generated both revenue growth and margin growth, leading to profit growth that was more than three times higher than that of the other business types.
Infrastructure construction’s high TSR performance is due, in part, to the large number of Japan-based companies (11 of 29 companies, or 38%) in the category. Japan-based companies benefited from rebuilding projects to recover from the 2011 earthquake and new construction for the 2020 Olympics in Tokyo.
Outlook. The expected acceleration of infrastructure spending in developed economies over the next five years creates a positive outlook for infrastructure construction companies, given that they have a disproportionate operational presence in these markets. Companies headquartered in Europe, Japan, or the US represent 79% (23 out of 29) of the sample studied for this business type. The recently launched or anticipated infrastructure reinvestment plans in developed markets create strong tailwinds for this segment.
Notable Outperformer. Norway-based AF Gruppen’s five-year average annual TSR of 38% was the third highest among infrastructure construction companies. Of the top five performers in the segment, it is the only one headquartered outside Asia. The company focuses primarily on the Norwegian market, with more than 92% of its $1.4 billion in revenue coming from its home market in 2016. The remainder came mainly from Sweden. Although Europe-based companies have seen declining construction revenue, those based in Norway have seen 3.3% annual revenue growth during the past five years. This was the result of growth in the transportation industry (13%) and the energy sector (5.8%).
AF Gruppen has a diversified business. Its three largest segments are buildings (56% of 2016 revenue), civil engineering projects (28%), and offshore oil and gas projects (9%). This mix has been remarkably stable, even as revenue grew, on average, 14% per year, or by more than 60% from 2012 through 2016. The company has also used M&A to grow its top line, having completed 11 bolt-on acquisitions in Norway and Sweden in the past five years.
The company’s impressive TSR performance also resulted from a strong improvement in EBITDA margins, which grew, on average, 15% per year and doubled from 5% to 10%. Each of the company’s business segments saw a substantial rise in margin over the period. Although this increase resulted from many factors, it is notable that the company implemented a risk management program to reduce the number of projects completed at negative margins.
Concessionaire: Strong Returns but an Unsettled Outlook
Concessionaire, a type of business that focuses on operating large assets across the globe, tends to have TSR that more closely tracks GDP growth than do other ECS business types.
The concessionaire segment had the second- highest five-year average annual TSR, at 14%. TSR was generated by free cash flow of 13% annually and, to a lesser extent, an increase of 4% in the valuation multiple. TSR was reduced by a profitability decrease of nearly 3% and revenue growth of approximately 1%. Revenue growth was the lowest of any business type.
Outlook. In an environment of low growth and low interest rates, concessionaires’ strong and stable free-cash-flow generation often allows them to trade at higher equity valuations, when compared with companies in other types of ECS businesses. This is because concessionaires are rewarded with a premium for stable earnings. If inflation reemerges and interest rates rise around the world, concessionaires may lose their luster. Indeed, this reversal may already be underway: their annual TSR fell to 3.8% in 2016, the lowest of the four business types.
Notable Outperformer. Eiffage, a French company, was the top-performing concessionaire, with a five-year average annual TSR of 33%. This strong performance resulted from having a resilient combination of concessionaire and infrastructure construction businesses, as well as from reducing leverage. The company’s ratio of debt to enterprise value fell to 64% at the end of 2016, from 90% at the end of 2011.
Eiffage had revenue of $14.8 billion in 2016. Its concessionaire business in France represented more than 75% of its earnings, and revenue from building, infrastructure, and energy projects made up the rest. The company’s premiere asset is its 50.1% operating stake in Autoroutes Paris-Rhin-Rhône, which is France’s second-largest toll road network and Europe’s fourth largest. The company won the operating rights in 2005. In total, 80% of the company’s revenue comes from projects in France. The remainder mainly comes from projects in other European countries, chiefly Belgium, the Netherlands, Luxembourg, and Germany.
Since the global recession, Eiffage has consistently been among the top concessionaires in TSR, largely because the company’s high free cash flow allowed it to rapidly reduce leverage. Additionally, the company has begun to realize the potential operating and revenue synergies from its combination of concessionaire and infrastructure construction businesses. Integrating these types of businesses generates complementary cash flows. The concessionaire arm provides substantial cash flows delivered late in the project life cycle, and the infrastructure construction business delivers a lower level of cash flows earlier in the project life cycle.
D&E: Margin Declines Offset Revenue Growth
Until recently, investors expected D&E to be the most profitable ECS business type. Profitability was promoted by its low capital intensity, service orientation, and lower pricing risk. However, the past five years have seen value in the ECS sector shift away from D&E to infrastructure construction. D&E’s five-year average annual TSR was 3%, dragged down by free cash flow of –4%. The negative free cash flow primarily resulted from M&A activity among D&E companies. Profit growth also lagged at 2%; revenue increases contributed 8% to TSR, but margin declines offset much of this increase.
Outlook. The growth of the infrastructure construction market in developed countries is likely to boost the performance of the D&E segment during the next five years. Because D&E companies are the first to earn revenue from new infrastructure projects, this segment is most likely to see the early benefits of the resurgence in spending.
Notable Outperformer. Sweco’s five-year average annual TSR of 31% was the highest among the sample’s D&E companies. The Sweden-based company had impressive annual revenue growth of 24% from 2012 through 2016, fueled by extensive M&A activity. Notably, this growth occurred in Western Europe, where the infrastructure construction market has been shrinking for the past decade. The company focuses its business in eight countries in the northern part of the region: Belgium, Denmark, Finland, Germany, the Netherlands, Norway, Sweden, and the UK. It ranks among the top three D&E companies in all of these markets, except the UK. The company works in a diverse mix of sectors: buildings (37% of revenue); industry, water, and energy (32%); and transportation infrastructure (31%).
The company has used M&A to expand from its base in Sweden to become the largest Nordic D&E company, even as the overall European infrastructure construction market was shrinking. From 2001 through 2016, it made 116 acquisitions, including 33 in the past five years. These acquisitions represent 81% of the notional value (SEK 6.6 billion) spent by the company, according to our analysis. The size of these deals varied widely. The largest was the 2015 acquisition of Grontmij, which increased Sweco’s size by 70%. The company focuses on capturing synergies from its acquisitions. Nearly 20% of its 2016 EBITDA was generated by acquisition synergies.
Process EPC: Returns Are Linked to Oil Prices
Process EPC’s five-year average annual TSR of 2% is the lowest among the four types of businesses. Because the business is tied to commodity prices, process EPC companies typically have the most volatile TSR performance. Their TSR is particularly sensitive to changes in oil prices, which plunged 49% (from $111 to $57 per barrel) from 2012 through 2016. It was boosted by a significant increase in their valuation multiples, without which process EPC’s five-year average annual TSR would have been –5%. Process EPC companies now have the highest valuation multiples, compared with companies in other types of ECS businesses.
Outlook. The outlook for process EPC companies closely tracks the outlook for commodity prices—most important, the price of oil. Oil prices are averaging approximately $50 per barrel year to date in 2017, still sharply lower than levels that exceeded $100 per barrel a few years ago. Some oil and gas producers (particularly those in North America) that slashed capital expenditures during the downturn are now stabilizing or even increasing their budgets. However, producers have sought to improve the efficiency of their spending, both internally and externally, in order to produce a given output at lower cost. A necessary consequence of this effort is that process EPC companies must reduce their margins, dimming the outlook for stronger TSR performance.
Notable Outperformer. US-based Emcor Group was the top-performing process EPC company, with a five-year average annual TSR of 22%. The company’s consistent outperformance in TSR results from revenue and margin growth, as well as a higher valuation multiple. It is the only process EPC company to have positive margin growth from 2012 through 2016.
The company’s core business is making electrical and mechanical subsystems for new construction and renovations. Emcor is among the few large companies dedicated to this niche. It competes mainly against smaller local players and large players with a smaller business in subsystems.
Emcor had revenue of $7.6 billion in 2016; more than 90% was generated in the US. Like any process EPC company, new construction accounts for much of its business (34% of revenue). However, the company has developed two less-cyclical business lines: renovation and retrofitting work (21% of revenue) and services (45%). These two business lines helped to offset the slowdown in the company’s petrochemical-based business. Emcor has generated revenue growth with an M&A strategy that emphasizes bolt-on acquisitions. It has completed 34 acquisitions since 1997, including seven in the past five years.
WILL M&A ACTIVITY REBOUND?
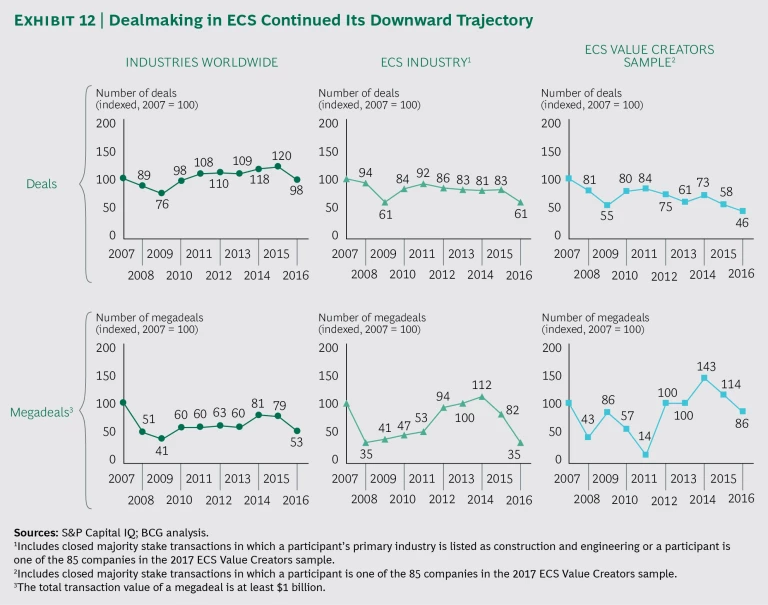
Companies in the ECS Value Creators sample had depressed levels of M&A activity in 2016, but they were not alone. The ECS industry overall experienced a decline in the number of deals, as did industries worldwide. (See Exhibit 12.) The number of completed M&A deals that were announced in 2016 by ECS companies in the sample set fell by 20%, compared with the number in 2015, representing less than half the number in 2007 and the lowest level in the past ten years. US- and Europe-based ECS companies continued to be the most active dealmakers, participating in approximately three-quarters of the deals.
The number of ECS companies in the sample set that were sellers increased; more than one-third (36%) of transactions in 2016 were the sale of an asset or a subsidiary, up from slightly more than one-fifth (22%) in 2007. Coming at a time of rising valuations, this trend indicates that companies recognized the opportunity to create shareholder value as sellers.
Some companies have also recognized the potential to create value by spinning off a robust, high-performing technology division into a standalone company. For example, Stantec, a D&E company, acquired MWH Global, a D&E company specializing in water infrastructure, for $793 million in 2016. The acquisition included Innovyze, MWH’s fast-growing analytics software business. Although the software business represented less than 5% of MWH’s total revenue, Stantec was able to recoup more than one-third of the purchase price of MWH by selling Innovyze to an investment firm for $270 million in 2017. To support such strategic decision making related to technology investments, BCG has created the ECS Technology Index. (See the sidebar “The 2017 ECS Technology Index.”)
THE 2017 ECS TECHNOLOGY INDEX
The 2017 ECS Technology Index is a portfolio of 15 publicly listed technology and IT companies that participate primarily or significantly in the ECS space. These ECS tech companies include providers of software, drones, robotics, cybersecurity services, and project management services. The index was introduced in last year’s report; this year we refreshed the portfolio to reflect the ongoing evolution of ECS tech companies.
We compared the performance of the ECS Technology Index with that of our ECS Value Creators sample and of various US indexes. (See the exhibit below.) The ECS Technology Index trades at a higher multiple (a median of 19.6 times EBITDA in the past three years) than the ECS Value Creators (a median of 10.0 times EBITDA in the past three years). Moreover, ECS tech companies have a higher multiple than that of the balanced portfolio of the S&P 500 information technology index. These results show a continuation of the trend we found last year. Indeed, the valuation premium enjoyed by ECS tech companies has increased to the highest level since the financial crisis.
ECS tech companies have achieved higher valuations, at least in part, because they are not burdened by the challenges that ECS incumbents must address in their businesses. For example, ECS tech companies can capture the benefits of global scale in selling their software and devices, without the need for a strong local presence. Given such advantages, the valuation premium for ECS technology is likely to continue increasing.
The number of megadeals (those with a total transaction value of at least $1 billion) involving ECS companies also continued to trend lower, following several years of resurgence earlier in the current decade. In recent years, megadeals have skewed toward bolt-on acquisitions or asset purchases. Company acquisitions represented only 33% of the sample set’s megadeals in 2016.
One of 2016’s megadeals was France-based Vinci’s purchase of Linea Amarilla (Lamsac), a Peruvian concessionaire, for $1.1 billion. The acquisition, which included Lamsac’s 33-year concession contract on a 25-kilometer highway in Lima, increased Vinci’s access to and scale in the Peruvian concessionaire market. However, with an estimated annual EBITDA of €60 million for the highway concession, this deal represents only approximately 1% of Vinci’s EBITDA. The deal was the most recent of Vinci’s efforts to buy access to Latin America’s higher-growth market. The French company has also recently completed deals in energy services in Brazil and real estate development in Colombia.
Industry Growth Will Promote Consolidation
Although the volume of ECS M&A activity has fallen sharply during the past decade, we think conditions are favorable for a rebound. Higher valuations, recovering growth in developed markets, and margin improvements all support a rebound. Furthermore, the number of construction companies, both residential and nonresidential, in developed markets has started to increase again. After decreasing by 5% from 2007 through 2013, the number of companies grew by 4% from 2014 through 2015.
Finally, after being regarded as a destroyer of acquirers’ value, strategic M&A has once again become one of investors’ preferred outlets for the use of a company’s free cash flow. In the 2016 edition of BCG’s annual Investor Survey, 48% of respondents recommended M&A as a top-two use of capital, an increase of 7 percentage points since 2009.
Chinese and US Companies Look to Outbound M&A
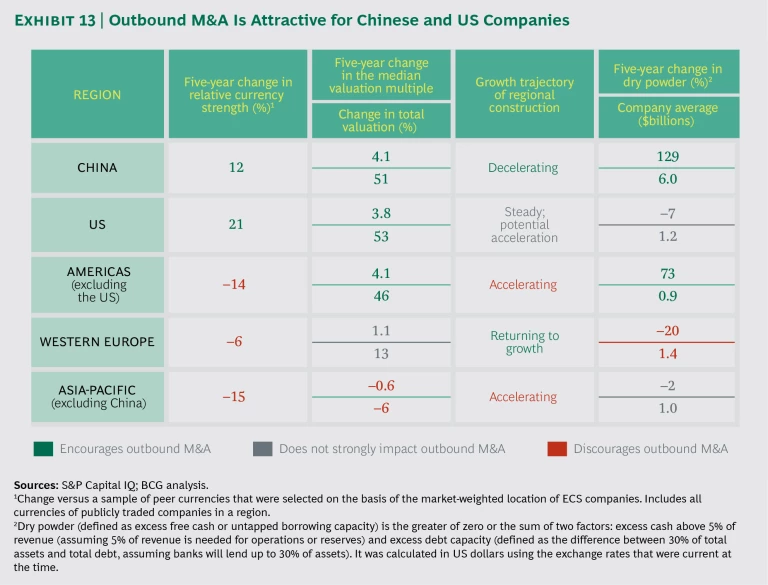
To gain a better understanding of the outlook for deal making, we analyzed the attractiveness of outbound M&A for ECS companies in major regions. (See Exhibit 13.) On the basis of common metrics for evaluating the M&A environment, China and the US stand out as particularly strong markets from which to initiate outbound M&A.
- Currency Strength. Both China and the US have relatively strong currencies, which gives companies with cash flow in renminbi or dollars an advantage in acquiring businesses or assets internationally. Companies that spend strong currencies get more value for their money in the M&A market relative to companies that spend weak currencies.
- Valuation Multiple. Of all ECS companies, those based in China or the Americas (excluding the US) have seen the largest five-year median valuation multiple increase (an average increase of 4.1 times in each region). US-based companies were not far behind, with multiples increasing, on average, 3.8 times. Through outbound M&A, companies can take advantage of their high valuations by acquiring companies in other regions that trade at lower multiples. Additionally, because companies with high valuations can issue equity to new investors with less dilution of the existing investor base, they have greater access to capital.
- Growth Trajectory of the Construction Market. Although nonresidential construction market growth is accelerating in much of the world, the Chinese construction market stands out for its decelerating growth. Companies in construction markets with weak or slowing growth rates often have excess capacity, which they could put to use by acquiring companies in other markets. The steady growth trajectory of the US market means that US-based companies do not need to turn to outbound M&A to absorb excess capacity and capital. If the growth potential of the Trump infrastructure plan is realized, US companies would be less likely to pursue outbound M&A.
- Dry Powder. To pursue M&A, companies need dry powder—excess free cash or untapped borrowing capacity. Chinese companies stand out for having significant dry powder, with an average of $6 billion of capital available at the end of 2016. Many Chinese companies are backed or owned by the Chinese government. The government and these enterprises have actively encouraged outbound M&A to absorb the significant excess liquidity in China, including more than $3 trillion of foreign exchange reserves. By comparison, US companies have less liquidity. They lack a growing pool of cash, and the available capital per company is, on average, nearly 80% less than that of their Chinese counterparts.
To understand Chinese ECS companies’ focus on outbound M&A, it is important to note that Chinese companies across industries have been increasingly pursuing deals. Outbound M&A has been particularly strong, with 15% CAGR during the past decade. In early 2016, there was a temporary slowdown in response to fears of a sharp downturn in economic growth, both domestically and internationally, but deal volumes rebounded in the second half of the year.
The trend for Chinese ECS companies has been similar to that of the overall Chinese market, albeit beginning from a lower starting point. M&A volumes increased over the past decade, as did the share of outbound deals. Chinese companies’ outbound M&A has typically entailed acquiring an asset, rather than an entire company, with the focus shifting from mining to real estate assets over the past decade. In 2016, the largest Chinese outbound deal in ECS was a $1.2 billion investment in Bandar Malaysia, a real estate development project in Kuala Lumpur, by the state-owned parent company of China Railway Group.
Outbound M&A has helped propel Chinese companies up the ranks in an annual list of top international contractors (in terms of revenue generated outside their home markets) prepared by Engineering News-Record. In 2011, there were only two Chinese companies among the top 20 contractors; by 2016, there were four.
China Communications Construction Company (China CCC) was the third-largest ECS contractor in 2016, up from eleventh in 2011. It has $61.9 billion in revenue and ranks as the fourth-largest ECS contractor both in China and in the world. It operates four distinct businesses: infrastructure construction, D&E, dredging, and heavy machinery manufacturing. The latter two do not fit within our definition of ECS business types, but they represent less than 15% of the company’s total revenue. With construction projects underway in more than 135 countries, China CCC has been more focused on international expansion than its larger Chinese contracting peers. International growth has been an important contributor to the company’s business, with international revenue having 22% CAGR over the past five years (versus total revenue CAGR of 7%). International revenue now makes up an estimated 18% of the company’s revenue base.
To accelerate international growth, China CCC has participated actively in the outbound M&A market. In 2015, the company paid $800 million for John Holland Group, an Australia-based contractor with operations in Australia and New Zealand. In 2016, the company completed two more international deals, one in Australia and another in Ecuador. The company made an unsuccessful bid to acquire IDE Technologies, an Israeli desalination technology company, for $650 million.
WINNING IN A ONE-SPEED WORLD
To position themselves to win in a one-speed world, ECS companies should follow four key success factors.
Pursue Opportunities in Rebounding Developed Markets
Since the Great Recession, global ECS companies have grown by expanding into developing markets through international partnerships, M&A, and business development. Today, however, companies should return their attention to the developed markets they know well and identify the new growth opportunities. To capture these opportunities and convert the revenue into profits, companies should ensure that their growth strategy reflects their distinctive competitive strengths. Two imperatives should guide the effort:
- Identify the most attractive markets to target on the basis of potential projects’ size, margin potential, and fit with capabilities (those that are in-house or available through partnerships). A target market should have a multitude of projects for which a company is well suited in terms of technical competency, a strong and specific résumé of work, the ability to attain scale, and the opportunity to add unique value to the project team.
- Within each target market, focus business development on the most attractive projects, rather than trying to capture all opportunities. As lists of potential projects grow, be selective about which projects to bid on. Use strong relationships with customers and partners in core home markets to gain an edge. Winning companies will be distinguished by their ability to identify and capitalize on growth opportunities that suit their strengths. Incumbents in developed markets should prepare to be challenged by competitors based in developing markets—such as Brazil, China, and India—as they seek growth opportunities abroad. These challengers often have an advantage with respect to lower operating costs. To preserve their market leadership, incumbents need to bid on the basis of competitive differentiators beyond price, such as local expertise, distinguished talent, unique intellectual property, or superior processes.
Rethink M&A Strategy
ECS companies have become more expensive to acquire; the valuation multiples of acquired companies are at postcrisis highs, approaching those of ECS companies in our sample set. Higher prices for acquisitions offset the higher valuations that acquirers typically receive from equity markets when they become larger companies. Because companies cannot rely solely on generating value from the transaction, they must rethink their M&A strategy from end to end:
- Evaluate M&A opportunities from all possible angles, considering acquisitions and sales of entire companies, business lines, and assets. Given the rich valuations in the current market environment, sales may be the best way to generate TSR through M&A. To identify noncore assets that may have higher value through a sale or spinoff, review business lines, market segments, and locations served.
- Rigorously identify synergies. Experience from recent ECS mergers suggests that cost synergies are generally 1% to 3% of a target’s annual revenue. These cost synergies mainly relate to head count reductions, particularly through the consolidation and streamlining of back-office functions. Other improvement opportunities include rationalizing supplier contracts, consolidating physical locations, and achieving economies of scale. Revenue synergies can be valuable, but they need to be carefully thought out and supported by well-documented, reasonable assumptions. By integrating both companies’ résumés of completed projects and their pricing models, as well as gaining scale, a combined organization can increase its chances of winning major projects. However, acquirers seeking revenue synergies also need to carefully review the structure of the combined organization. Because people are revenue- generating assets in the ECS industry, it is essential to ensure that culture, communication, and employee retention will promote revenue synergies.
- Focus on execution to capture the synergies. Even before an acquisition has closed, take steps to accelerate capturing the identified synergies. These steps should include tightly linking due diligence and postmerger integration planning. The use of “clean teams” is essential to plan the integration process. (A clean team is an independent group that, with management’s guidance, collects and analyzes sensitive company data before the closing.) After the acquisition has closed, use stretch targets to intensify integration teams’ focus and encourage creative thinking. Combine rapid, top-down stretch target setting with bottom-up validation to enable progressively greater degrees of accuracy and detail. Pursue revenue synergies with the same rigor as cost synergies, and track performance throughout the integration process. (See Six Essentials for Achieving Postmerger Synergies , BCG Focus, March 2017.)
Companies that might be attractive acquisition targets should position themselves to capture the highest premium. It is important to identify how an acquirer could create value, how the value could be captured rapidly, and which potential suitors could benefit the most. Companies should also seek to address shortcomings in the current business, such as by hiring new executives, developing new businesses, or making bolt-on acquisitions.
Become a Digital ECS Company
Front-running ECS companies have recognized the potential of digital technology to revolutionize their operations and are ramping up their adoption. (See The Transformative Power of Building Information Modeling , BCG Focus, March 2016.) However, for a variety of reasons, many ECS companies have been slow to adopt digital technologies. For example, companies that are accustomed to payment on a cost-plus or time-and-materials basis often lack incentives to try out digital technologies that may promote greater efficiency. When digital adoption does occur, it is typically at the project level, with little continuity from project to project.
ECS companies that become leaders in digital adoption can capture at least a portion of the valuation premium enjoyed by companies that sell technology-related ECS products and services and thereby generate higher TSR. For many ECS companies, successfully adopting digital technology will require significant changes in how they operate.
- Build teams and an organization that stimulate an innovative culture. Develop an overarching digital vision for the company and adapt the organization’s ways of working to achieve that vision. Promote agility and accelerate innovation by establishing cross-functional, multidisciplinary teams that take an organization-wide view of problem solving. Encourage thinking from the customer’s perspective to identify the most important pain points and address them using digital technology.
- Create an environment where digital adoption is fostered and rewarded. Organize the company around product platforms, rather than individual project teams, to promote knowledge sharing and ensure that digital innovations are used in multiple projects. Adopt rapid prototyping and piloting, even for one project, to obtain quick feedback that demonstrates the value of an innovation. Focus on nurturing the broader digital ecosystem, including the local supply chain or partnerships. Ensure that project owners and partners support, contribute to, and benefit from digital adoption.
- Use digital to drive growth and new opportunities. Consider how innovations, such as building information modeling, analytics, and the Internet of Things, could affect the company’s business model. Be willing to adapt the model to capture all the advantages. In working with project owners, advocate for the use of new collaboration models in which contractors share in the risks and rewards of long-term project performance. Proactively shape the regulatory environment so that the government helps to promote, rather than impede, the adoption of digital innovations. And improve reporting and communication to investors about the value created by digital business units.
Prepare for Inflation and Rising Interest Rates
After years of near- or below-zero interest rates and massive fiscal stimulus programs in developed markets, governments and central banks are starting to raise nominal interest rates and reduce liquidity. To prepare for the new environment of inflation and rising rates, ECS companies should take the following steps:
- Review how rising rates will affect existing contracts, the cost base, and the capital structure. The margins of existing businesses can easily fall below the anticipated levels as rates rise.
- Assess potential projects in the context of rising material and labor costs. The latter, in particular, should be carefully monitored and addressed, because rising wages will make it more expensive to hire qualified workers for ongoing projects. For example, contracts could require that payments be adjusted to account for labor-cost inflation. When negotiating new contracts, ensure that projects will continue to have healthy margins as rates rise.
- Take advantage of growing demand to optimize prices and expand margins. Inflation results from underlying scarcity, which creates the opportunity to raise prices on new project bids. Focus on projects that only a small subset of ECS companies could execute, whether because of the project’s size, location, or requirements for niche expertise. When bidding on such projects, set prices to enable high margins, taking into account the opportunity cost incurred if the project team would become unavailable for other potential projects.
QUESTIONS TO CONSIDER
As ECS companies seek to grow in a one-speed world, they should consider the following questions:
- How should we balance revenue growth and margin expansion as growth returns to developed markets?
- How should we use M&A to gain scale and increase our competitive advantage in products or markets without overpaying for assets in an environment of rising valuations?
- What is the best approach to technology? Will we create more value by developing technology in-house, acquiring it, or gaining access through partnerships?
- How can we maintain cost discipline in our quest for growth? Can our existing book of business withstand the pressures of inflation and rising interest rates?
Construction growth is finally rebounding in many developed markets. However, the convergence of ECS industry growth rates among developed and developing markets does not guarantee high shareholder returns. Indeed, the wide variation of TSR performance in our sample set indicates that some ECS companies have significant room for improvement. Only companies with a deep understanding of how they can win in a one-speed world will succeed in taking full advantage of the new growth opportunities.
