Europe’s national railway systems continue to face the challenge of maintaining high performance in an era of austerity. Despite budgetary constraints, several countries have recently adopted ambitious investment plans for their systems. Last year, Italy unveiled a ten-year program supported by planned investments of €100 billion, including €73 billion designated for infrastructure improvements. In 2014, Great Britain announced a five-year program to invest £38 billion in its system. Belgium approved a €25 billion investment plan in 2013, to be implemented over 12 years. Regulators and policy makers considering whether to pursue similarly ambitious programs need to answer a critical question: How should a country manage its investment policy to promote a railway system’s high performance over time?
BCG’s 2017 European Railway Performance Index (RPI) report provides insights for stakeholders seeking to answer this question. To our knowledge, the RPI enables the most comprehensive benchmarking of European railway operations by considering the three critical components of railway performance: intensity of use, quality of service, and safety. This comprehensiveness allows for isolation of the factors that drive high performance.
The 2017 RPI report follows from the first two editions, published in 2012 and 2015. Over the five-year period covered by the three RPI studies, countries have generally remained within the same performance tiers. Notably, we detect an incipient trend of large systems having more difficulty than small systems in maintaining performance levels. This may reflect the complexity of maintaining and operating a large system, however, and additional RPI studies will be needed to confirm this preliminary observation.
Safety and quality of service (especially punctuality) are the most important factors underlying changes in a system’s performance. Countries experiencing a decrease in overall performance typically have seen a decrease in their safety rating, while those with improving performance have usually experienced an increase in their quality of service rating.
Our 2017 study reaffirms the key findings of the first two editions of the RPI report. We again found that a railway system’s overall performance typically correlates with the level of public cost, which we define as the sum of public subsidies and investments in the system. This year’s study found that the correlation strengthens over time: the more a country increases investments in its railway system, the greater the improvement in the system’s performance. We also again found that the value derived from public cost rises or falls along with the percentage of public subsidies allocated to infrastructure managers. The study found only weak correlations between performance and the degree of liberalization or the choice of governance model.
Taken together, these insights are a warning signal for regulators and policy makers seeking to improve a railway system’s performance. For countries with slightly decreasing performance, public cost stabilized at current levels may no longer be sufficient to maintain high performance. It takes several years for performance declines to become clearly visible, so now is the time to take action to reverse incipient declines to ensure that railway customers do not experience their impact. Significant investments are likely needed to produce tangible performance improvements in the short term.
Three Dimensions of Railway System Performance
The RPI measures the performance of railway systems in three dimensions for both passenger and freight traffic:
- Intensity of Use. To what extent is rail transport used by passengers and freight companies?
- Quality of Service. Are the trains punctual and fast, and is rail travel affordable?
- Safety. Does the railway system adhere to the highest safety standards?
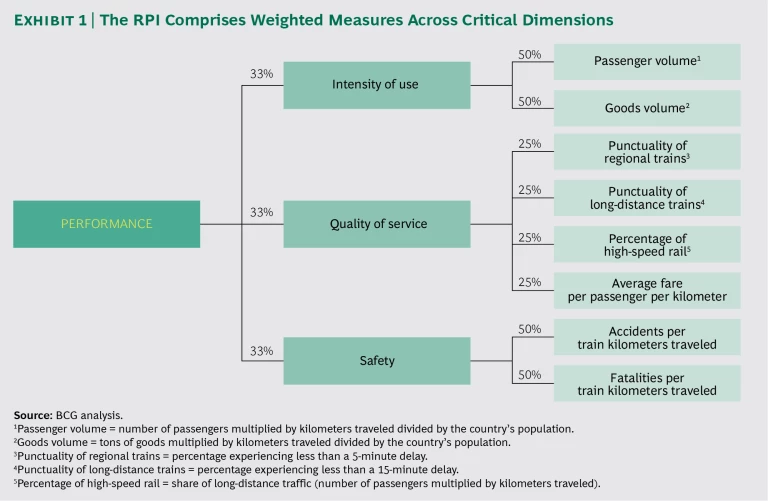
We confined the analysis to these dimensions to create an indicator that is comprehensive yet easy to understand. Each dimension comprises at least two subdimensions, and all were given equal weight. (See Exhibit 1.) We rescaled the data to represent a score of 0 to 10 for each subdimension. To create the index, we then combined the ratings for each dimension and subdimension based on their weighting.
The index’s simplicity results in three methodological biases:
- Passenger performance is overweighted relative to freight performance because reliable information about the quality of service for freight operators—especially in terms of price and punctuality—is unavailable. Consequently, the RPI for a particular country may not necessarily reflect high quality in the country’s freight services.
- Large countries are favored relative to smaller countries because the quality-of-service dimension takes into account the share of high-speed-rail travelers. That is significant because high-speed travel is more common in countries with railway networks that cover long distances.
- Countries in which consumers have low purchasing power are favored relative to those in which purchasing power is higher, because we do not adjust average fares on the basis of purchasing power parity (PPP). Nevertheless, a PPP adjustment would have only a small impact on countries’ rankings, since it would mainly reinforce differences between tiers.
One caveat: the primary source for data used in this year’s RPI is the International Union of Railways (UIC) 2014 database. Some countries, however, do not provide all the information that the UIC requests. We were thus unable to include those countries in every analysis. Furthermore, due to the unavailability of data, Estonia and Greece were excluded from the RPI altogether.
Three Tiers of National Railways
Three groupings of national railways emerged from the analysis:
- Tier One (RPI of at least 6 out of 10). Switzerland, Denmark, Finland, Germany, Austria, Sweden, and France.
- Tier Two (RPI between 4.5 and 6). Great Britain, the Netherlands, Luxembourg, Spain, the Czech Republic, Norway, Belgium, and Italy.
- Tier Three (RPI below 4.5). Lithuania, Slovenia, Ireland, Hungary, Latvia, Slovakia, Poland, Portugal, Romania, and Bulgaria.
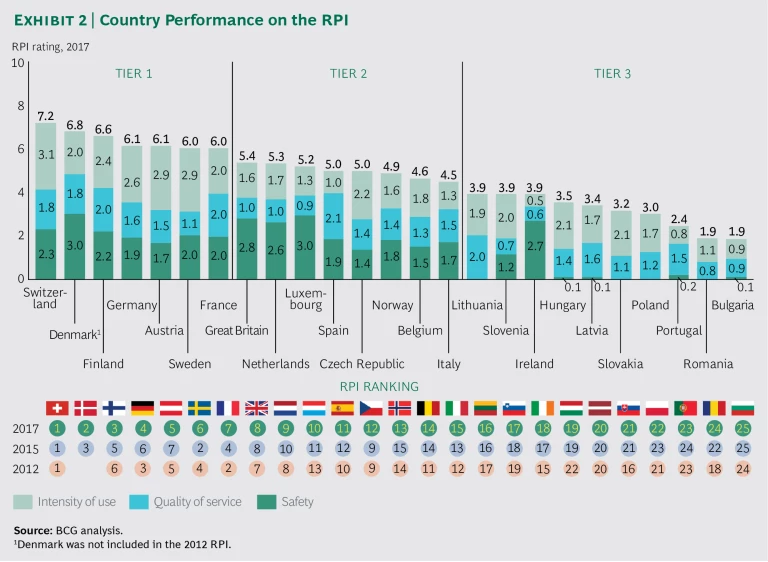
Exhibit 2 shows each country’s performance, overall and for each of the three dimensions, as weighted in accordance with the methodology. For example, Switzerland’s rating of 9.2 for intensity of use appears as 3.1 in the exhibit because each dimension contributes one-third to the overall rating. The exhibit also shows each country’s RPI ranking in 2012 and 2015, for comparison.
The results of the 2017 RPI are generally consistent with the results of the 2015 and 2012 studies. Denmark, Finland, France, Germany, Sweden, and Switzerland remain in tier one; Denmark and Finland show overall performance improvements, while Sweden and France have lost some ground.
Austria returns to tier one, thanks to improvements in punctuality and intensity of use. Tier two’s composition remains stable as well; Luxembourg and Norway moved up in the rankings, while the Czech Republic and Italy fell back.
In the descriptions below of the performance of individual railway systems in each dimension, “excellent” denotes a weighted rating of 2.7 or above, “very good” denotes a rating of 2.0 to 2.6, “good” denotes a rating of 1.3 to 1.9, and “poor” denotes a rating of less than 1.3.
Tier One. The railways in tier one perform well in at least two dimensions, although the results were not uniform.
- Switzerland. With a rating of 7.2 overall, Switzerland has excellent intensity of use, notably driven by passenger traffic. It also has a good rating for quality of service and a very good rating for safety.
- Denmark. At 6.8, Denmark has an excellent rating for safety, a very good rating for intensity of use, and a good rating for quality of service.
- Finland. The country’s overall rating is 6.6. Finland has a very good rating for intensity of use, notably driven by freight traffic, as well as for quality and safety.
- Germany. With an overall score of 6.1, Germany has a very good rating for intensity of use, by both passengers and freight. It has good ratings for quality of service and safety.
- Austria. The country is rated at 6.1, overall. Austria’s excellent rating for intensity of use, by both passengers and freight, is tied for second highest in the index. However, its safety rating of good is among the lowest outside of tier three. It also has a good rating for quality of service.
- Sweden. At 6.0, Sweden has an excellent rating for intensity of use by both passengers and freight and a very good rating for safety. However, it has a poor rating for quality of service, mainly because of lower punctuality than other tier one countries.
- France. France’s rating of 6.0 overall is driven by very good ratings for intensity of use by passengers and for quality of service and safety.
Tier Two. Countries in tier two have high-performing railway systems overall. The similarity among their RPI ratings, however, obscures a wide range of results among the three dimensions. The highest-ranked systems have high safety scores, but low scores for quality and intensity of use:
- Great Britain. At 5.4, Great Britain has an excellent rating for safety. However, its rating for intensity of use is only good, owing to a low level of freight utilization, and its quality of service is poor because of high fares and the relatively low punctuality of regional trains.
- The Netherlands. With a rating of 5.3 overall, the Netherlands has a very good rating for safety. However, like Great Britain, its low level of freight utilization results in an intensity of use rating of only good. The country also has a poor rating for quality of service.
- Luxembourg. An excellent safety rating contributes to the country’s overall score of 5.2. However, Luxembourg’s rating for quality of service is poor, owing to high fares, while its intensity of use is rated only good because of low freight utilization.
Of the railways in tier two countries, two have good or very good ratings for quality of service and safety, but low ratings for intensity of use (especially for freight):
- Spain. The country has an overall rating of 5.0. Spain’s high-speed service helped it earn a very good rating for quality of service, and it has a good rating for safety. But the country’s intensity of use is poor, especially for freight.
- Italy. With an overall rating of 4.5, Italy has good ratings in all three dimensions. However, its intensity of use rating is quite low, reduced by low freight utilization.
Among the other tier two countries, Norway, with an overall rating of 4.9, and Belgium, with 4.6, have good ratings in all dimensions. The Czech Republic, at 5.0, has a very good rating for intensity of use, driven by freight utilization, and good ratings for quality and safety.
Tier Three. The railway systems in almost all the tier three countries have poor safety ratings. One exception is Ireland: its safety rating is among the highest in the index. Ireland’s overall rating, 3.9, is pulled down by very low ratings for intensity of use and quality of service.
Slovenia, Hungary, and Slovakia are rated very good for intensity of use, while Lithuania, Latvia, and Poland are close behind with ratings of good. Portugal, Romania, and Bulgaria—in addition to Ireland—have poor ratings for intensity of use.
An Incipient Trend in Railway Performance
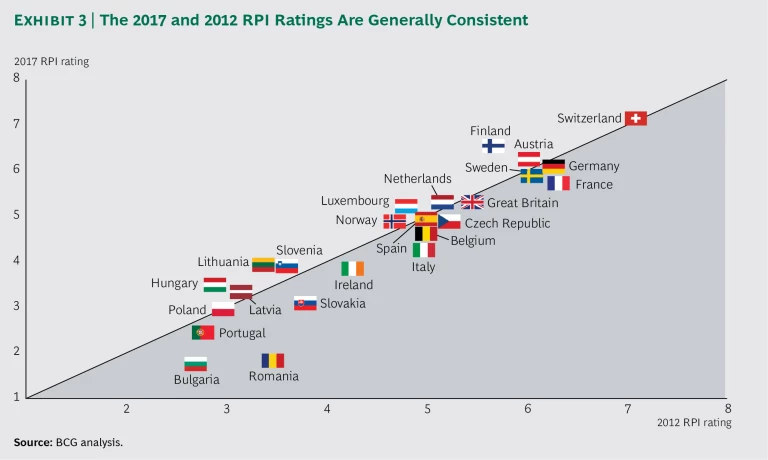
To identify how railway systems’ performance is changing, we compared the RPI ratings for 2017 and 2012. (See Exhibit 3.) Although we found that the ratings are generally consistent between the two studies, we identified what may be the beginning of a downward trend in performance.
Large railway systems show signs of a slight performance decline. Countries with the largest systems (more than 15,000 kilometers of track)—France, Germany, Italy, Great Britain, and Spain—have experienced slight decreases in RPI ratings. In contrast, countries with the smallest systems (fewer than 6,000 kilometers)—Denmark, Finland, Norway, Switzerland, the Netherlands, and Luxembourg—have seen increases in their RPI ratings. The disadvantage experienced by large systems can perhaps be explained by the complexity of maintaining and operating them. A large system includes subsystems that may vary considerably with respect to characteristics such as traffic density and the age of the technology. This heterogeneity appears to promote greater operational complexity, which complicates decisions about how to allocate financial and human resources. As a result, scale effects may be harder to capture in larger systems.
Changes in safety and quality have the greatest impact. Safety and quality of service (especially punctuality) appear to be the most important factors underlying changes in a system’s performance. We have seen only small variations in intensity of use from year to year, and these have little impact on overall performance.
A decrease in safety is typically the factor responsible for an overall decrease in performance. Germany, France, Spain, Belgium, and Italy have seen slight declines in their RPI rating, usually owing to their systems’ relative underperformance in safety. At the European level, safety improved from 2010 through 2014 (the period encompassed by the RPI studies).
Countries with improving performance usually experience an increase in their quality of service rating. Austria’s return to tier one in the 2017 RPI is the result of its relative overperformance in punctuality (more than 95% for both regional and long-distance service). Increased punctuality also contributes to relatively improved ratings for quality of service in Finland, the Netherlands, Norway, and Switzerland.
It is important to note that the apparent relationship between system size and performance is a preliminary observation. We will continue to explore this relationship in future RPI studies.
Higher Public Cost Correlates with Performance Improvement
With the benefit of data covering a longer period of time, we were able to reaffirm the findings of the first two RPI studies, in particular the correlation between public cost and performance levels. The additional data also allowed us to compare the evolution of countries’ public cost with the evolution of their railway performance.
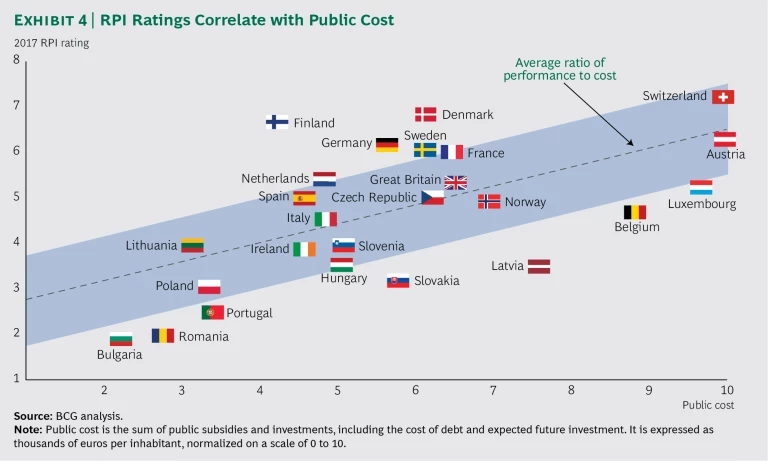
As in previous RPI studies, we compared each country’s overall RPI rating with its public cost (again, the sum of public subsidies and investments in the system). Public subsidies are recurring government contributions that support passenger and freight operations and infrastructure maintenance (excluding investment subsidies). Public investments are one-time government and company investments in infrastructure construction projects.
Because public investments are project-based expenditures, we used the average annual investment over the six-year period from 2009 through 2014. To capture the amount of public investment more comprehensively, we adjusted the average annual investment figure to include the cost of servicing debt and the amount of future investments (these adjustments were not made in the 2012 RPI study). We then converted the public cost to per capita figures for each country—thousands of euros per inhabitant—and normalized the figures on a scale of 0 to 10.
Overall, as in 2012 and 2015, this year’s study shows a correlation between public cost and a given railway system’s performance level as measured by the RPI. (See Exhibit 4.) In addition, it reveals differences in the value that countries receive in return for their public cost. Denmark, Finland, France, Germany, the Netherlands, Sweden, and Switzerland capture relatively high value for their money. These countries outperform relative to the average ratio of performance to cost for all countries. In contrast, Luxembourg, Belgium, Latvia, Slovakia, Portugal, Romania, and Bulgaria get relatively low value for their money.
We again found that the financing model helps explain why some countries derive more value from their public cost. The 2017 study is consistent with our 2015 study on the relationship between public-cost efficiency and the share of subsidies allocated to infrastructure managers. A transparent subsidy structure, in which public subsidies are provided directly to the infrastructure manager rather than spread among multiple train-operating companies, correlates with a higher-performing railway system.
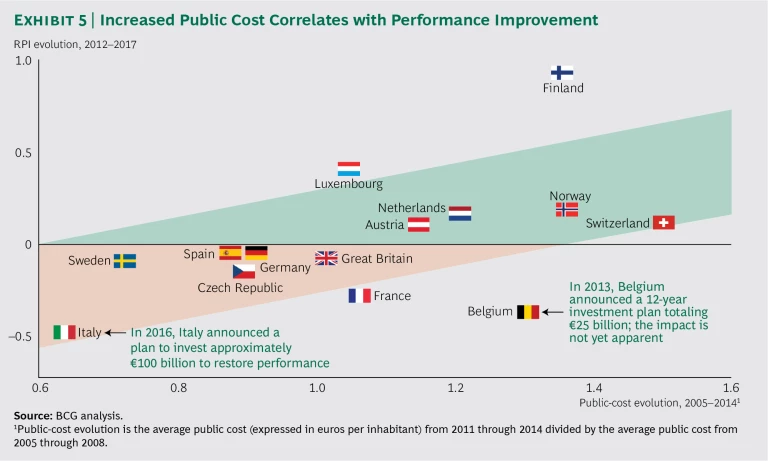
Taking advantage of the availability of historical data, we compared the evolution of public cost from 2005 through 2014 (the broadest data set available) with the evolution of the three RPI ratings. (See Exhibit 5.) To determine the public-cost evolution from 2005 through 2014, we divided the average public cost (expressed in euros per inhabitant) from 2011 through 2014 (including an adjustment for future planned investment) by the average public cost from 2005 through 2008.
We excluded the tier three countries from the analysis, because their public-funding profiles (which emphasize investments to catch up to tier one and tier two countries) and governance efficiency are too different from those of tier one and tier two countries to be comparable. We also excluded Denmark, because the country was not included in the 2012 report and two years of performance evolution are not sufficient to understand public-cost efficiency.
The analysis not only confirmed the correlation between public cost and performance, but also found that it applies over time. Countries that recently increased their public cost have been rewarded with the highest performance improvements (this is especially true for Finland). During the same period, stagnating levels of public cost in France and Great Britain, and decreasing levels in Italy and Sweden, have coincided with the incipient trend of declining performance.
Regulators and policy makers in countries experiencing the incipient trend of declining performance should consider reviewing planned investments in their systems and decide whether budgets should be increased. In the short term, these countries may need to overinvest in their systems in order to begin the long process of reversing a downward performance trend. Our findings suggest that investments to improve safety and quality of service should be the initial priority. If countries seeing the beginnings of a downward trend hold public cost at current levels, they may not be able to maintain the current high performance of their railway system.
Acknowledgments
This report and the underlying 2017 European Railway Performance Index study would not have been possible without the support of BCG’s Consumer Goods practice and Industrial Goods practice. The authors would especially like to thank Ulrik Sanders, Nicolas Boutin, Pierre de Lisle, Alexandre Prénaud, and Charlotte Saglier for their contributions in preparing and evaluating the research. The authors would also like to thank David Klein for his writing assistance, as well as other members of the editorial and production team, including Katherine Andrews, Gary Callahan, Kim Friedman, Abby Garland, and Sara Strassenreiter.
