This is an excerpt from Striking a Balance Between Well-Being and Growth: The 2018 Sustainable Economic Development Assessment .
Promoting the well-being of citizens is widely accepted as the primary goal of national policy and government action—in principle. In practice, however, decision makers face what are generally viewed as competing priorities: improving citizens’ well-being or fostering economic growth.
The 2018 Sustainable Economic Development Assessment
The 2018 Sustainable Economic Development Assessment
- Striking a Balance Between Well-Being and Growth
-
Well-Being Trends over the Past Decade
But are those two goals actually in conflict? Do efforts to improve well-being take a toll on economic growth or, to the contrary, promote it?
We have found that there is no need to choose between well-being and growth. BCG’s 2018 Sustainable Economic Development Assessment (SEDA) reveals that countries can make the overall welfare of citizens the top priority while promoting sustainable and robust economic growth.
We have found that there is no need to choose between well-being and economic growth.
SEDA , a tool that we launched in 2012, is designed to provide insight into the relative well-being of a country’s citizens and how effectively a country converts wealth, as measured by income levels, into well-being. (See “Defining and Measuring Well-Being.”)
Defining and Measuring Well-Being
Defining and Measuring Well-Being
SEDA is primarily an objective measure (combining data on outcomes, such as in health and education, with quasi-objective data, such as on the quality of infrastructure or governance, derived from surveys and expert assessments). It does not include purely subjective perception measures. Other metrics based on subjective measures—such as the ones used in the World Happiness Report—offer valuable complementary, but separate, insights. In fact, we have found a strong overall positive correlation between the scores from the World Happiness Report and SEDA scores.
SEDA is also a relative measure; it assesses how a country performs relative to either the entire universe of countries in the data set or to individual peers or groups. SEDA offers a current snapshot as well as a measure of progress over time, and it complements purely economic indicators such as GDP. (For details on the SEDA methodology and the 2018 analysis, see the Appendix at the end of the full report.)
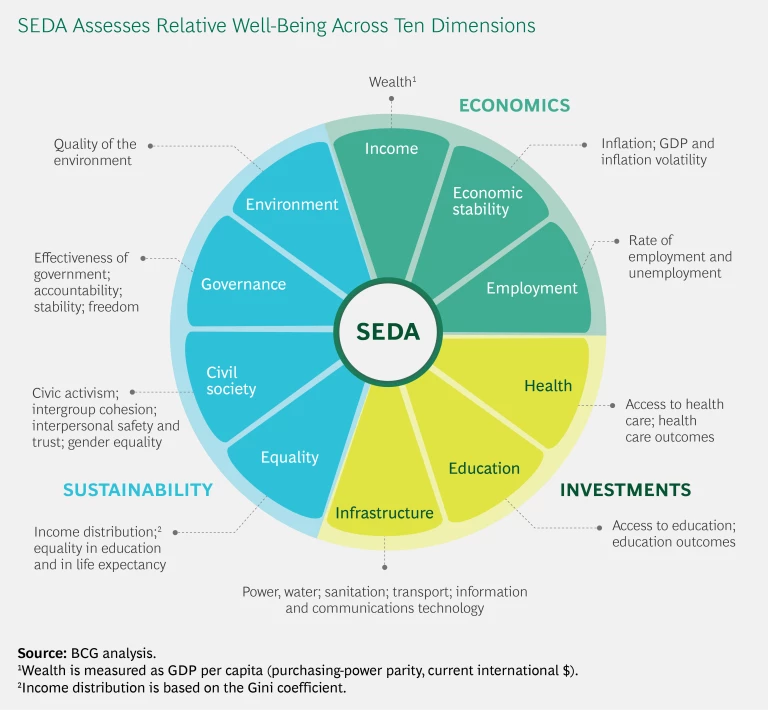
SEDA defines well-being on the basis of ten dimensions grouped into three categories. (See the exhibit.)
- Economics includes the dimensions of income, economic stability, and employment.
- Investments includes the dimensions of education, health, and infrastructure, which reflect the outcomes of policies and programs that account for the bulk of any government’s nondefense expenditures.
- Sustainability comprises the environment dimension and three that contribute to social inclusion: equality, civil society, and governance.
- SEDA Score. We aggregate the scores for the ten SEDA dimensions to provide an overall score for each country. This score can be used to compare a country with any other country or group of countries. In general, wealthier countries tend to have higher scores than less wealthy countries. SEDA’s ten dimensions also provide a framework for reviewing priorities for remedial action, since a country’s performance relative to the rest of the world or to a group of peers can highlight critical strengths and weaknesses. Armed with such insights, governments can begin to set strategies for addressing the most pressing issues.
- Change in SEDA Score. This year, we have changed the way we measure countries’ progress in well-being. With ten years of data of comparable SEDA scores, we can track the change in SEDA score over that period. We can also track changes in each dimension of the SEDA score.
- Wealth-to-Well-Being Coefficient. On the basis of their SEDA scores, we can examine how effectively countries are able to convert their wealth (as reflected in income per capita) into well-being. We do this using a measure called the wealth-to-well-being coefficient. This coefficient compares a country’s SEDA score with the score that would be expected given the country’s GNI (gross national income) per capita. The coefficient thus provides a relative indicator of how well a country has converted its wealth into the well-being of its population. Countries with a coefficient of 1.0 are generating well-being in line with what would be expected given their income levels. Countries that have a coefficient greater than 1.0 deliver higher levels of well-being than would be expected given their GNI levels, while those below 1.0 deliver lower levels of well-being than would be expected.
In the 2018 analysis, which included 152 countries and used data from 2007 through 2016, we found that countries that were better at converting wealth into well-being tended to have faster economic growth. They also tended to be more resilient—recovering more quickly from the 2008–2009 financial crisis.
Pursuing the twin objectives of growth and well-being should be the aim of long-term development strategies. This doesn’t happen on its own, though—it is the result of thoughtful policy decisions that strike the right balance. This balanced approach is relevant not just under normal circumstances but also during times of crisis. At such times, countries must resist the temptation to prioritize stimulating economic growth or reducing fiscal deficits at the expense of well-being.
This year’s analysis reveals how well-being has evolved in the years since the financial crisis. (Explore our findings in “ SEDA: An Interactive Guide .”) In addition to assessing which countries have gained or lost ground relative to others, the analysis found that on an absolute basis well-being around the world has, in general, improved in the past decade. (See Well-Being Trends over the Past Decade .)
Our analysis also provides guidance on which areas—what we call dimensions—deserve particular attention as countries aim to foster the virtuous cycle between economic growth and well-being:
- For countries that already enjoy a relatively high level of well-being, investments in education and employment can do the most to improve both well-being and economic growth.
- For countries with a relatively low level of well-being, it is not enough to focus only on areas that are key pillars of development, such as health and education. They must also improve governance, a critical foundation for sustainable economic growth, and infrastructure.
- Within infrastructure, digital connectivity has pervasive effects on all dimensions of well-being. It should be front and center for policymakers—particularly in countries with relatively low levels of connectivity.
Countries can—and should—aim to achieve the twin objectives of sustainable economic growth and improved well-being. SEDA can be a valuable tool as governments undertake this journey, shedding light on the impact of past policy decisions and informing strategies for the future.
Uncovering the Virtuous Cycle of Well-Being and Growth
Whether there is a tradeoff between efforts to enhance the standard of living for citizens and economic growth is a question central to policy debates. For this report, we set out to test a hypothesis that flies in the face of the conventional wisdom: countries that outperform peers in creating well-being for citizens enjoy more robust economic growth.
We set out to test a hypothesis that flies in the face of conventional wisdom.
To explore the relationship between well-being and growth, we cannot simply rely on measures of current well-being. A country’s wealth has a pervasive impact on many of the factors that contribute to well-being. We focus therefore on the performance of countries in converting the wealth they do have into well-being—essentially, controlling for income levels. Our proxy for this conversion performance is SEDA’s wealth-to-well-being coefficient.
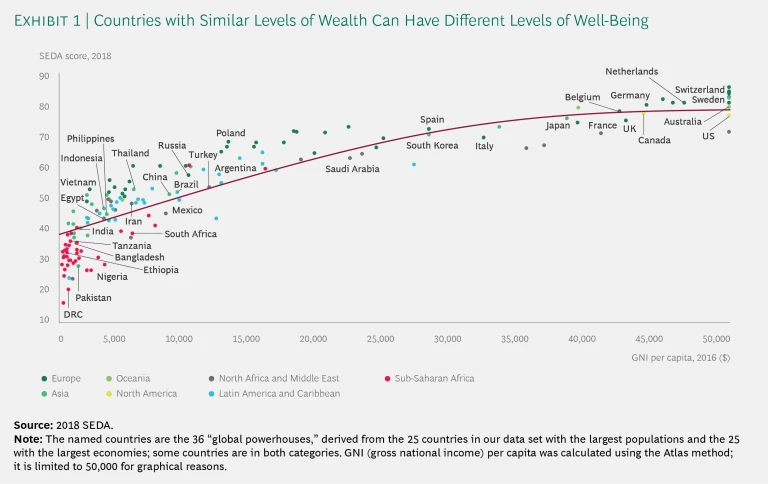
To illustrate what this measure means, it helps to plot SEDA scores against income per capita. (See Exhibit 1.) The red line represents the average relationship between the SEDA scores of 152 countries and their income per capita. An individual country’s performance in converting wealth into well-being, its wealth-to-well-being coefficient, can be measured by its position relative to that line. In Exhibit 1, we highlight a subset of countries, those that constitute the 25 biggest economies and the 25 most populous countries. Because some countries fall into both categories, we are left with a total of 36, a group we dub the “global powerhouses.” These countries account for 86% of the world’s economy (as measured by GDP) and 78% of the world’s population.
We analyzed the relationship between well-being and growth in two ways. First, we did an econometric analysis for all 152 countries of the link between a country’s initial wealth-to-well-being coefficient (represented by the average of the coefficients from 2007 through 2009) and its growth rate in the decade that followed. We found a highly significant relationship between the two—a relationship that holds even when we control for variables such as gross fixed capital formation or government expenditure. (For details on the SEDA methodology and the 2018 analysis, see the Appendix at the end of the full report .)
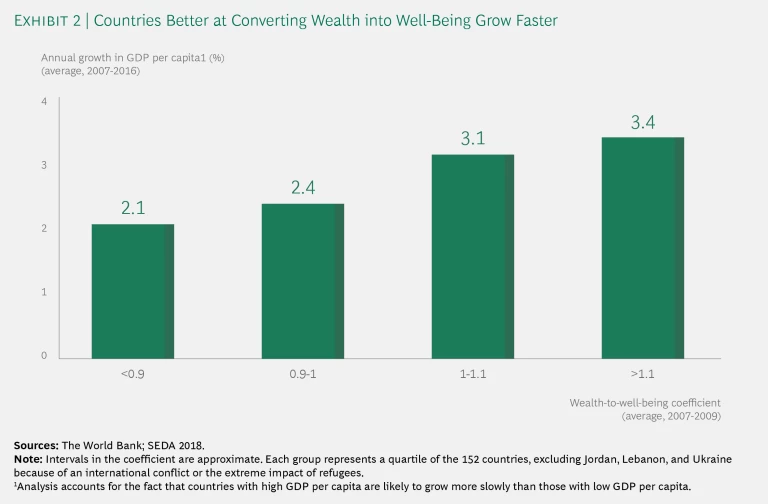
Second, we segmented all countries into four groups according to their initial coefficient and looked at the growth rate for each group over the ten-year period. We found that the higher a group’s initial coefficient, the higher its subsequent growth rate. (See Exhibit 2.)
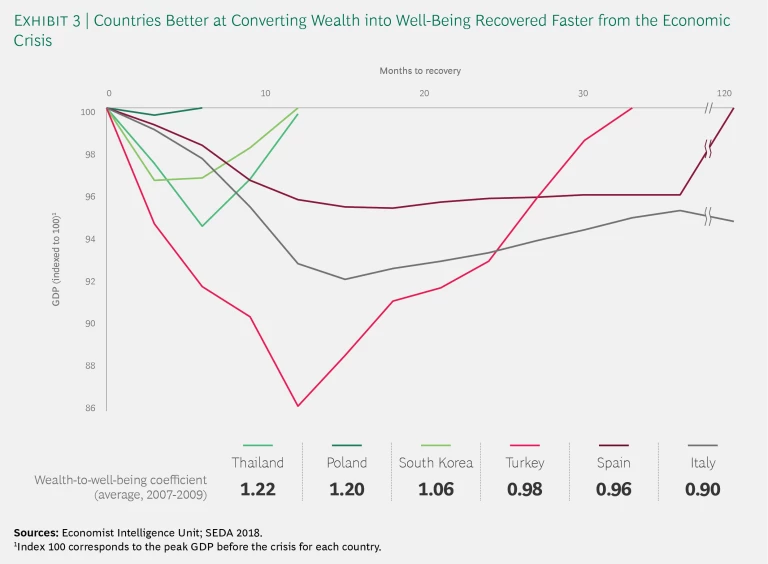
We also examined the relationship between a country’s ability to convert wealth into well-being and its resilience following the financial crisis. Among the 63 countries in our data set that suffered a recession during the crisis, those that had a higher wealth-to-well-being coefficient before the crisis tended to have smaller drops in GDP in the 2008–2009 period. This relationship was stronger once we controlled for national debt. We also found that among the 27 global powerhouses that went into recession, those with a higher coefficient took fewer months to recover to their precrisis GDP levels than countries with lower coefficients. The recovery timeline for a number of global powerhouses with a range of coefficients illustrates this link. (See Exhibit 3.)
Taken together, our findings mean that countries that focus on enhancing well-being not only raise the standard of living of their citizens but also set their country up for stronger and more resilient economic growth. Of course our analysis doesn’t answer a number of important questions, such as the extent to which austerity policies like those implemented by some countries in the aftermath of the crisis affect both well-being and growth over the long term. However, it does underscore that policies and institutions promoting well-being have wide-ranging positive effects. Policymakers do not need to choose between boosting near-term economic growth and improving the quality of life for citizens. There is in fact a virtuous cycle at work, in which gains in one lead to progress in the other.
How Can Countries Improve Well-Being?
The positive relationship between well-being and economic growth highlights a critical reality: a country’s failure to execute appropriate development strategies can take a major toll on the living standards of its population, both directly through the impact on social sectors and indirectly through reduced growth. To establish these strategies, however, governments face tough decisions about how to balance priorities and allocate limited resources. We looked at the change in SEDA scores over the past ten years—specifically, the dimensions that seem linked to the best improvements in relative performance—to glean information that can begin to inform those decisions. (The 2009–2018 SEDA scores are based on 2007–2016 data.)
When we look at the performance of our entire data set of countries over the past decade, we see that those that improved their well-being the most—those with the greatest percentage change in their SEDA score—outperformed those with weak progress in nearly every dimension. This likely stems from the fact that good governmental decision making is rarely confined to one policy area. Such effective policymaking will be critical in the future as powerful forces, most notably the rapid pace of technological change, transform societies around the globe. (See “ Governing in the Age of Disruption ,” BCG article, January 2018.)
Differences in Country Performance Across Dimensions
Does a country’s starting point determine which dimensions offer the greatest opportunity to improve well-being relative to peers? To study this, we segmented the 152 countries into three categories according to their 2009 SEDA score and divided each category into quartiles based on SEDA score improvement from 2009 through 2018. For each dimension of SEDA, we then compared how the most-improved countries (those in the top quartile in the dimension) fared against the weakest performers (those in the bottom quartile).
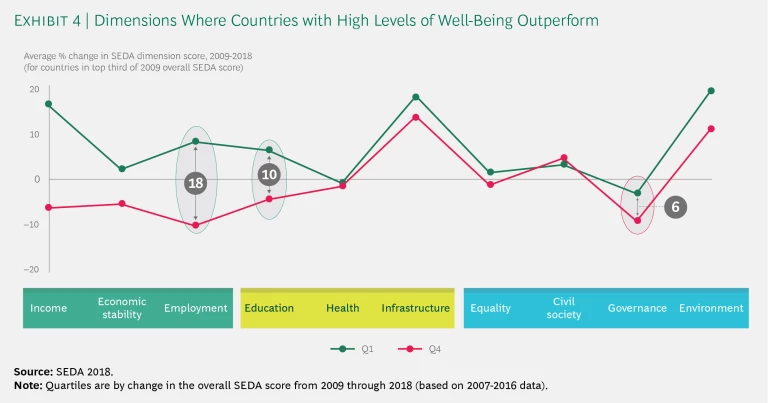
All countries in the top third of 2009 SEDA scores saw big gains in infrastructure and environment as well as a slight weakening of performance in governance, from relatively high levels, stemming from declines in indicators for political stability and absence of violence and terrorism. What distinguishes those that made the most progress from those that made the least, however, are the employment and education dimensions. (See Exhibit 4.)
We find evidence of this pattern among individual countries in the top third of 2009 SEDA scores. Canada saw steady improvement in its SEDA score over the past decade thanks in part to improvements in education. The country is now on par with leaders in science and math PISA scores such as Singapore, South Korea, and Japan. Meanwhile, the Czech Republic, also in the top third of 2009 SEDA scores, saw both a decrease in unemployment and an increase in employment over the past ten years.
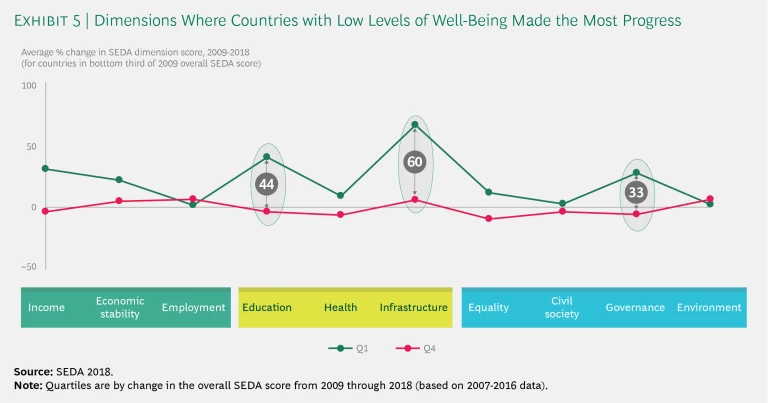
Among countries in the bottom third of 2009 SEDA scores, those that posted the biggest gains by 2018 tended to outperform those showing the least progress in three areas: education, infrastructure, and governance. (See Exhibit 5.)
For example, India, which started with a low SEDA score and was in the top quartile in terms of progress, has made major infrastructure improvements. The country has set an ambitious infrastructure agenda at the city, state, and national level, making major investments in metro rail lines, ports, roads, and airports. For its part, Rwanda has made significant progress in governance. The country has attacked corruption and strengthened property rights through moves such as the establishment of a land ownership registry.
Takeaways for Government and Other Decision Makers
Our analysis is not meant to imply that there is a formula for improving well-being—even among countries at the same stage of well-being and development. In fact, improving well-being depends on progress in all dimensions. However, the above analysis shines a spotlight on the dimensions where strong performance distinguished the countries that made the most progress. Those dimensions are likely to be key constraints or bottlenecks at various stages of a country’s development. To put it another way: if several countries are making good progress in one dimension (say, health), but only a few are able to achieve significant gains in another dimension (say, governance), it probably means that there are larger constraints in achieving sustainable success in the latter.
Improving well-being depends on progress in all dimensions.
With that in mind, we offer some insights for government officials, as well as private-sector and civil-society leaders:
- Countries should be wary of initiatives that may come at the expense of improvements in areas such as education and infrastructure. Besides potentially diminishing well-being, initiatives such as subsidizing industry, investing heavily in defense, or over-prioritizing debt reduction may hamper the country’s long-term growth rate. At the same time, countries should avoid actions that favor quick decision making over the health of the country’s system of governance. As our analysis shows, strong governance is an important foundation for long-term economic growth.
- For countries that already enjoy a relatively high level of well-being, our analysis points to the importance of prioritizing education and employment. Progress in these mutually reinforcing areas can better prepare citizens—and therefore society as a whole—for the challenges presented by globalization and relentless technological change.
- Countries with a relatively low level of well-being should bear in mind that it is not enough to focus only on critical areas such as health and education. These countries will reap wide-ranging benefits if they also drive a step change improvement in governance by building sound institutions. At the same time, they should promote the development of their country’s infrastructure.
- Within infrastructure, countries, particularly those with relatively low levels of well-being, should make digital infrastructure a high priority. Such an effort has tended to work best as a collaboration between government and the private sector.
The Role of Well-Being in the Economy
Sustainable development is every country’s goal, and improving the well-being of citizens is central to that pursuit. A country’s wealth is a major factor in determining its well-being. However, as the design of SEDA scores reflects, creating well-being requires a multidimensional approach, one that goes beyond efforts to increase wealth.
The ability to convert wealth into well-being varies widely among countries, reflecting different societal choices, policy decisions, and capacity to execute them. However, as this report makes clear, good performance offers a double reward: countries that outperform their peers in converting wealth into well-being also tend to grow faster. This finding is consistent with recent research showing that inclusive societies tend to grow in a more sustained way over the long term.
What should countries do? It depend on their situation. There are no silver bullets or standard blueprints. What we do know, however, is that the lack of progress in specific dimensions can hamper overall gains in well-being. Further, the dimensions with the best potential to boost well-being change with each new stage in a country’s development.
Over the past six years, SEDA has been an important tool for governments and international organizations as they review strategic priorities. It has been used to assess a country’s strengths and weaknesses, identify barriers to development, and set priorities and a national strategy for sustainable growth. It has also been a valuable mechanism for tracking the progress and managing the implementation of those strategies.
Focusing on the key success factors for converting wealth into well-being is not just a nice-to-have. Countries that fail to prioritize them will squander valuable opportunities for sustained progress in economic development—and find themselves gradually left behind by peers.

