From the perspective of shareholder value creation, the oil and gas industry appears to have much to support it. The discovery and development of major new reserves have substantially increased the industry’s access to resources in the past decade. Companies’ balance sheets show billions of dollars available to fund investment. The industry’s production costs have generally fallen, driven by technological innovation and the adoption of more efficient manufacturing processes. And while demand for hydrocarbons as a percentage of overall primary-energy demand is forecast to fall in the decades ahead, the volumes required to meet demand will still be huge.
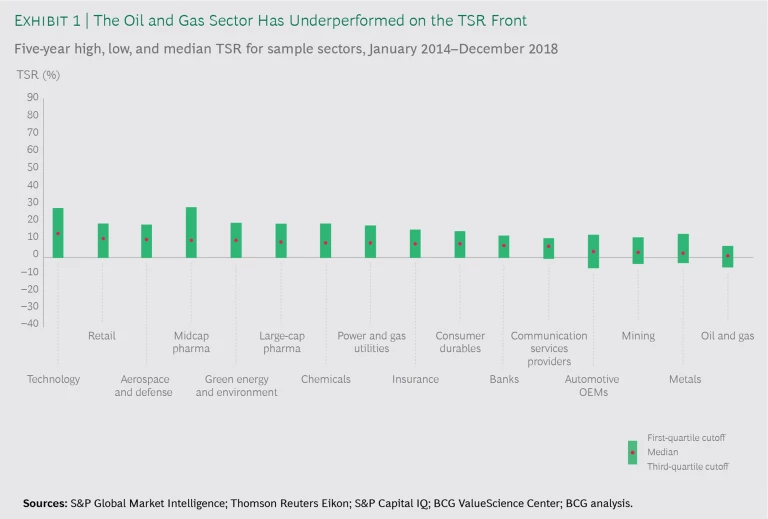
But investors have been largely underwhelmed. Relative to other industries, oil and gas has been a decided laggard on the total shareholder return (TSR) front. (See “The Components of TSR.”)
The Components of TSR
The Components of TSR
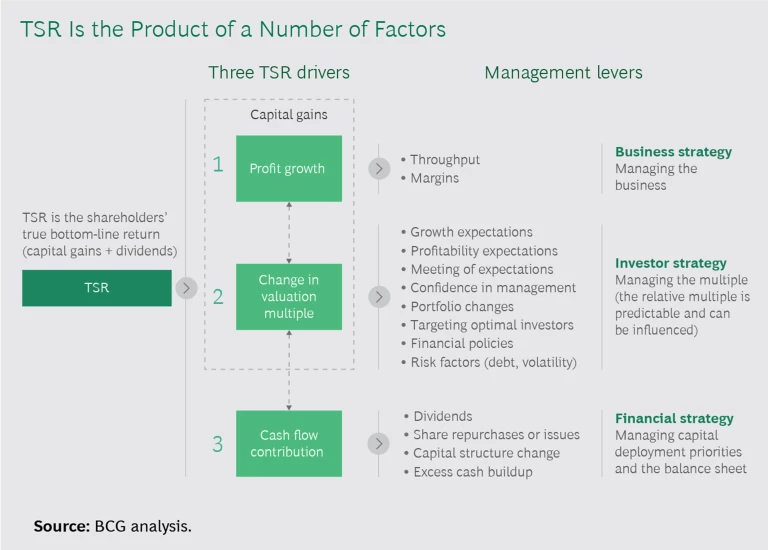
Total shareholder return is measured as the return from a stock investment with the assumption that all dividends are reinvested in the stock. TSR is a product of multiple factors. (See the exhibit below.) Our approach deconstructs TSR into a number of underlying drivers. We use a combination of revenue growth and margin change to assess changes in fundamental value. We then factor in the change in a company’s valuation multiple to determine the impact of investor expectations. Together, these two factors determine the change in a company’s market capitalization and investors’ capital gain (or loss). Finally, we track the distribution of free cash flow to investors and debt holders in the form of dividends, share repurchases, and repayments of debt, and we determine the contribution of free cash flow payouts to a company’s TSR.
Indeed, among the 33 industries BCG tracks, oil and gas has the worst median five-year TSR. (See Exhibit 1.) And the industry’s share of the S&P 500 Index, which is based on market capitalization, is shrinking.
What accounts for the industry’s poor showing among investors? And what must these companies do to put themselves back on the right path?
A Mix of Challenges
Investors’ wariness toward oil and gas companies is largely attributable to five factors, each of which heightens the perceived risk to the companies’ business performance and TSR. The first is oil price uncertainty. Although prices have bounced back from their extreme lows of the past few years, there is little confidence among investors that prices have additional potential for significant appreciation. Such worries have been exacerbated by concerns about both supply and demand. On the supply side, rising US production of unconventional energy sources has upended traditional assumptions associated with oil prices and OPEC market management, dampening investors’ expectations regarding oil’s long-term price upside. In terms of demand, investors fret about the possible effects of worldwide recession and intensifying trade wars, as well as the effects of an evolving energy backdrop on the long-term demand for hydrocarbons.
The second factor that gives investors pause is the ongoing transition of the global energy system. A secular shift from hydrocarbons is possibly in motion, and this shift could have major implications for the industry’s profitability and business model. (Furthermore, oil and gas investors have noted, in conjunction, the rising prevalence of government policies designed to speed the adoption of green energy, coupled with falling costs for associated technologies.) To be sure, most observers expect that the demand for hydrocarbons will remain robust for the foreseeable future. But investors don’t have to look far to find reasons to worry about the longer term, and the industry has yet to formulate an effective and compelling response to assuage their concerns.
The third factor that worries investors is growing debate about oil and gas companies’ “social license to operate.” Although growing numbers of companies are establishing emissions targets and increasing the transparency of the environmental effects of their operations—consistent with guidelines established by the Task Force on Climate-Related Financial Disclosures and with pressures imposed by practitioners of so-called environmental, social, and governance (ESG) investing—many investors are worried that the steps don’t go far enough and that the industry still faces a major reckoning.
The fourth factor causing angst among investors is the ever-present threat of geopolitical unrest. Trends and developments, including the backlash against globalization in parts of Europe and the US, the declining influence of long-established international institutions and partnerships, and trade tensions between the US and China have created growing uncertainty about long-term economic growth and global trade, as well as the implications for oil and gas companies, which traditionally have proved themselves quite adept at navigating such challenges.
The final factor dampening investors’ enthusiasm for the sector is lingering mistrust of oil company management and doubts about the companies’ ability to steward investment dollars and manage costs in ways that maximize shareholder returns. The lack of capital discipline and cost control witnessed during the high-oil-price period that prevailed prior to 2014—and the consequent erosion of returns—badly damaged investor confidence in these companies. Subsequent claims of mended ways have not fully restored the industry’s credibility.
Doubts about management’s intentions and ability to deliver have been exacerbated by the adherence by some oil and gas companies, particularly exploration and production (E&P) players, to incentivize structures that prioritize volumetric growth over shareholder returns. Investors have also frowned on the industry’s tendency to benchmark its TSR performance against those of narrow peer groups rather than sectors and companies that have delivered the highest returns overall.
Over the past few years, oil-and-gas-company executives have sought to address the credibility deficit by reordering their capital allocation priorities. They have placed greater emphasis on cost-cutting programs, portfolio quality upgrades, debt reduction, payout increases, and restoration of profitability. Nevertheless, stubbornly low TSRs suggest that investors remain wary of a return to profligacy.
The combination of worries about external factors and doubts about the sector’s stewardship of capital has created a vicious circle: the more uncertain the environment, the closer investors’ scrutiny of companies’ capital allocation decisions and the greater investors’ demand for immediate evidence of investment returns. This translates into pressure on companies to emphasize short-term shareholder payouts and returns rather than the types of reinvestment programs, project portfolios, and M&A that are essential for portfolio replenishment and the generation of long-term growth in revenues and profits.
Overcoming the investor trust deficit is, therefore, an imperative for oil and gas companies. If they can accomplish this, they will be assured sufficient capital and regain the flexibility to make capital allocation decisions. Unfortunately, this process will take time.
Over the past few years, oil-and-gas-company executives have sought to address the credibility deficit by reordering their capital allocation priorities.
Divergent Performance Among Subsectors
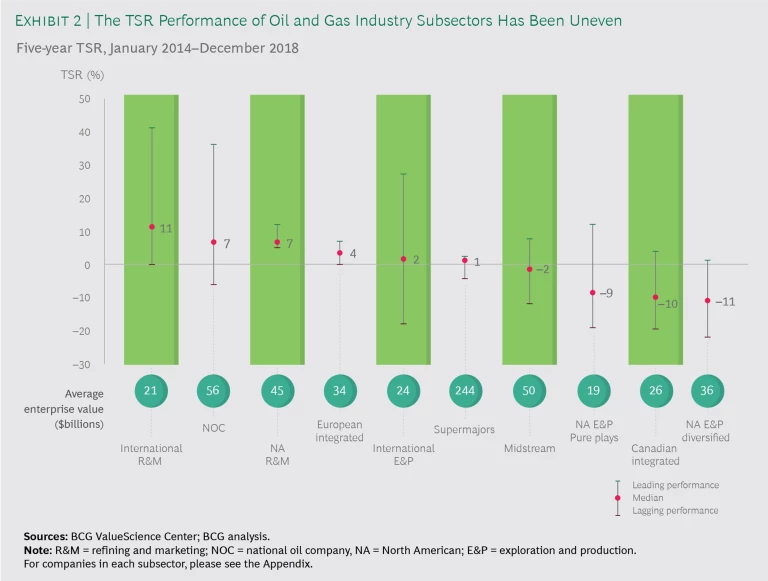
Although, collectively, oil and gas companies have struggled, the TSR performance of the industry’s subsectors has been far from uniform. (See Exhibit 2.) A review of median five-year TSR (that is, the median company’s TSR from the beginning of 2014 through the end of 2018) viewed through the lenses of position in the value chain, company size, and regional exposure or emphasis, reveals a number of noteworthy results. (See “The Companies in Our Sample.”)
Companies in Our Sample
Companies in Our Sample
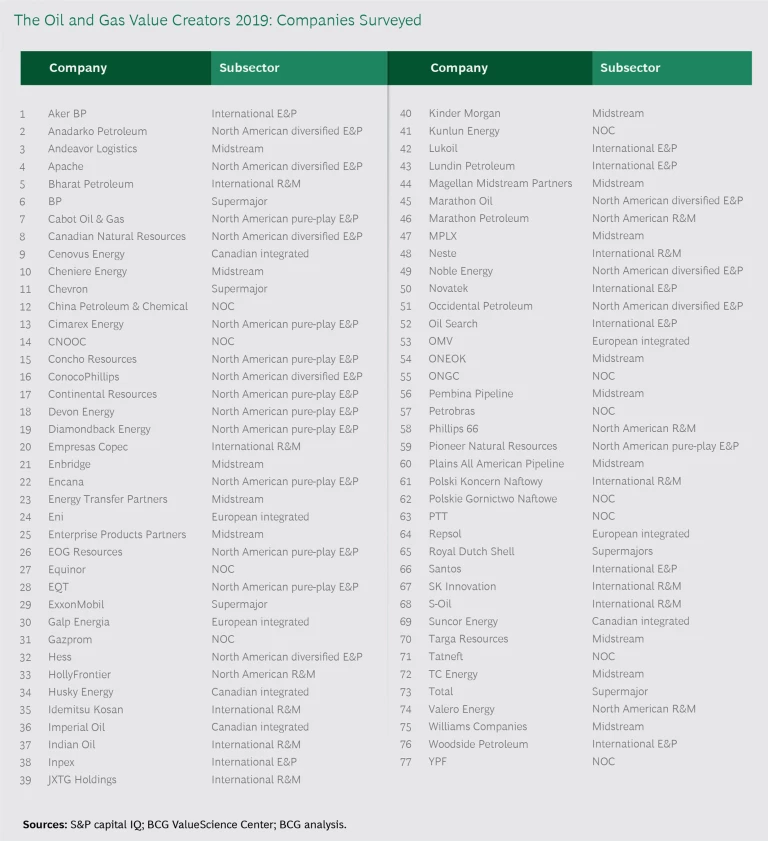
For our 2019 report on value creators in the oil and gas industry, we selected 77 companies from ten peer groups including, for the first time, midstream players. We excluded oilfield services companies.
Each company in the sample was valued at more than $7 billion, had a free float of at least 20%, and had existed since before 2015. The companies we studied had a combined enterprise value of $3.9 trillion in 2018. Of this, supermajors accounted for approximately 32%; national oil companies, exploration and production players, and midstream companies, each about 17%; refining and marketing (R&M) companies, roughly 10%; and European integrated players, about 6%.
Our study looked at TSR performance over the full ten-year, 2009 through 2018, price cycle. Furthermore, we considered three- and five-year views that provided different lenses on how companies’ performance evolved during and after the oil price downturn. With these intermediate time frames, we were able to look at a larger, more representative industry sample: many of the largest R&M players have emerged since 2010 through corporate breakups, especially in North America.
Refining and Marketing Companies. R&M companies managed to generate respectable TSRs and led the list of oil and gas subsectors over the five-year period. While these businesses—like nearly all other oil and gas businesses—had to deal with falling revenues, they managed to generate relatively strong margin expansion, which, in turn, powered earnings growth superior to other subsectors.
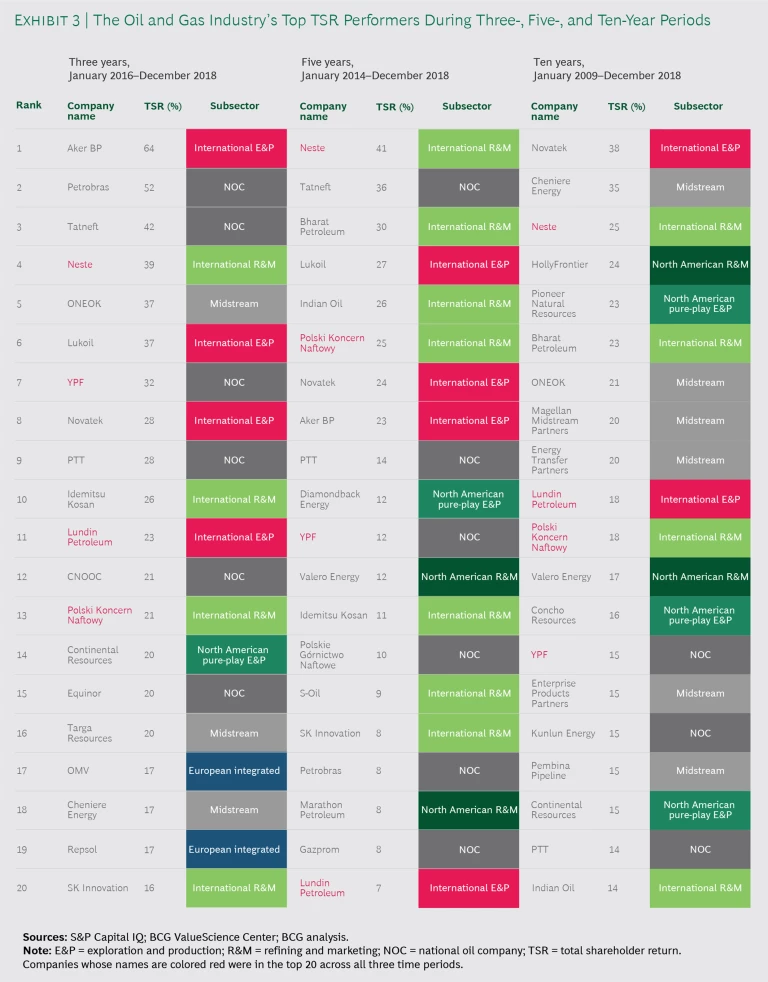
International R&M players, which showed particular strength, generally benefited from their access to emerging markets’ growing demand for fuel. (See Exhibit 3.) For their part, R&M players that focused on North America reaped considerable advantage from their access to relatively inexpensive crude: pricing for crude from both Canada and the US was at times heavily discounted owing to transportation bottlenecks and limited export infrastructure, as well as US restrictions on oil exports through 2015. The R&M subsector’s generally favorable earnings growth environment allowed many players to execute payout and debt reduction strategies, further benefiting their relative TSR performance.
Globally, R&M companies benefited from continued rising demand for oil products: demand climbed about 8% over the five years, and global refining utilization rose strongly, reaching 83.5% in 2018. Fortunes varied, however. R&M players based in oil-exporting countries that support their refining industries with oil revenues—typically, government-owned national oil companies (NOCs)—saw their refining-utilization rates fall precipitously as weakness in oil prices prevailed through much of the period. This decrease in refining-utilization rates for R&M companies in these countries ultimately worked to the benefit of US and other Atlantic Basin R&M players, however: their revenues rose as they boosted exports of refined products to meet the resulting supply shortfall abroad. In many cases, the increase in sales helped compensate for soft demand in the home markets of these companies.
Refining margins are likely to rise a bit in 2020 as refiners scramble to meet the International Maritime Organization’s tightening standards for sulfur content in bunker fuel. Globally, however, spare refining capacity is expected to continue to increase through 2025, making it harder for these R&M companies to continue to grow their revenues.
Exploration and Production Companies. In contrast to their R&M counterparts, North America–exposed E&P players performed poorly over the five years, as well as over the three- and ten-year periods, with pure plays doing slightly better than diversified players. For companies that were able to achieve profit growth in a difficult oil price environment, a contraction of valuation multiples reversed nearly all potential TSR gains, reflecting the continued lack of investor confidence in the companies and their future earnings. This lack of confidence was fanned in particular in 2018, when a number of companies abandoned several years of capital-discipline rigor in the face of rising oil prices. Renewed concerns over these companies’ capital discipline stand to increase their already high financing costs—hardly a welcome development as these businesses seek to reestablish a winning trajectory, one that is not solely dependent on rallies in crude oil prices.
For diversified North America–exposed E&P companies, negative earnings and valuation multiple contractions were the culprits behind a median TSR of –11% over the five-year period. Boosts to cash returns to shareholders were the only positive drivers of TSR for these companies, and, for most of them, it was challenging to adhere to these programs while they wrestled with a continued free-cash-flow (FCF) crunch.
Among North America–exposed E&P players, ConocoPhillips stands out for its ability to generate relatively strong TSR in a difficult environment. Indeed, the company is one of only two in this cohort to have a positive TSR over the three-, five-, and ten-year periods. Central to its performance is the company’s stronger commitment to dividends—the company boasts dividend yields averaging 3.6% over the past ten years—and share buybacks than its peers. Investors have responded positively to the company’s ongoing divestment of noncore assets and reduction of its operating expenses. ConocoPhillips lowered its average per-barrel operating expenses by 15% (compared with its peers’ 12% reduction) from the beginning of 2016 through the end of 2018, yielding savings that helped drive a 26% increase in net margin over the same period.
ConocoPhillips’s performance suggests an evolution in TSR drivers in the E&P subsector. Investor payouts are playing an increasingly important role while earnings growth, the traditional lead factor in value creation, is becoming less critical. But E&P valuation multiples remain highly sensitive to earnings projections, suggesting that companies will need to strike a prudent balance between the two factors.
Supermajors. TSRs for the supermajors—BP, Chevron, ExxonMobil, Royal Dutch Shell, and Total—have improved modestly in recent years. The companies’ cost-cutting initiatives and portfolio repositioning have provided them a degree of insulation from challenging market conditions. Their global footprint, diversified operations, and sheer size have helped as well. But ultimately, these advantages have been no match for the challenges imposed by decreases in crude prices.
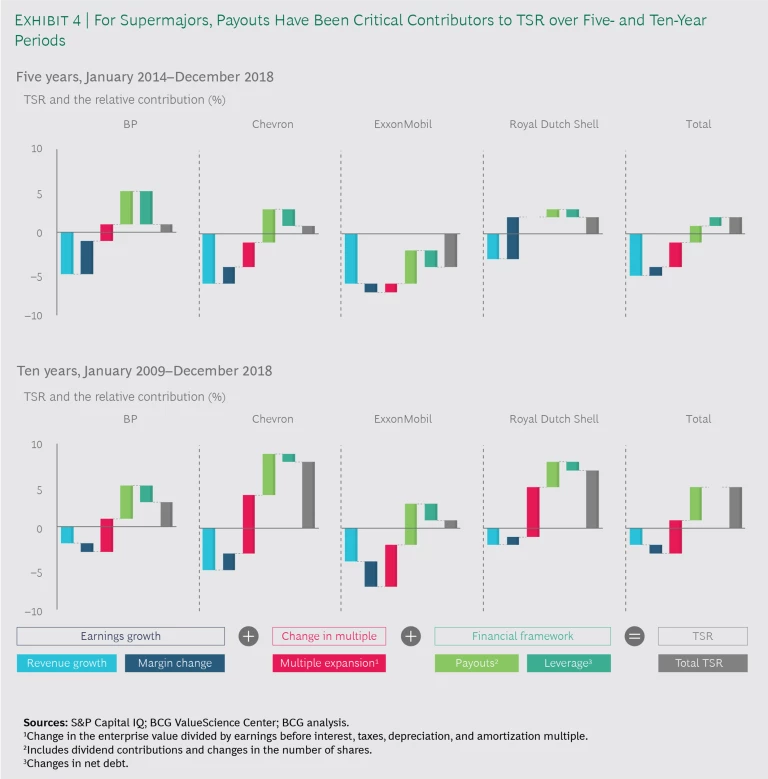
In examining the supermajors’ TSR performance over various time periods, we noted several defining features. The first is the inability of any of the companies to distinguish itself significantly over longer time horizons. During the ten-year period, for example, as earnings growth languished for all, players attempted to support their TSRs by emphasizing margin growth, multiple expansion, and payouts to investors, exploiting the three approaches in different ways, to different degrees, and with different levels of success. The results for Chevron and Royal Dutch Shell were the best overall, but neither company achieved breakout performance.
The TSR performance range widened a bit over the three-year period, with results determined largely by the companies’ relative exposure to the improvements in the oil price environment and by strategic choices made in response to the 2014 plunge in prices. The results for this period suggest that there is indeed scope for the supermajors to differentiate themselves in terms of TSR, provided they make the right capital allocation decisions.
The second defining feature of these companies’ TSR performance is the key role shareholder payouts have played, particularly as earnings have contracted. (See Exhibit 4.) Over the past ten years, the companies collectively spent an average of $56 billion annually on dividends and share buybacks. Royal Dutch Shell, Chevron, and ExxonMobil were particularly aggressive on the dividend front, increasing dividends by a combined 60%. The critical role of payouts in supporting TSRs is unlikely to diminish, particularly given the sustained challenges these companies face in achieving earnings growth.
The third defining feature is the importance of margin growth, which, like shareholder payouts, has provided key support to TSRs in the face of falling revenues. Companies have undertaken a range of portfolio moves to achieve this. Royal Dutch Shell, for example, boosted its FCF by consolidating a number of FCF-generating positions following the company’s acquisition of BG Group. Shell also undertook a large-scale divestiture program that removed less profitable assets from its portfolio.
Chevron, meanwhile, boosted cash flow through the long-awaited commissioning of its Australia liquefied natural gas (LNG) project portfolio and complemented this with increased capital discipline elsewhere in its project portfolio and strong commitment to its dividend growth program, which supported multiple expansion. BP benefited from strong sales growth, predominantly through production increases that stemmed from acquisitions. The company also benefited from the strong performance of its downstream assets and its successful cost reduction efforts targeting its upstream holdings.
Portfolio construction stands to be a major differentiator among these businesses as they attempt to position themselves optimally for future growth. Like the rest of the oil and gas industry, supermajors are generally offloading their noncore assets to focus on assets they deem likely to generate higher returns and growth. US supermajors are particularly bullish on the Permian Basin; BP and Royal Dutch Shell are also positioning themselves to benefit from the Permian’s sizable resource base. Critical to the success of each of these companies will be the ability to generate better long-term returns and profit growth than the smaller E&Ps have been able to consistently deliver with their holdings of unconventional resources.
A similar story will play out as the supermajors boost their investments in other asset types: the ability to pick the right assets—those with superior investment and cash-flow profiles—will matter and will be an important differentiator for generating sales growth and improving margins.
Beyond portfolio construction, the ways that supermajors manage their assets will be major factors in determining their business and ultimately TSR performance. Maximizing operational efficiencies and exercising rigorous capital discipline will help them squeeze every dollar from what they own, expand their margin growth to the fullest, and further differentiate themselves from their peers.
Emerging investments in new sources of energy also stand to be increasingly important. Several Europe-based players, in particular, are ramping up their exposure—albeit from a small base—to renewables, their investments distributed along the length of the value chain, including positions in carbon capture and storage, solar and wind generation, batteries, and electric-vehicle-charging networks. As operations scale up, the ability of these investments to drive supermajors’ earnings growth, shape earnings expectations and valuation multiples, and, above all, support shareholder payouts will be a differentiator among portfolios and TSRs.
Emerging investments in new sources of energy also stand to be increasingly important.
National Oil Companies. Our study focused on a very precise set of NOCs: publicly listed companies with a free float of at least 20%, excluding many large NOCs. Most of these companies fell into two categories:
- A host of Russian and a few Latin American NOCs such as Argentina’s YPF and Brazil’s Petrobras
- International resource seekers—NOCs with domestic resource bases that are either insufficient to cover domestic demand or are rapidly maturing—that compete internationally to extend their access to resources, including China’s CNOOC and CNPC, India’s ONGC, Norway’s Equinor (formerly Statoil), and Thailand’s PTT
The NOCs included in our study posted strong TSRs relative to other subsectors over both the three-year period (NOCs were the top-performing subsector) and the five-year period (NOCs were the second-best-performing subsector). Like companies in other oil and gas subsectors, these companies responded to the plunge in commodity prices by reducing operational expenses and capital expenditures. One difference between these companies and those of other subsectors (for example, supermajors), though, is that these businesses were quicker to increase capital spending over the past two or three years.
In our analysis of the TSR performance of the NOCs in our study, we found that profit growth was the single most significant driver over the five- and ten-year periods. This reflects the companies’ heavy emphasis on achieving growth in production volume and earnings through acquisitions and, frequently, international expansion. Shareholder payouts and valuation multiples—key drivers of TSR for the supermajors—were of secondary importance.
Another difference between NOCs and supermajors, in terms of driving TSR, is that listed NOCs’ balance sheets were smaller, leaving the companies more vulnerable to oil price volatility. (NOCs that used debt financing to fund international M&A were bottom-tier performers over both the three- and five-year periods.) There are, however, lessons NOCs could learn from the supermajors regarding, for example, the importance of optimized operations to TSR. Specifically, some NOCs will likely have to place increasing emphasis on operational efficiency as a means of driving margin expansion as their growth trajectories level off.
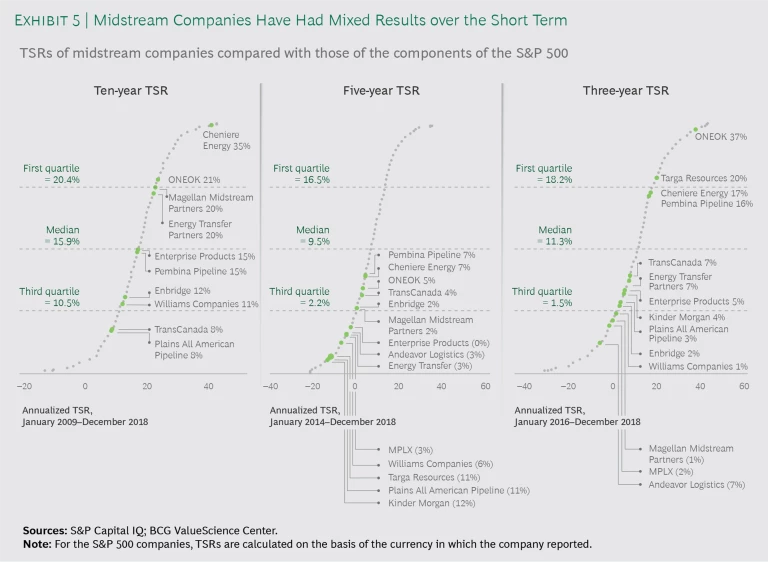
Midstream Companies. A newly added subsector in this year’s report comprises midstream companies, which provide processing, transportation, and storage of oil, natural gas, and natural gas liquids through pipelines and terminals. These businesses had generally strong TSR performance for the ten-year period, but the results of the five-year span were disappointing. The group’s three-year TSR results were mixed: some companies managed to produce strong results, but many companies continued to underperform. (See Exhibit 5)
Although the TSRs of many players over the three and five years were disappointing, the companies demonstrated strong revenue growth through those periods. This reflects the companies’ aggressive infrastructure build-out in response to changes in supply and demand.
Midstream companies, especially those operating in North America, have experienced significant changes in the profitability of different parts of the value chain. Companies with a strong presence in fractionation and gas liquefaction have enjoyed relatively strong results, especially during the past three years. These companies expanded their capital investments at a steady rate over the past ten years and are finally starting to reap the rewards. Their operating profits are beginning to climb over the previous year or two as more of their investments become fully operational and are being leveraged by the upstream and downstream sectors.
Two companies of this subsector are worth highlighting. Oklahoma-based ONEOK was a top performer compared with the broad oil and gas universe over the three- and ten-year periods. It achieved success through different tactics and strategies. Through the past ten years, it increased its dividends as much or more than any of its peers. Over the past five years, it decreased its debt while most of its peers were taking on additional leverage. Finally, the company has built a project portfolio whose profit growth for the past three years exceeds the group average.
Houston-based Cheniere Energy—a major US producer of LNG, which is relatively extraordinary compared with most midstream players—was a clear standout over the ten-year time frame and provides an example of how industry shifts can play a big part in deciding winners and losers. As the US shifted from possibly importing LNG to exporting it, Cheniere was able to turn what was at first a potentially catastrophic challenge to the company’s business into a major growth opportunity in a burgeoning industry. This high degree of adaptability is a major reason for the company’s very strong TSR performance for the ten-year period and its solid results for the three-year period relative to the broad oil and gas sector.
It should also be noted that ONEOK and Cheniere were among the leaders of the midstream subsector for the five-year period, a period of general underperformance by the group.
Rebuilding Investor Trust
There is no quick way to rebuild investors’ confidence in the oil and gas sector. Restoring trust is a long-term process contingent on companies across the entire sector consistently delivering against targets in the face of a host of developing challenges and a cyclical price environment. The sector will also need to develop new narratives for investors and other stakeholders, narratives that help secure the companies’ long-term social license to operate.
Regaining shareholders’ trust, though, starts with companies delivering on the levers most critical to industry TSR: earnings growth, multiple expansion, and shareholder payouts. Companies’ business, investor, and financial strategies should be aligned and oriented toward common goals to ensure maximum transparency and accountability. Top performers will keep their sights trained on maintaining capital discipline, maximizing FCF, diligently managing the portfolio, aggressively embracing digital technologies, appropriately benchmarking TSR performance, ensuring the right investor mix, and determining the optimal balance between dividends and buybacks in shareholder payouts.
Regaining shareholders’ trust starts with companies delivering on the levers most critical to industry TSR: earnings growth, multiple expansion, and shareholder payouts.
Maintaining Capital Discipline. Oil and gas companies will need to demonstrate capital discipline across oil price cycles in order to restore investors’ confidence in management and the industry’s reputation as a responsible steward of investor capital. Capital discipline will be essential to maintaining attractive payouts to investors. Several supermajors have pledged to boost payouts materially in the 2020s; for them, especially, maintaining capital discipline will be vital, barring a significant increase in oil prices. Capital discipline also underpins other variables—including credit ratings and return on capital employed—that support supermajors’ multiples. For these businesses, a tight rein on their use of capital is a must.
Maximizing Free Cash Flow. Investors view oil and gas companies’ ability to generate satisfactory levels of FCF as a critical investment screen, even in an environment of lower oil prices. To meet investors’ expectations, companies will need to pick their investments wisely. And they must be prepared to jettison investments that fall short of targets.
Investors are placing particular demands on upstream companies. The supermajors are being rewarded for portfolios with specific characteristics—for example, emphasis on particular assets or regions. They must be conscious of and able to explain how different individual holdings and positions in various business segments fare in terms of reaching FCF and TSR targets. E&P players face a specific set of business challenges and, hence, investor expectations. Investors will be seeking fully funded business plans, as well as the ability to generate growth through existing FCF.
In the initial stages of investment, investors will likely hold companies’ investments in alternate sources of energy to lower standards with regard to FCF generation. But companies will still need to be able to show how such investments fit into their overall value proposition. One way to do this could be to position these investments as low-risk, annuity-like cash flow streams that balance the high-risk parts of the portfolio. Another way could be, for example, to position downstream investments—such as investments in biofuel—as investments that deliver incremental value from the companies’ core activities.
Diligently Managing the Portfolio. Tight portfolio management will be necessary for maximizing returns and ensuring portfolio longevity. M&A will be an important tool to exploit for amassing the right assets. It could be especially worthwhile to consider in today’s environment, when many potential counterparties are looking to shed noncore assets through divestment. Valuations in some subsectors—notably E&P—are also low, creating what is effectively a buyer’s market. (Although M&A activity in E&P has rebounded from a ten-year low in 2016, when there was $118 billion in deals, it remains below precrisis levels.)
Tight portfolio management will be necessary for maximizing returns and ensuring portfolio longevity.
Companies should note, though, that the M&A market is currently, on balance, sluggish. Furthermore, investors have not consistently rewarded acquiring firms of late. Witness, for example, the slide in Occidental Petroleum’s stock price following the company’s acquisition of Anadarko, compared with the rise in Chevron’s share price when the company walked away from its contemplated purchase of that company.
Assuming, however, that valuations in certain segments remain relatively low in the medium term, large companies will likely return aggressively to the M&A arena. But they must be certain that any contemplated moves will indeed create value. There are few perfect fits.
Aggressively Embracing Digital Technologies. Early adoption and skillful use of digital technologies now and later, when these technologies stand to be increasingly important differentiators, can help oil and gas companies on a number of fronts. Digital tools can, for instance, enable meaningful reductions in maintenance and other operating costs. Indeed, industry competition practically demands this: since the downturn, companies collectively have made material strides in reducing operational expenditures across the value chain. For example, personnel needed to produce a barrel of oil in the US has been reduced by 60%. This cost-cutting zeal and prowess will likely continue. Digital tools also help ensure that the cost cuts are lasting. Some E&P-related cuts—including, for example, reductions in chemical injection, maintenance, and well tenders—can deliver meaningful savings. But only once. Squeezing oilfield services partners for rate reductions can yield similar, finite effects. Many digitally driven savings are, in contrast, sustainable.
Increasingly, the aim of digital technologies is to drive top-line growth by helping companies strengthen and expand their core business, develop new markets, create new businesses, and become more customer centric. E&P players, for example, are using these technologies to perform their core tasks more effectively. Fuel retailers are using them to create new trading capabilities and mobility- and customer-focused businesses.
Appropriately Benchmarking TSR Performance. Given the sector’s broad underperformance on the TSR front, oil and gas companies should not content themselves with comparisons against the already-depressed results of their peers. Rather, they should compare themselves with a broader universe of companies, including the overall market and, in some cases, high performers from other sectors. EOG Resources, for example, benchmarks itself against the universe of S&P 500 companies rather than a sector-specific set of peers. Other oil and gas players should follow its lead.
Ensuring the Right Investor Mix. Each company must make sure that it has investors whose focus and goals—for example, value, growth, or growth and income—are consistent with its strategies and capabilities. This is critical for oil and gas players, especially in the current environment. One particular trend worth noting: the investor base for most oil and gas subsectors has shifted, and continues to shift, from the pursuit of growth. Supermajors, for example, saw roughly 10% of their investor base shift from a growth orientation to a value- or income-focused orientation over the past decade. (There are exceptions to this rule. The midstream and North American pure-play E&P subsectors have maintained their steady shares of growth-oriented investors. Roughly 60% of the North American pure-play E&P subsector’s base, for example, remains “growth” or “growth at a reasonable price” investors.)
Each company must make sure that it has investors whose focus and goals—for example, value, growth, or growth and income—are consistent with its strategies and capabilities. This is critical for oil and gas players, especially in the current environment.
Each of these investor types has its own preferences regarding the size, management style, and other attributes of companies that represent potential investments. Oil and gas companies should identify which of these types is its “natural” investor base and provide a clear, compelling argument that can attract and win the investors they want. Accurate, transparent messaging is essential for establishing and maintaining trust. If management is bullish on new markets, for example, it should not want to attract income investors who are seeking primarily dividend payouts and a narrowly focused capital-spending program.
All oil and gas companies must also make the necessary adjustments to address the concerns of ESG investors, whose influence on the sector’s share prices stands to become increasingly powerful. In practical terms, this means finding ways to make their businesses greener and, simultaneously, further enhancing the transparency of their operations’ environmental impact.
Determining the Optimal Balance Between Dividends and Buybacks in Shareholder Payouts. If the decision is made to return money to shareholders, the company should consider the merits of dividends versus buybacks, especially with regard to the signals the respective strategies will send to investors. Dividends, for example, can signal a long-term commitment to returning cash to shareholders, while share buybacks are often regarded as one-time events. Dividends can also suggest that management is confident in the sustainability and quality of future earnings, while buybacks may send no such clear message. On balance, the effects on the P/E multiple of significant, sustained increases in dividends are typically much larger than the announcements of large share buybacks.
The oil and gas industry—an obviously critical factor in the world’s ability to meet its current and future energy needs, as well as a major player in the global financial system (dividend payouts by the supermajors, specifically, are among the largest by any businesses)—finds itself in an era of unprecedented business challenges that include the need to strike new relationships with governments, NGOs, environmental groups, employees, and other stakeholders. However, the sector must not forfeit its fundamental relationship with investors. That relationship is damaged, but it can, and should, be repaired. While the amount of effort necessary will be sizable, the path for getting there is clear—and the upside is enormous.

