The world’s most digitally mature companies lead all other companies in value creation. They also have proved much more resilient during the crisis. After their market valuations took a big hit at the start of the pandemic, these companies quickly rebounded. Within six months, their valuations were, on average, 23% above precrisis levels, while the least digitally mature companies had managed just 7% growth, on average.
These are findings from BCG’s annual Digital Acceleration Index (DAI) study, a global survey of about 2,300 companies across ten industries. Companies aiming to accelerate their digital transformation and create value should learn how the most digitally mature companies charted a path to success in areas such as operational efficiency, shareholder value, and top-line growth. We have identified four accelerators that are strongly tied to the ability of these companies to translate strategy into outcomes—and market dominance.
Achieving Superior Performance
The most digitally mature companies outperformed their peers across nine KPIs, and they were particularly strong in the areas of revenue growth, enterprise value, and return on investment (ROI) in digital projects. (See “Our Survey Methodology.”) Importantly, the study revealed that the most digitally mature companies are bionic companies : organizations that blend new technology with human capabilities to transform operations, improve customer experiences and relationships, and develop new offers and businesses.
Our Survey Methodology
Companies with a DAI score from 67 to 100 qualify as bionic companies. Those with a score from 44 to 66 are building digital proficiency. And those with a score of 43 or less are digital laggards. We examined ten industries: consumer goods and retail, energy, financial institutions, health care, industrial goods, insurance, media and entertainment, the public sector, technology, and telecommunications.
From 2017 through 2020, 40% of the most digitally mature (bionic) companies grew revenues by more than 10%, while only 19% of the least digitally mature companies (digital laggards) achieved that result. Similarly, 33% of bionic companies increased total enterprise value by more than 10%, while only 15% of digital laggards reported the same. And when asked about their ROI for digital projects, 66% of bionic companies reported a return of 10% or more, but only 36% of digital laggards achieved that return. Across six other KPIs—cost reduction, share price increase, market share growth, and three types of EBIT impact (overall impact, from digital specifically, and from artificial intelligence specifically)—bionic companies were 50% more likely to reach the 10% threshold than were digital laggards.
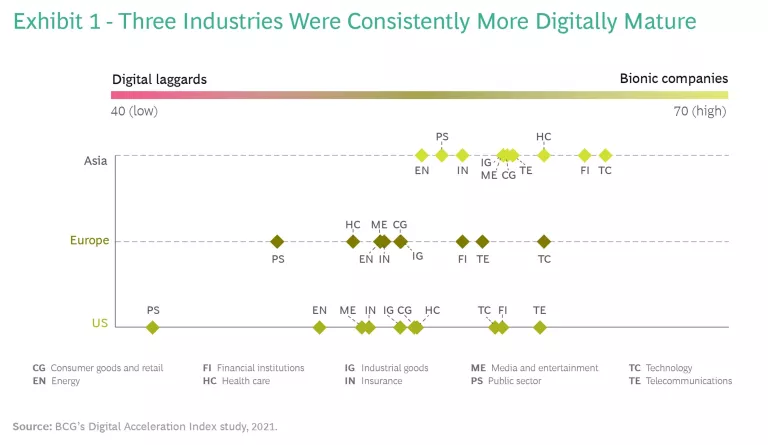
Although bionic companies are found in all industries, our research shows that some industries are well ahead in terms of digital maturity; foremost are financial institutions, technology, and telecommunications. (See Exhibit 1.) These three have maintained their positions as the most digitally mature industries for several years, which is not surprising given the digital nature of the products and services they offer. But the pandemic has clearly accelerated the digital development of consumer goods and retail as well as health care, improving their digital maturity significantly from 2019 through 2020. Their DAI scores rose 8 points and 5 points, respectively.
Online sales of some grocery categories have tripled during the pandemic, forcing consumer goods and retail companies to heavily invest in e-commerce channels . Meanwhile, digitally advanced health care providers now use patient data to anticipate interventions, improve efficiency, and predict the amount of time that’s required for patients’ clinical care. The goal of these providers is to digitize the patient journey from end to end .
Overall, Asian companies are still ahead of those in Europe and in the US in terms of digital maturity. But the digital maturity of Asia, Europe, and the US grew at similar rates in 2020, with their DAI scores rising by 4 or 5 points.
Deploying Four Specific Accelerators
Our research shows that four accelerators set bionic companies apart and enabled them to maximize the value of their digital initiatives.
Investing Significantly in Technology, Data, and Human Capabilities
Bionic companies have clear investment priorities. These companies invest in technology (modernizing applications), in data (increasing the quality and accessibility), and in their employees (strengthening their digital skills).
For three out of four bionic companies, digital initiatives account for more than 15% of their operating expenses. Of that, 30% is spent on increasing data quality and accessibility. Critically, these companies implement a unified data model to create a single source of truth across the enterprise. We found that 35% of bionic companies can map more than 25% of their data to a unified data model, while only 16% of digital laggards can do the same. In addition, 36% of bionic companies—compared with 12% of digital laggards—reported that they connected more than 25% of their applications through application programming interfaces.
For three out of four bionic companies, digital initiatives account for more than 15% of their operating expenses.
Equally important, bionic companies know how to flex the human muscle: 59% had more than 20% of their employees in digital roles in 2020, and 55% plan to increase their digital workforce by more than 20% over the next three years. Only 31% of digital laggards reported the same progress or hiring ambitions.
For example, a global technology company invested in advanced analytics and its staff to enhance its customer service operations. This investment helped managers improve their ability to forecast customer requests, restructure teams to better align staffing levels with peak demand, and develop hiring guidelines on the basis of long-term capacity needs. The company also funded large-scale training programs to help employees improve their digital skills. This combination of technology and human investment led to improved customer satisfaction.
Putting AI at the Core of the Digital Transformation
To become bionic, the companies in our study increased their investment in artificial intelligence (AI) and their efforts to scale it. These companies were 50% more likely than digital laggards to declare data and AI their top investment priorities. In addition, 60% put AI at the core of their digital transformation efforts. The opposite was true for digital laggards: 60% treated AI as a standalone technology solution.
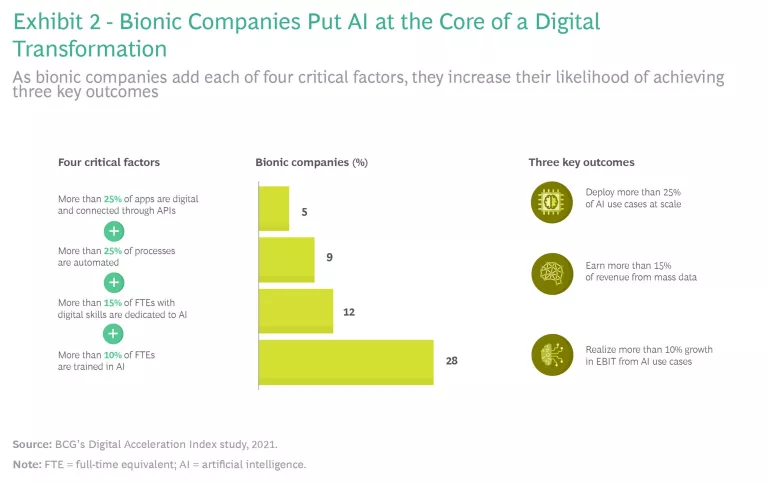
Bionic companies that have four critical factors improve the likelihood of achieving three key outcomes. (See Exhibit 2.) Interestingly, when measuring the incremental benefits of each factor, training employees in AI gave companies the biggest boost. After adding the first three factors, only 12% of bionic companies achieved all three key outcomes. But after training employees in AI (the fourth factor), 28% of bionic companies achieved the outcomes. Bionic companies recognize the benefit, and 54% of those in our study plan to upskill more than 20% of their workforce in AI and machine learning in 2021.
For example, a copper mining company built advanced machine-learning models that combined data from more than 1,000 sensors, which capture physical and chemical dynamics at the points of extraction. These models gave onsite machine operators the next-best suggestions for extraction, such as to optimize the composition of the chemicals or to slow the drilling speed. The company also invested in a training program for operators in order to speed up the adoption of the new models and, thus, the ability to scale them across the company’s mines. The ensuing revenue increase and cost savings generated 10% growth in EBIT.
Establishing Governance and Adopting a Platform Operating Model
To establish clear governance, bionic companies assign ownership and accountability for digital initiatives. Twice as many bionic companies as digital laggards have established the roles of head of digital (to create new value through digital) and chief data officer (to generate business value from data). The leaders who fill these roles, along with the CEO, are responsible for the company-wide digital strategy.
Bionic companies also make sure that business unit heads work closely with the technology function. And bionic companies hold the business unit heads responsible for executing digital initiatives, including funding them, providing resources, and overseeing their implementation. Digital laggards, by comparison, tend to rely heavily on top-down oversight and steering, leaving business unit heads with little decision-making authority.
A key difference between bionic companies and digital laggards is the use of a platform operating model. By adopting this way of working, bionic companies facilitate cross-functional teams, enabled by technology, to collaborate with full autonomy and accountability to achieve specific business outcomes. These digitally savvy teams design processes and build products and services end to end and with minimal dependencies on other platforms.
A key difference between bionic companies and digital laggards is the use of a platform operating model.
About 20% of the bionic companies in our study operate entirely using a platform model, while 60% use a hybrid model. In a hybrid approach, some digital initiatives are driven by product teams that take their decisions to business units and functions, while other digital initiatives are centrally driven by headquarters, business units, or functions. By comparison, about 65% of digital laggards still use a siloed operating model that is driven by business units. Digitally mature industries, such as financial institutions and technology, have evolved the most, while the public sector and energy companies have evolved the least.
For example, a large retail company was struggling with a legacy system that made sharing customer data across channels difficult. It decided to invest to reorganize its technology platforms, applications, and teams around customer domains (such as customer service). It also used these same domains as a blueprint to redesign the organization’s structure and governance. These efforts paid off quickly and handsomely. In just one year, the new approach to customer data helped the company double the revenue growth of its digital platforms.
Connecting Technology and Human Capabilities
To become bionic, it is not enough to just implement the right technology and then train people to use it. There is an additional, pivotal step: establishing a culture (through leadership engagement and incentives) in which employees are expected to continually look for ways to integrate technology and data into their routine day-to-day responsibilities and tasks. When this integration becomes a natural reflex, a company has a capability that we call human-tech augmentation (HTA).
HTA has three evolutionary stages: manual work, automation, and optimization. To illustrate, consider the operations of a company’s inventory warehouse. In the first stage, humans manage the warehouse as well as pick and pack products and sort parcels for shipping. In the second stage, humans manage the warehouse, but robots are deployed across the fulfillment center to automate the picking, packing, and sorting tasks. In the third stage, humans still run the warehouse, but robots augment their decision making. For example, robots may help to optimize the storage of inventory and the sequence for picking ordered items off the shelves. Companies in the third stage can often store 40% more inventory than those in the first stage.
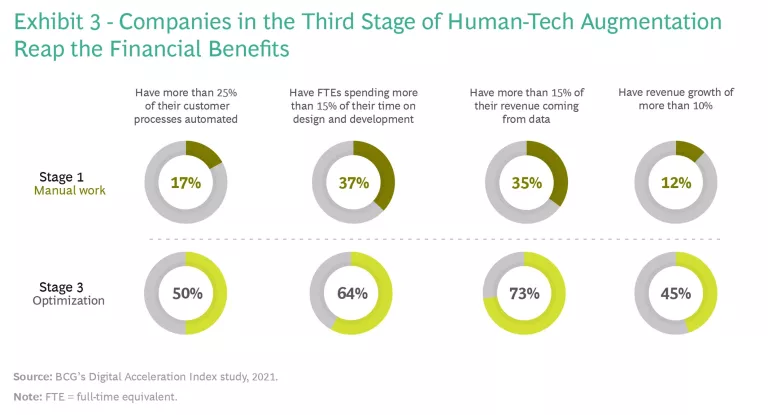
When it comes to HTA, bionic companies outpace digital laggards by a DAI score of 40 to 50 points, according to our global study. A whopping 72% of bionic companies are in the second or third HTA stage, whereas only 9% of digital laggards have evolved past the first stage. The financial impact is significant. Companies in the third HTA stage are twice as likely as those in the first stage to produce more than 15% of revenue from data, and they are almost four times as likely to grow revenue by 10% at a minimum. Of stage three companies, 50% have automated more than 25% of their customer processes—about three times the percentage of stage one companies. By leveraging technology to automate many processes or tasks, employees can spend more time on design and innovation: 64% of companies in the third HTA stage dedicate more than 15% of full-time equivalents’ time to design and development activities; only 37% of companies in the first stage do the same. (See Exhibit 3.)
Three Next Steps
The digital path to value creation is unique for every company, but there are a few steps that all companies should take during their digital transformation.
Determine where the organization stands in its digital transformation. Assess the current maturity of digital capabilities, evaluate the status of existing digital initiatives, and review long-term transformation goals.
Discuss the opportunities for and the value of applying the four accelerators. Consider how each of the four accelerators can help the company’s unique journey on the basis of its current capabilities, initiatives, and goals.
Start pilots and agree on a roadmap to accelerate the digital transformation. Depending upon how the company wants to leverage the four accelerators, design pilots that can advance the digital journey and attain the desired goals.
Digital transformation has taken a top spot on leaders’ agendas for several years, but the crisis has accelerated its urgency. In a postpandemic world, companies cannot go back to business as usual. Future competitiveness and resiliency will depend on maximizing the value from digital transformations. Regardless of where a company is on its digital journey, the four accelerators can help continue the vital work of transforming it into a bionic company.


