Building resilience and promoting sustainability while maintaining cost efficiency, service levels, and growth requires redesigning your network—and that will take several years. Better get started.
Product supply networks have a critical role in helping producers fulfill their value proposition, such as offering high-quality products at low cost or running fast and flexible operations.
For several decades, the input parameters and economic assumptions underlying network design and optimization have generally been stable. Manufacturers have typically scaled and located factories and warehouses to strike the right balance between cost efficiency, service levels, and growth.
In recent years, however, the resiliency and sustainability of a company’s product supply network have become more important. This shift has undermined the assumptions that led many companies to design a global network with manufacturing hubs in low-cost locations. Indeed, what was once an ideal network could be a competitive disadvantage today.
To optimize their network for the new reality, manufacturers need to rethink it—scaling and locating facilities in a way that builds resilience and promotes sustainability without unduly sacrificing cost efficiency, service levels, and growth. Advanced analytics tools can help producers determine the best network design. Implementing a new network design requires several years, so manufacturers face an urgent need to get started.
The Objectives of Network Design
Manufacturers have generally considered three main objectives when seeking to optimize their product supply
- Cost Efficiency. End-to-end cost efficiency has long been the key optimization criterion for product supply networks. Manufacturers consider factor costs in various locations, logistics costs along the entire value chain (from the raw-material sources through the value-adding steps to the final customer), the scale of plants and warehouses, and costs for working capital.
- Service Levels. In pursuing cost efficiency, manufacturers should consider the need to maintain appropriate service levels for customers, such as by providing short, reliable lead times and the flexibility to change orders.
- Growth. A network design can significantly contribute to unlocking growth for a company. For example, a design can provide sufficient capacity to expand production in response to new business opportunities or establish a regional presence that ensures access to a restricted market.
Given the shifting business, geopolitical, and social environments, producers need to rethink their network design and consider two additional objectives:
- Resilience. A resilient product supply network can continue to achieve its objectives when challenged by uncertainty and disruptions. It allows a manufacturer to continue delivering products and maintain profitability in an unstable business environment.
- Sustainability. Sustainability is a broad topic that includes environmental and social considerations. Manufacturers need to make their network more sustainable in order to reduce emissions, waste, and energy consumption, cut costs (such as penalties for CO2 emissions), and meet demands from consumers for socially responsible production.
Sometimes companies can address multiple objectives simultaneously. For example, shortening the distances required for transporting products reduces costs as well as CO2 emissions. However, often, producers need to make tradeoffs. For instance, a company can improve cost efficiency by consolidating production at a single large site, but strengthening resiliency can require having redundant operations at multiple smaller sites.
In some cases, the most relevant design considerations are determined by market characteristics.
In some cases, the most relevant design considerations are determined by market characteristics (for example, where consumers are located and what they require with respect to cost or speed). In other cases, design considerations result from regional differences in factor costs, policies, or regulations (such as taxes). For example, to address both labor costs and lead time, automotive suppliers of labor-intensive parts (such as cable harnesses) for Central European car manufacturers often design a network that includes locations in Eastern Europe or North Africa. Labor in these regions is less expensive than in Central Europe, and the distance to customers’ factories is still short enough to allow for just-in-time shipping.
Four Archetypes Reflect the Balancing of Scale and Location
To manage the diversity of design objectives, manufacturers have generally focused on the scale and location of sites for their plants and warehouses.
- The scale of sites has ranged from consolidating operations in one large site (for example, to reduce costs through scale) to dispersing operations across multiple smaller sites (for example, to enable growth by tailoring products for local markets).
- The location of sites has helped companies optimize manufacturing (for example, operating sites where energy costs are low) or it has helped improve logistics (for example, shortening the distances for transporting materials or products). A company needed to decide how it wanted to prioritize optimization for manufacturing versus optimization for logistics.
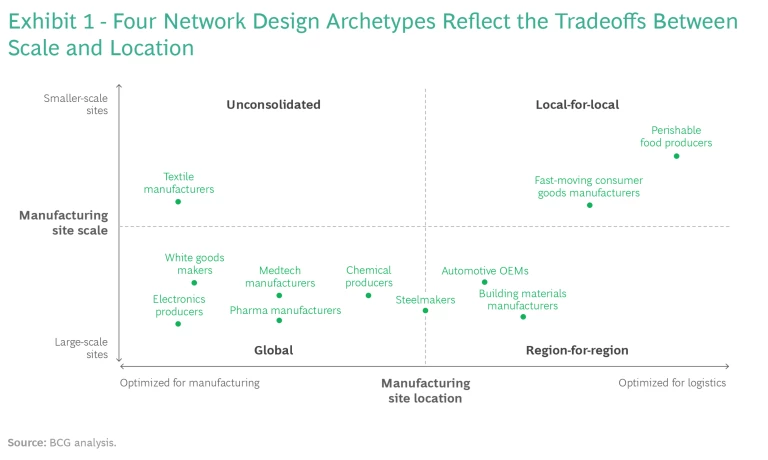
Over time, balancing the tradeoffs of scale versus location has resulted in four network design archetypes across production industries. (See Exhibit 1.)
- Global manufacturing and distribution is mostly used in asset-heavy industries with strong economies of scale. In these sectors, production scale and low factor costs are important cost-reduction levers, products can be shipped inexpensively relative to their value, and customer requirements allow for longer lead times. Manufacturers with labor-intensive processes use this archetype, moving production to so-called best-cost countries, such as those in Southeast Asia, Latin America, or Eastern Europe. Pharmaceutical, electronics, and chemical companies use this network design.
- Local-for-local manufacturing and distribution is predominantly used by companies that produce goods that have complex shipping requirements (such as perishable foods) and goods for which there are few opportunities to reduce factor costs (such as bulk materials owing to their lower value density). Companies using this archetype generally need to transport goods to nearby locations.
- Region-for-region manufacturing and distribution often results from optimizing the tradeoff between customer proximity and low manufacturing costs. For example, manufacturers with energy-intensive processes—such as steelmakers and building materials manufacturers—typically use this archetype, locating production in regions where logistical constraints are minimal and energy and electricity costs are low.
- Unconsolidated networks typically arise after a period of high growth. For example, after a series of mergers or acquisitions, a manufacturer may have numerous smaller sites that it needs to consolidate.
Given the new emphasis on resiliency and sustainability, companies need to reconsider the tradeoffs between scale and location and the balance that they want to achieve. Rebalancing may mean that a producer shifts to a different archetype—and even gains a significant competitive edge.
Resilience and Sustainability Have Gained Importance as Design Criteria
The relative stability of the business environment over the past several decades has meant that manufacturers have not needed to reconsider which network archetype they use. Tariffs and trade barriers were quite low in the generally peaceful and cooperative geopolitical environment in the decades after the Cold War. Developing countries provided inexpensive labor and energy and often had lower regulatory standards. This made them ideal locations for mass production and promoted the use of global manufacturing and distribution hubs. Freight rates were also low and stable, allowing companies to optimize supply chains based on other costs.
In this environment, manufacturers could prioritize cost efficiency over resilience in designing a network. Moreover, sustainability was typically not a major consideration; because customers and society overall did not emphasize these topics, the financial implications for not prioritizing them were often relatively small. However, seismic shifts in the business environment in recent years have elevated the prominence of resilience and sustainability as criteria in network design.
The need for greater resilience is apparent. Geopolitical instability and the COVID-19 pandemic have raised the costs of cross-border supply chains and interrupted the flow of goods. Most notably, the war in Ukraine temporarily severed some automotive supply chains between Eastern and Central Europe and has dramatically increased prices for energy and natural gas in Central Europe. The higher prices have created massive challenges for energy-intensive businesses. The instability has also affected other industries—for example, the chemical industry relies on natural gas as a feedstock for many products. The pandemic has snarled supply chains (for example, due to port lockdowns or congestion) and pushed freight rates dramatically higher. For many companies, a lack of resilience has reduced margins and limited top-line growth.
Consumers, governments, and other stakeholders are increasingly focused on climate change and other aspects of sustainability. The ambitions established in the Paris Agreement (reached at the United Nations 21st Conference of the Parties, or COP21) and the Glasgow Climate Pact (COP26), for example, have made reducing the environmental impact of product supply networks a priority for many manufacturers.
The increasing importance of resilience and sustainability could dramatically alter the ideal product supply network.
The increasing importance of resilience and sustainability relative to cost efficiency, service levels, and growth has the potential to dramatically alter the ideal product supply network for specific industries. A network that provided a competitive edge in the past may suddenly become a disadvantage. For example, consider a European producer that used a Southeast Asian manufacturing hub to reduce unit costs through lower factor costs and greater scale. These benefits could now be offset because the long shipping distances expose the company to a greater risk of supply disruptions, while higher freight rates increase transportation costs. In addition, the European Union’s carbon border tax will raise the costs of imported products starting in 2026.
So, how do building resilience and promoting sustainability influence network design and the path to an optimized network?
Building Resilience
A resilient product supply network is strong enough to withstand a variety of disruptions, thereby limiting the impact of each disruption on the full network. It can also quickly recover to full performance in all aspects of its value proposition, such as providing low costs or fast and reliable customer delivery.
Networks experience many different types of disruptions. For example, labor shortages can impede manufacturing operations. Shipping delays—whether inbound from suppliers, between manufacturing sites, or outbound to customers—can affect distribution operations. Significantly higher freight rates or labor costs can also lead to abrupt changes in the assumptions underlying the business cases for products and service levels.
To build resilience, companies need to identify potential disruptions and understand the implications.
As a first step to building resilience, companies need to comprehensively identify potential disruptions and understand the implications for their manufacturing and distribution network. Especially for a complex network, a company needs to use digital twins or other advanced network optimization tools to fully understand the implications of such disruptions.
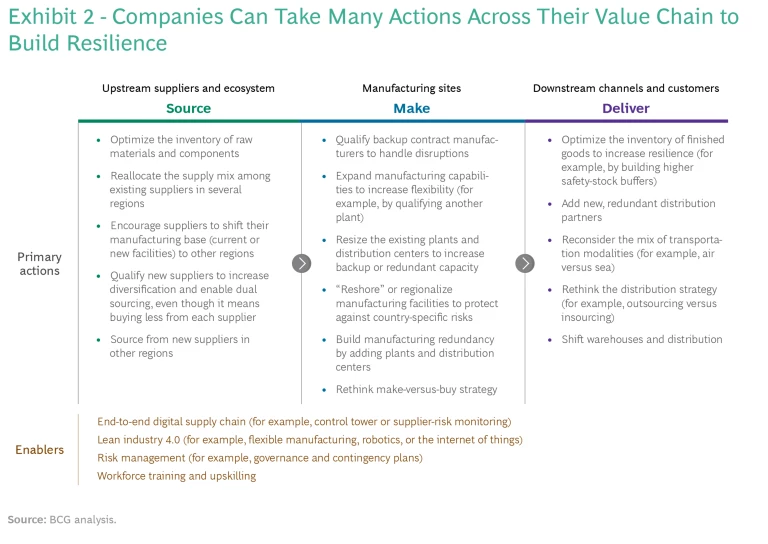
With this fact base in hand, companies can systematically reduce their exposure to the most significant disruption risks. Companies can take several risk-reduction actions along the source-make-deliver value chain, although some of these entail tradeoffs. (See Exhibit 2.) Examples of actions include the following:
- Qualifying New Suppliers. By bringing onboard new suppliers at the source stage, a company reduces risks through greater diversification. This action also enables a dual-sourcing strategy for key components or raw materials used in the production process. However, the action entails the tradeoff of buying less from each supplier, which may mean higher costs.
- Creating Redundancy. To prepare for more significant disruptions at the make stage, a company often needs to build manufacturing redundancy by adding more plants and distribution facilities. In some cases, however, a company can avoid adding sites by qualifying certain production processes in multiple existing facilities. Typically, increased manufacturing redundancy comes at the price of higher fixed costs, reduced benefits from scale, and diminished economies from experience. Consequently, the company should carefully consider the tradeoff between redundancy and higher costs.
- Building Safety Stock. A company can build safety stock in certain locations to create a time buffer at the deliver stage. This action can be sufficient when disruptions span only a few days or weeks and do not structurally impact production or distribution. Building safety stock affects the product supply network’s value proposition—such as by requiring more working capital or longer lead times or causing higher scrap costs (for example, in case of expiries)—but the harm is often minimal.
- Reducing Logistics Risks. To hedge against logistics-related disruptions at the deliver stage, companies can reduce their transportation volumes and distances and avoid especially fragile transportation routes. This may require relocating plants or distribution centers closer to customers and cutting back on the transportation of work-in-progress goods in the global value chain. Reducing the exposure to logistical risks typically increases manufacturing costs—for example, the company may lose the benefits of low factor costs. However, cost increases can often be offset by the diminished logistical effort as well as shorter lead times that accelerate response to customer demand and require less working capital.
To find a reasonable tradeoff between increased resilience and higher costs, a company needs to understand which actions to take to achieve the aspired level of resilience and how this affects the overall value proposition of the product supply network. The best path from a cost-optimized to a resilience-optimized network depends largely on the network’s characteristics, and, therefore, is often specific to an industry or even a company. Pharmaceutical and battery cell manufacturers illustrate the differences at the industry level.
Pharma Manufacturers. Pharma product supply networks have typically emphasized cost efficiency through a global footprint. This has been possible because most products are inexpensive to ship relative to their value. Pharma companies have used large-scale facilities, one of the most important levers for cost optimization—increasing production volume by two to three times can reduce conversion costs by 30% to 50%.
Recently, the resiliency of pharma product supply networks has gained importance not only for manufacturers to achieve their growth ambitions but also for countries around the world to ensure product supply and, hence, access to medicine for their people. During the COVID-19 pandemic, for example, some countries restricted the export of critical pharma products. This shift made governments aware of their supply vulnerability, and they reviewed their sources of supply.
To adapt to the new reality, pharma companies must decide how resilient they want and need to become and what level of cost efficiency they are willing to sacrifice to achieve their goals. Companies may want to discuss the costs and benefits with their customers. For many companies, a region-for-region network will be the right setup. Some manufacturers of products that are highly challenging to supply (owing to the need for refrigeration or special handling, for example) may need to adopt a local-for-local design for specific markets.
Battery Cell Manufacturers. Today, most battery cell producers use a region-for-region network. For example, a large South Korean manufacturer operates plants in Asia, Europe, and North America. This approach is optimal because the impacts of scaling up or down are relevant only for individual production lines, each of which represents a small amount of annual production capacity. In addition, shipping across long distances is expensive and presents safety challenges: batteries are bulky and combustible, and they have a lower value relative to their weight and volume than many products.
The region-for-region design gives cell manufacturers a good level of resilience. However, many of their customers are automotive companies that are becoming more concerned about the resilience of their entire supply chain and are enforcing strict lead time requirements. As a result, we expect to see cell manufacturers build more plants closer to their customers. These plants will enable a local-for-local design while still being large enough to be cost competitive.
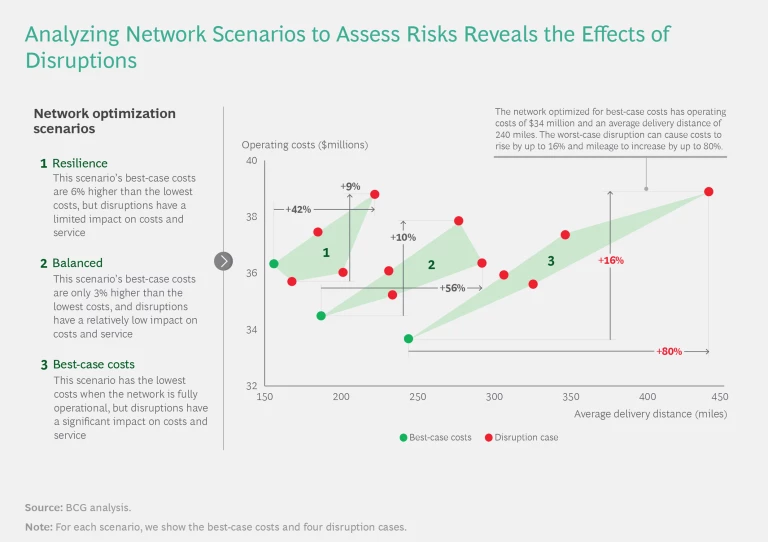
To optimize their product supply network, companies should use advanced-analytics to simulate operating costs and delivery performance across multiple scenarios. (See the sidebar “Simulating the Optimal Balance Between Best-Case Costs and Resilience.”)
Simulating the Optimal Balance Between Best-Case Costs and Resilience
Simulating the Optimal Balance Between Best-Case Costs and Resilience
For each scenario, we analyzed several disruption cases, including interruptions to distribution center operations and logistics. (See the exhibit.)
- The network optimized for best-case costs has the lowest costs in the absence of disruptions. However, if disruptions occur, the costs and delivery mileage increase significantly—by 16% and 80%, respectively—versus the best-case costs.
- The network optimized for resilience has best-case costs that are 6% higher than those of the network optimized for these costs. But the network is able to contain the impact of disruptions: costs increase by less than 10% and delivery mileage increases by 42%.
- The balanced network has best-case costs that are only 3% higher than those of the network optimized for best-case costs. If disruptions occur, costs increase by up to 10% and delivery mileage increases by 56%.
Promoting Sustainability
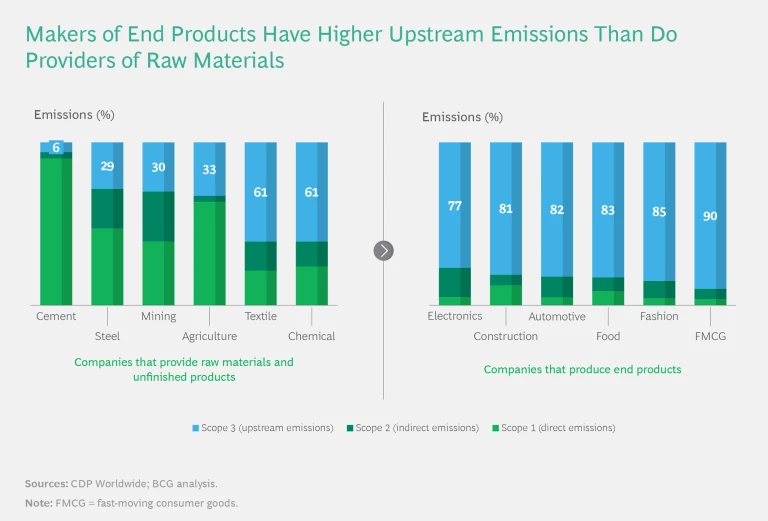
Within the broad topic of creating sustainable operations, we focus on CO2 emissions because of their significant implications for product supply networks. (See the sidebar “The Three Scopes of Emissions.”)
The Three Scopes of Emissions
The Three Scopes of Emissions
- Scope 1 emissions are direct from operations owned or controlled by a company. For example, these emissions are from combustion in boilers, furnaces, or vehicles or from chemical production in process equipment.
- Scope 2 emissions are indirect from the generation of purchased energy consumed by the company—such as electricity, steam, heating, or cooling.
- Scope 3 emissions are all indirect emissions that occur in the company’s value chain (upstream and downstream). For example, these emissions are from the production of purchased products (such as raw materials or components of the company’s end products), the transportation of purchased products, the use of sold products, the end-of-life treatment of sold products, and waste treatment.
There are two main drivers of a network’s emissions:
- Energy Consumption and Mix. To optimize the amount of energy consumed and the mix of energy sources used in operations, manufacturers need to consider network design with respect to the scale of their equipment, the location of the site, and the technology they are using. Large-scale equipment is typically more energy-efficient than smaller-scale equipment. The site location determines the energy sources that are available, and the local temperatures and humidity conditions affect the amount of energy required. Equipment that uses newer technology and is better maintained is typically more energy efficient.
- Freight Volumes and Transportation Modes. Optimizing CO2 emissions from transport requires first considering the tradeoffs between freight volumes and transportation modes. Then, a company should assess the effects of those tradeoffs on other network design objectives. For example, changing the mode from air to sea may reduce emissions but increase lead times, and thus hurt service levels.
Until recently, a manufacturer’s CO2 footprint did not directly affect the economics of its business, and customers did not focus strongly on sustainability. In fact, less stringent environmental regulations and standards in some countries and regions contributed to lower production costs. For example, manufacturers could avoid costly treatment of exhaust gases or wastewater, or they could emit unlimited amounts of CO2 without additional costs. In locations with low-cost energy sources, many manufacturers have benefited from using older, less energy-efficient equipment that has been fully depreciated—even if more energy-efficient technologies are available.
However, the public’s increasing consciousness of climate and sustainability topics has led to stronger regulations in many markets, which means that CO2 emissions may have a direct financial impact on businesses. For example, if CO2 emissions are penalized, such as through a carbon border tax, using energy-efficient equipment will become more attractive. In some cases, the need to invest in new equipment might lead companies to reconsider the financial viability of plant and warehouse locations. Even without investments in new equipment, penalties may reduce or eliminate a location’s cost advantage. Consequently, companies need to explicitly consider emissions costs, including carbon border taxes and other penalties, as they rethink their product supply network. The impact may significantly affect the network’s setup. (See the sidebar “Assessing the Implications of the EU’s Carbon Border Tax.”)
Assessing the Implications of the EU’s Carbon Border Tax
Assessing the Implications of the EU’s Carbon Border Tax
The EU wants to phase out allowances over the next ten years. To avoid harming competitiveness, it plans to introduce a carbon border tax in 2026. The tax will be levied on importers and based on the scope 1 CO2 footprint of covered goods. As a first step toward implementation, importers will need to report the CO2 footprint of their imported goods starting on January 1, 2023.
The steel industry will be strongly affected by the CO2 emissions trading scheme and the carbon border tax. The EU currently produces approximately 90 million tons of flat steel per year using the blast furnace-basic oxygen furnace (BF-BOF) process. Of this amount, approximately 15 million tons are exported. In addition, the EU imports 20 million to 25 million tons from countries outside the region (for example, from India or Turkey).
Under the emissions trading scheme (and assuming that CO2 prices remain at €90 per ton), the cost of CO2 emissions certificates for hot-rolled-coil steel produced in Europe via the BF-BOF process would be approximately €50 per ton in 2027 and approximately €160 per ton in 2032. This means that certificates would cost between 5% and 20% of the current price of one ton of hot-rolled-coil steel.
Because steel is included in the carbon border tax, steel imports into the EU will be subject to similar CO2 regulations and costs as EU-produced steel. In some of the major countries exporting to the EU, such as India, the CO2 emissions intensity of producing steel is higher than in the EU. As a result, we expect the carbon border tax on BF-BOF steel that is imported from India to be approximately €100 per ton in 2027 and approximately €200 per ton in 2032.
Steel produced in Europe and then exported will likely face a significant cost disadvantage versus steel produced outside Europe, owing to CO2 emissions costs—as long as no similar mechanisms are in enacted in the region receiving the steel exports.
Considering the financial impacts of emissions trading and the carbon border tax, producing steel in the EU for sale within the region will become more attractive economically when the carbon border tax takes effect. Steel imports will lose some of the favorable economics they enjoy today, and exports will have a cost disadvantage on the global market.
Beyond pure economics, rethinking a product supply network for steel must also consider resilience and sustainability, among other objectives, as well as complexities such as different steel grades and qualities. Given the diversity of considerations, there is no universally applicable network design archetype. To undertake a redesign, each company needs to conduct a thorough analysis that considers all the specifics and value propositions of its product supply network.
In many cases, addressing the financial impact requires giving greater emphasis to optimizing logistics costs and scope 3 emissions when balancing the tradeoffs among manufacturing locations. For some industries, the economics become more favorable for locating sites in regions with higher labor costs that are also closer to customers. The shorter distances reduce freight costs and emissions, while the lower emissions penalties offset the disadvantages of labor and production costs. For other industries, locations that are close to the source of raw materials may be more attractive. The shipping volume or weight of mining products, for example, can be considerable, yet the value is low. A network design that allows for lower shipping costs can be advantageous.
Stay ahead with BCG insights on business resilience
Getting Networks Ready for the Future
To give greater emphasis to resilience and sustainability, many manufacturers will need to transition from a global product supply network to a region-for-region design that makes it possible to have shorter lead times and transport products over shorter distances. This transition will change the competitive environment in markets by allowing companies to accelerate deliveries of customers’ orders. If customers start to expect faster deliveries, all companies will need to shorten lead times to remain competitive. Shorter lead times will also allow for increased flexibility in meeting customers’ individual specifications. The ability to make last-minute changes to a product’s configuration will become the standard. Some players will use these changes to aggressively improve their market position or even to enter new markets.
Because manufacturers need several years to implement changes that reflect the new tradeoffs, incumbents with a legacy network must act quickly to avoid being at a competitive disadvantage. Redesigning the target picture of a product supply network entails four phases:
- Develop a vision for the product supply network and set strategic guardrails. Start the journey with the customer in mind and understand the customer’s needs, demand scenarios, and business requirements. Define high-level business requirements (such as service levels and emission-reduction targets) in light of future demand, and derive guiding principles for the network design.
- Establish the baseline and identify gaps. Assess the current state of the product supply network and create transparency on the key performance indicators. Clearly define how the network currently contributes to achieving each of the five design objectives: cost efficiency, service levels, growth, resilience, and sustainability. Identify the gaps between what the current network achieves and the needs of the business.
- Define the target state. Considering the baseline and the identified gaps, derive the options for the network. Assess and prioritize these options and, ultimately, define the North Star, or target state, for the network. Depending on the starting position, the effort to reach the North Star can range from fine-tuning the existing network to designing a fundamentally new one. If a fundamental redesign is needed, it is advisable to use an advanced analytics tool, such as BCG’s SNOW AI solution, to support the effort.
- Develop a roadmap. Define an actionable plan and kick-start the implementation activities to reach the North Star. This requires disaggregating the effort into projects that create business value without overburdening the organization.
The business environment for product supply networks has changed significantly in recent years. Although cost efficiency, service levels, and growth remain critical considerations, resilience and sustainability have gained importance, and this trend will likely continue. The long lead times required to rebalance priorities mean that companies must start now to systematically redesign their product supply network. Given their network’s important role in promoting competitiveness, manufacturers cannot afford to delay the effort to make it future-proof.
The authors thank their colleagues Dharanidhar Nalabolu and Nicole Voigt, as well as their former colleague Michael Jobst, for their contributions to this article.
