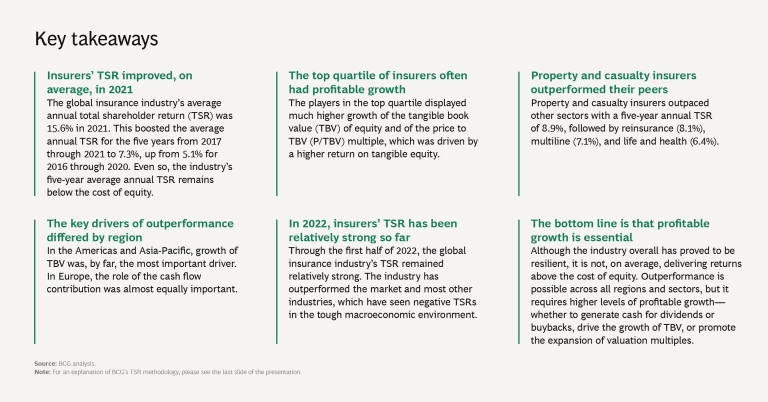
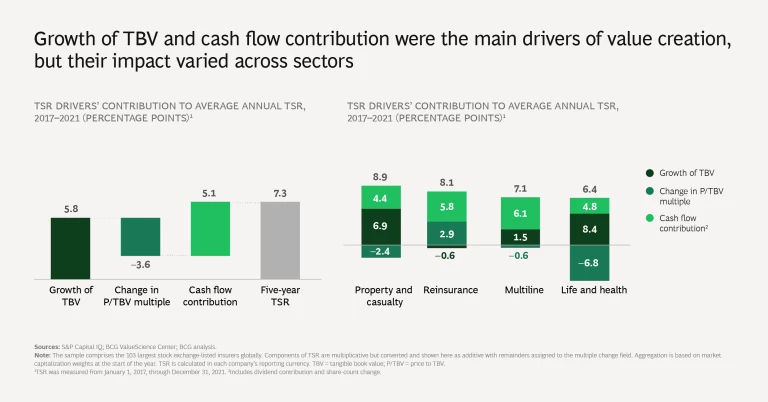
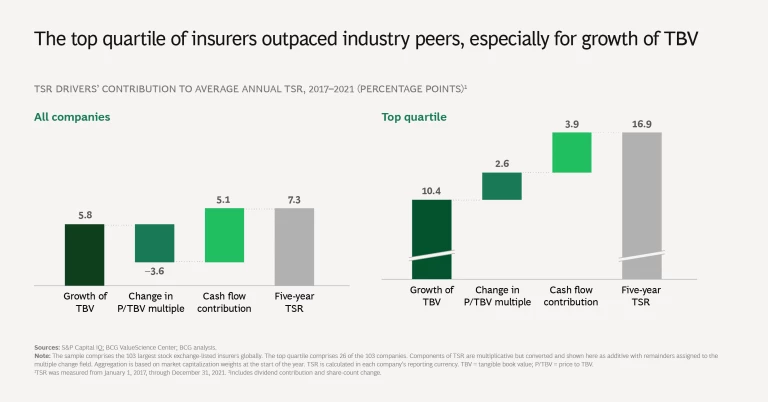
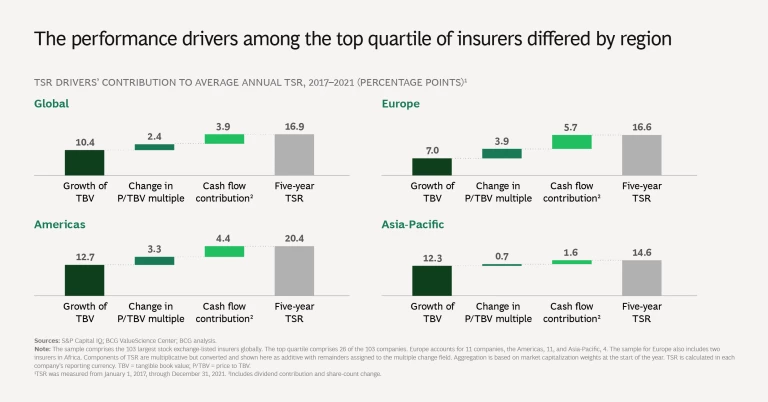
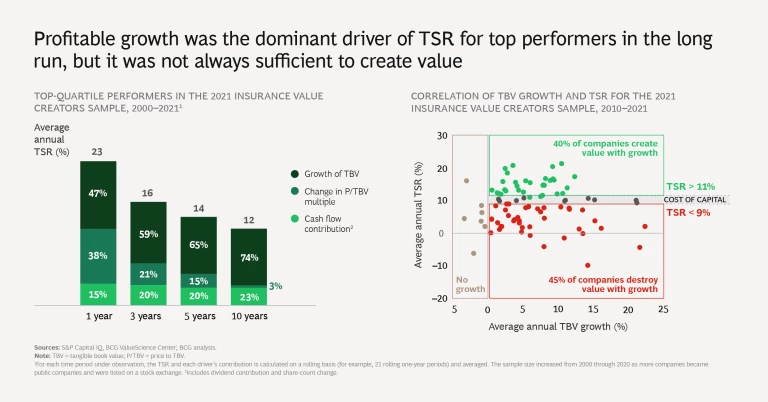
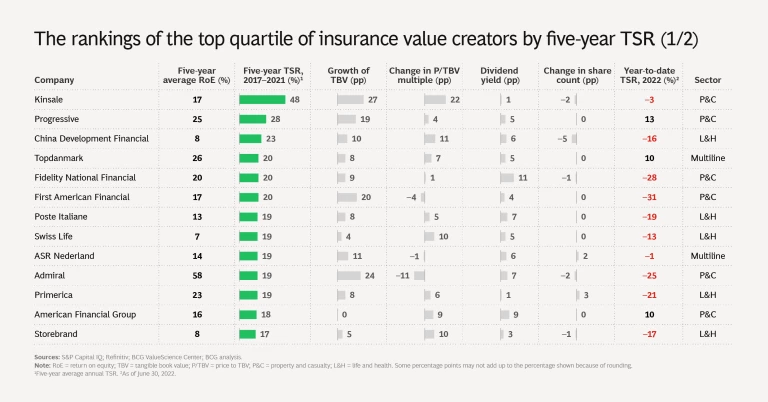
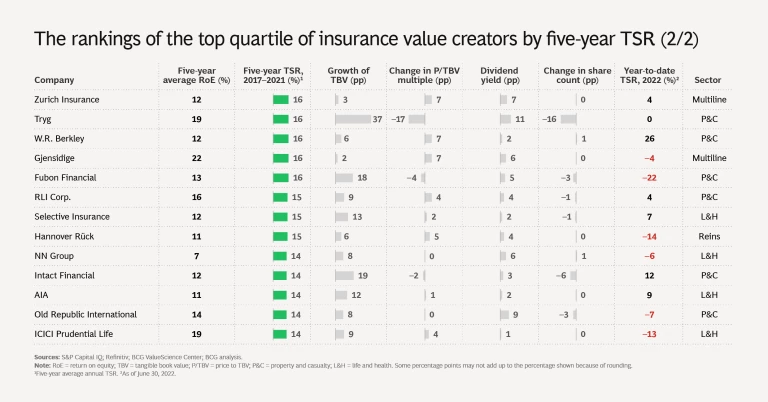
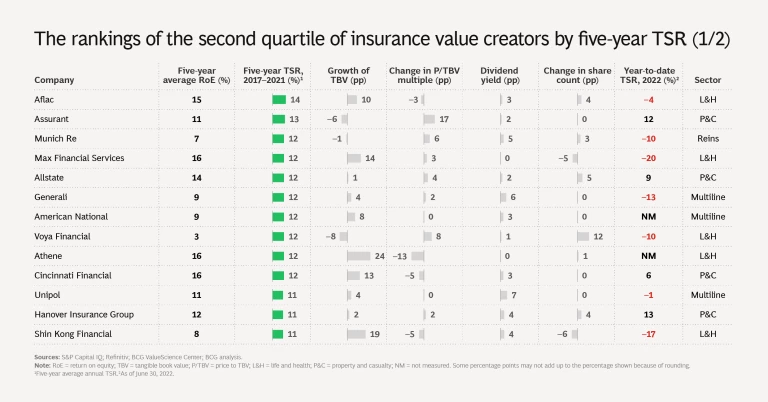
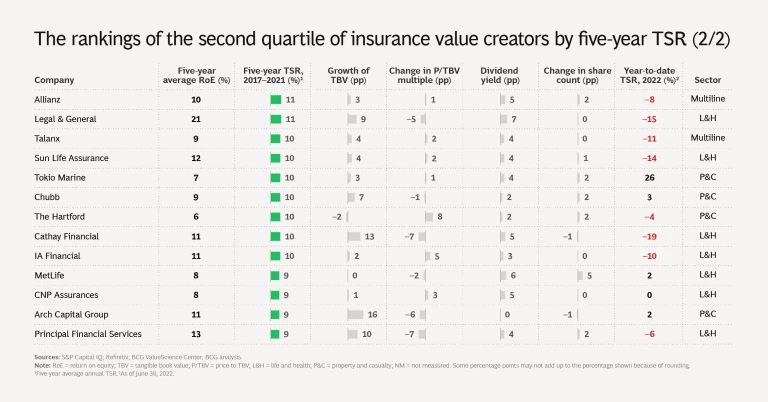
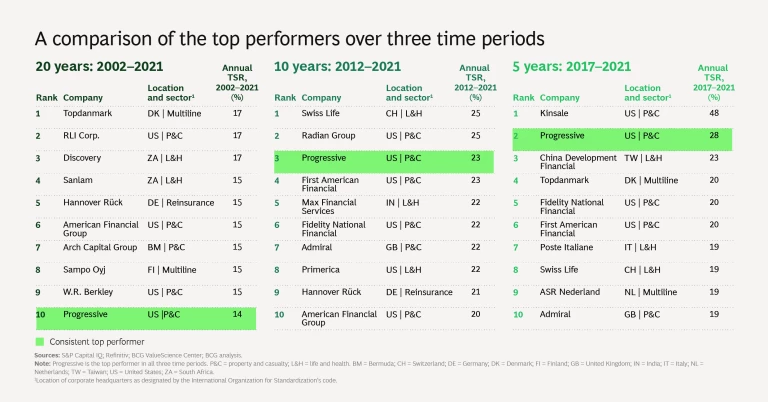
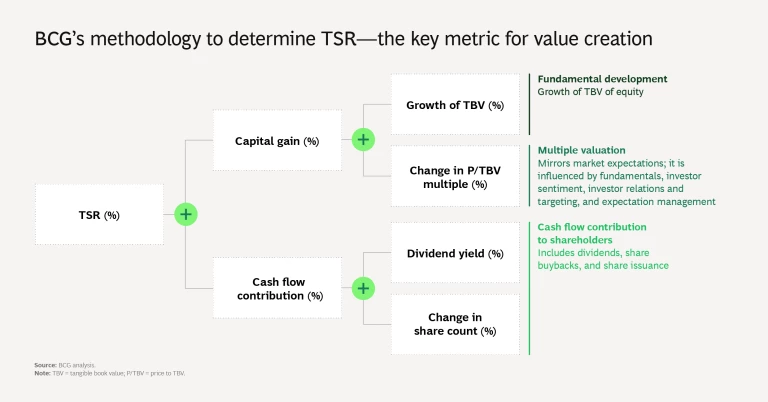
Disaggregating companies’ total shareholder return is telling. Profitable growth is essential to sustaining long-term value creation because it contributes to each component of TSR.
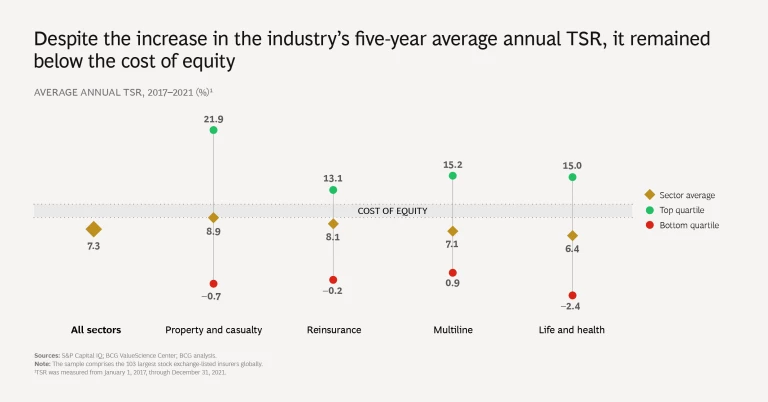
The global insurance industry’s total shareholder return (TSR) has, on average, been disappointing in recent years—staying below the cost of equity. But the average doesn’t tell the full story. Strong TSR performance is possible regardless of an insurer’s location or business line. Indeed, some players have consistently outperformed over the years. Our analyses point to profitable growth as crucial to promoting sustained long-term value creation, given its important contribution to each TSR component.
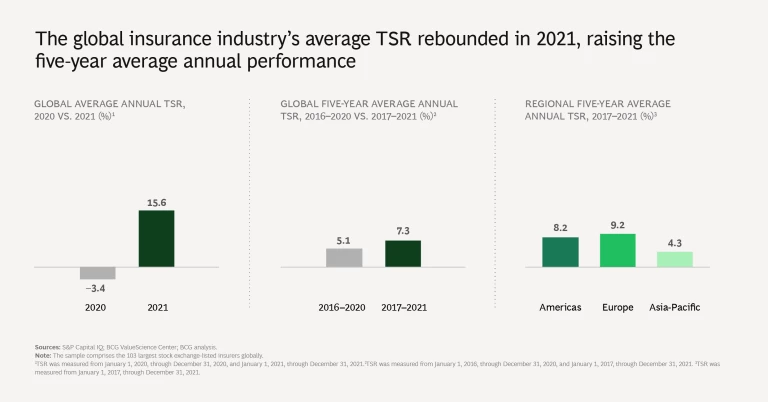
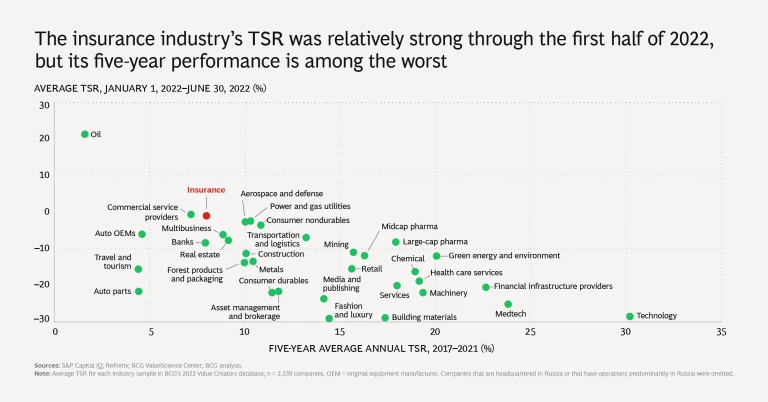
In 2021, the average annual TSR for insurers across regions we examined (the Americas, Europe, and Asia-Pacific) and sectors (property and casualty, reinsurance, multiline, and life and health) was 16%—a marked improvement from –3% in 2020. However, the industry’s average annual TSR of approximately 7% for the five years from 2017 through 2021 was well below the average of 15% for the S&P 500 and placed insurance 27th among the 33 industries tracked by BCG. Through the first half of 2022, the industry’s average TSR was –1%—a relatively strong performance, compared with that of other industries that have been hit harder by the challenging macroeconomic environment.
Each year, BCG looks at TSRs on a rolling five-year basis to illuminate long-term value creation. This year’s insurance company sample comprises the largest stock exchange-listed insurers worldwide: 103 players with a market capitalization of more than $4.5 billion at the end of 2021. These companies’ TSRs are straightforward to measure: we combine share price gains and the impact of dividends and share-count change. What’s more interesting is disaggregating the TSRs into their components.
In insurance, TSR derives from three sources: growth in tangible book value (TBV), change in the price to TBV (P/TBV) multiple, and cash flow contribution (comprising dividend yield and change in share count). Over the long run, TBV growth and cash flow are the major contributors to TSR. Over the short to medium term, changes in the P/TBV multiple matter a lot more.
The average annual TSR for the global insurance industry was 16% in 2021.
The most important challenge for management is making the right tradeoffs among increasing TBV, deploying free cash flow, and expanding or protecting valuation multiples. BCG’s TSR methodology helps insurers explore these tradeoffs and make informed decisions about factors such as portfolio focus, capital allocation, and business units’ financial targets.
The slideshow provides an overview of global TSR; comparisons by quartiles, regions, and sectors; and the rankings of first- and second-quartile performers. The other publications in this year’s series focus on the US property and casualty sector, insurers in Europe, insurers in Asia-Pacific, and global reinsurers.
The authors thank their BCG colleagues Filippo Novella, Rachna Sachdev, and Teresa Schreiber as well as Ted Bonanno and Martin Link of the BCG ValueScience Center.

