Software is one of the most popular sectors for investors to pursue—and one of the most complicated. To find lasting advantage in such an active and intricate space, private equity firms must have a way to identify potential target software companies with clarity and efficiency.
Private equity’s commitment to technology is easy to explain: enterprise software is everywhere, holding up nearly every corner of a business, no matter the industry or region. Enterprise software is also highly scalable, making technology a fundamental, ever-evolving resource with high customer demand. A software provider with a compelling B2B product can quickly use investor capital to fuel growth and innovation to address this demand—and there is no better driver of returns for private equity investors than growth.
However, software is also an extremely heterogeneous part of the economy. Investors may struggle to recognize external indicators of adoption and growth across a technology sector , such as patterns of customer purchases of a type of software or rising revenue among similar vendors. Private equity firms need an understanding of underlying market growth factors and customer behavior that is anchored in empirical assessments. Such a view has been elusive at scale. At times it can even be difficult to know what a software product does. Many technology providers market their solutions in vague, inconsistent terms and cover a crisscrossing range of use cases, leaving investors unsure how to categorize any given software firm.
These factors can hinder a private equity firm’s effectiveness on both strategic and tactical levels. Leaders cannot be sure they are assigning deal teams to the most favorable areas. And too many firms waste time and resources composing a deal thesis for a software sector that turns out to contain just a handful of prospects.
While information about privately held software companies can be hard to obtain, emerging alternative data sources can reveal signs of investment opportunity across software categories.
To apply empirical rigor to prioritizing software investment targets, we have explored how to quantify growth and customer adoption throughout the technology landscape. Information about privately held software companies is scarce; however, we have found that broader emerging alternative data sources can reveal signs of investment opportunity across software categories. For example, G2—one of the world’s largest software marketplaces, which connects buyers, sellers, and companies to help guide purchase decisions—contains new insights relevant for investors. More than 60 million people annually use G2 to make more informed software purchasing decisions based on user reviews of software products. G2 offered us open access to their full dataset, with over 1.7 million reviews and more than four years of buyer traffic data currently hosted in the G2 database. This rich set of review data allowed BCG to look across the software landscape at scale.
BCG assessed the G2 data and other sources of industry and customer data to identify key growth dynamics. Investors can make similar assessments by using these alternative sources of data in addition to other sources commonly used in early diligence (e.g., surveys, secondary reports, and other analysis). Such assessments cast light on growth trends that have long been difficult to observe, like the budding adoption of a technology type by smaller B2B customers. We also offer several pieces of guidance to help investors recognize where growth may be shorter or extensive and lasting. With this knowledge, private equity firms can then create investment approaches that are suited for the nuances of growth occurring in a particular category, leading them to promising targets in the sprawl of technology offerings.
Building Investment Strategy Around Five Software Growth Archetypes
Assessing the growth of a company or market segment gives investors an overarching strategic benefit: the firm’s investment style can be designed for the appropriate type of growth appearing in a software category.
We have identified five major archetypes of growth in the technology space, from Target-Rich Growth to Pinpoint Plays. This high-level strategic framework guides the tactical choices that a firm can make to build a portfolio of advantageous assets. (See Exhibit 1.)
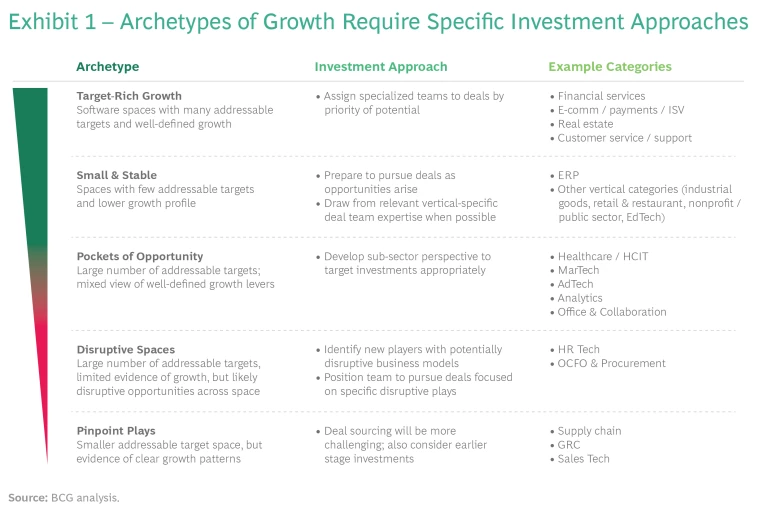
Each archetype calls for a distinct investing approach geared to various horizontal and vertical categories of software. Once investors understand the investing dynamics throughout a category, they can construct their deal sourcing, investment themes, and strategy around the corresponding approach. The archetypes are grounded in patterns of growth, which can be identified using data available through G2 and other public sources. Our discussion will look more closely at the software categories and factors of growth.
A Push for Order in the Business Application Landscape
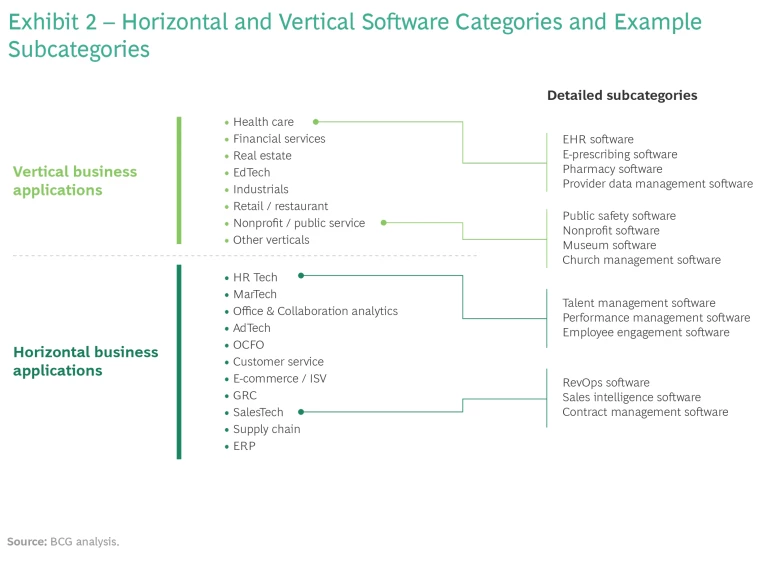
Because categorizing software types can be challenging, we created a basic classification of horizontal and vertical categories. Suitable for use in nearly every industry, horizontal applications are used for functions across the business, such as SalesTech, Enterprise Resource Planning (ERP), or human resources technology (HR Tech) solutions. Vertical applications are meant for specific needs or use cases within particular industries, like insurance claim processing software (InsureTech) or electronic health record (EHR)/Healthcare Information Technologies (HCIT)
This horizontal-vertical arrangement provides a starting point to break down vendors and solutions into even more refined groupings that enable assessments of key growth factors. We put horizontal and vertical business applications into smaller categories using G2’s software taxonomy, which is framed on a highly granular software segmentation. For example, in the horizontal HR Tech category, G2 includes smaller categories like software for talent management, benefits administration, or HR analytics. (See Exhibit 2.)
(For more on our approach, see “Using Public Data to Understand Growth.”)
Using Public Data to Understand Growth
Sales Headcount Assessment
We tested whether there was a link between salesforce headcount growth and other metrics correlated with revenue growth. Merging the G2 data with Revelio sales headcount data, we also found that customer loyalty scores and sales force growth were correlated. The top quartile of companies based on G2 customer loyalty score data had a median salesforce growth of 121% between 2017 and 2021, whereas the bottom quartile had median salesforce growth of 0% (N=1,428).
Size of Investable Universe
Private equity buyers in most software LBOs purchase the acquisition either from other PE firms or from previous venture capital-backed companies. Of the current PE-backed software companies tracked by Pitchbook, ~44% of the previous owners were PE and 43% were previously backed by VC.
We defined an addressable target as companies that are either backed by private equity funding, have raised Series C, or companies that raised Series B more than three years ago.
To elaborate on funding, private equity firms are moving from executing traditional LBOs to investing in minority ownership or VC-style investment—so software vendors with VC backing are likely to be targets of other investment firms. Although traditional majority investment still accounts for much PE investment activity, it is now more common to see minority or non-control investments made alongside other investors. In a survey conducted by Mergermarket of private equity professionals, 85% noted that the level to which their firm targeted minority investments had remained constant or increased over the last 12 to 24 months.
SaaS Adoption
End-market analysis is not a perfect way to understand SaaS penetration among vertical SaaS categories. A large range of different software solutions are included in this penetration analysis. Nonetheless, many vertical software categories are still underpenetrated.
Downmarket Adoption
G2’s database of reviews includes self-reported customer size information, which we reviewed to assess downmarket expansion. We compared the median % of reviews coming from SMB customers within each product category. We used this benchmark to compare both current downmarket penetration (x-axis) with changes in penetration (y-axis), as shown in Exhibit 7.
With software types arranged into subcategories, investors seeking to understand the scope, surges, and ebbs of software adoption can key on several factors that our analysis found to be significant:
- The estimated number of potential targets
- The overall growth pattern of companies within the sector
- Maturity of SaaS adoption within the end market
- Extent of verticalization within the category
- Extent of downmarket software adoption
Assessing each factor sets up private equity firms for several advantages. Leaders can prioritize target opportunities and make more informed decisions when assigning teams to work on quality deals. As staff gain experience completing deals, the firm’s institutional knowledge and diligence efforts become sharper and more evolved. Teams will become more adept at determining if future targets are attractive or lack promise. These assessments can also find areas of a target company that may need improvement—say, inefficient pricing models or go-to-market strategy—which the deal team can prepare to address after the acquisition is complete.
Estimate the Size of the Investable Universe
For sustained success, an investor needs targets—lots of them—but building a suitable roster of promising software companies foils many investors. A team could find that their deal thesis plays out for only a handful of companies; for traditional leveraged buyouts (LBOs), firms identify roughly 16 top-of-funnel opportunities for every one deal
Investors can anticipate customer adoption of a software type if vendors show increased staffing activity in sales and marketing and engineering.
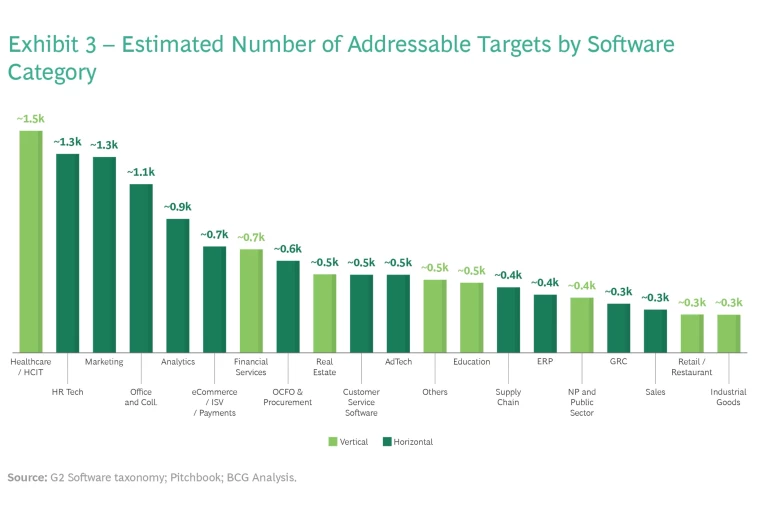
To show where software vendors that could be attractive candidates for private equity backing are gathered in significant numbers—in other words, to estimate the number of potential, addressable investment targets—we started with roughly 13,300 software companies, based on data from Pitchbook and CB Insights. We then further reduced the number of targets in the overall market by looking at business model and funding status. The resulting estimated “universe” of targets is loaded heavily toward prominent software areas like Healthcare and HR Tech. (See Exhibit 3.)
Opportunity does not end there, with clusters of promise throughout the technology space. Verticals that offer plenty of targets are health care and financial services; customers in these spaces have extensive technology needs, and the two areas make up a large share of the overall economy. With this universe of targets in view, investors can then look for noteworthy adoption behaviors and trends throughout each category.
Look at Headcount Growth for Signs of Promise
Growth in the software world is varied and inconsistent. A single category of enterprise B2B offerings will show more than one growth profile. For example, analytics software—fitting the Pockets of Opportunity growth archetype—consists of both business intelligence and data analytics tools, which experience moderate growth, and machine learning and data science products showing faster and more extensive growth.
Growth and adoption of software can also be the result of several different underlying dynamics. Customer IT budgets can change throughout a sector. In the public sector, increased funding may fuel market growth as agencies spend more on government technology (GovTech). Customers are apt to adopt solutions that directly increase business revenue, such as marketing technology (MarTech) or donation platforms in the nonprofit sector. New ways of working often create immediate need for enabling technology, such as workplace management systems. Investors are left questioning if these catalysts are driving meaningful, long-term growth or shorter bursts of adoption.
While company revenue would be an obvious indicator of sustained or slowing market growth, public access to information around a small private company’s revenue is unlikely. However, PE teams can anticipate customer adoption of a software type if the relevant vendors show hiring activity or expanded headcount in two key staffing areas: sales and marketing and engineering.
Assessing Headcount Growth
First, for a set of publicly traded software companies, we found a correlation between aggregate sales headcount growth across a category and potential revenue growth. To scale this analysis, we then leveraged alternative data on sales headcount to apply it to a sample of firms in our G2 dataset.
Sales headcount is not the only metric of growth. Investors can augment this view by monitoring changes in engineering headcount. An increase in design, programming, and related personnel may mean that companies in a category plan to develop new products or features in response to market demand.
We found that certain categories, such as GRC and Supply Chain—which match the Pinpoint Play archetype of smaller numbers of targets and clear growth patterns—feature high headcount growth in both sales and engineering. This data indicates the categories are building new innovative products through engineering hires and driving top-line expansion through sales roles. (See Exhibit 4.)
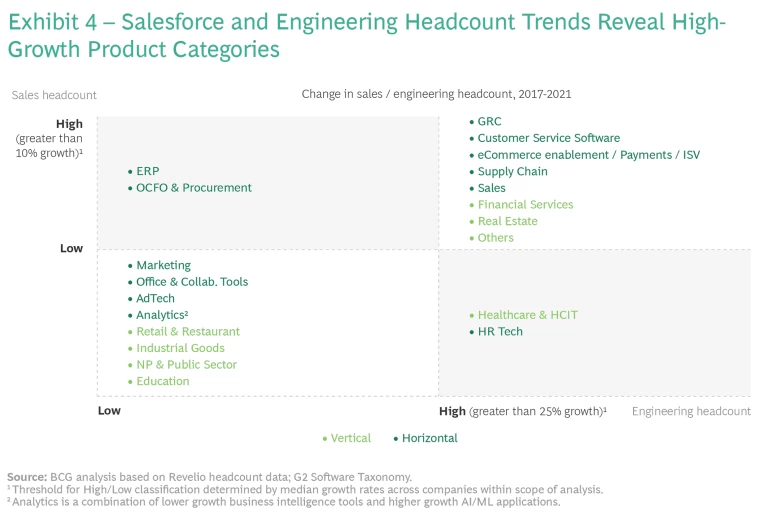
Investors should be alert for various conditions when scrutinizing headcount growth. For example, firms should confirm the type of funding evident throughout a sector, as software vendors with early-stage venture capital backing often focus heavily on product development. These companies will not recruit more outbound sales staff until leaders are convinced that the product fits a clearly defined market. Only then will vendors scale their sales teams to cover the market; for example, many GRC software providers are still ramping sales teams well after a wave of product development moved forward. Investors should also remember that after a market has run through an initial spike of adoption, vendors with sufficient sales staff in place to acquire new customers will curtail sales headcount growth—even if revenue continues to increase. Sales and product headcount become more stable as a category matures and adoption stabilizes.
Analysts must also recognize that the degree of headcount expansion will depend on the vendor’s implementation strategy. Some software types are easier for customers to implement and require less vendor support for deployment and training, limiting the need for sales staff involvement after deployment. However, external sales teams may play a larger role in customer onboarding of technologies like CRM software—fitting the Target-Rich Growth archetype—where increased headcount may mean favorable returns for investors.
Keep Pace with Adoption by Weighing Saas Maturity
The spread of Software-as-a-Service (SaaS) and cloud technology across many areas of commerce continues; however, much on-prem software—which is costly to replace or upgrade—remains in use today. Investors can measure SaaS penetration across horizontal categories to determine where more adoption could still occur. Lower SaaS penetration may mean that companies are still using on-prem software in those categories—where growth could increase as these companies replace the on-prem resources with SaaS solutions.
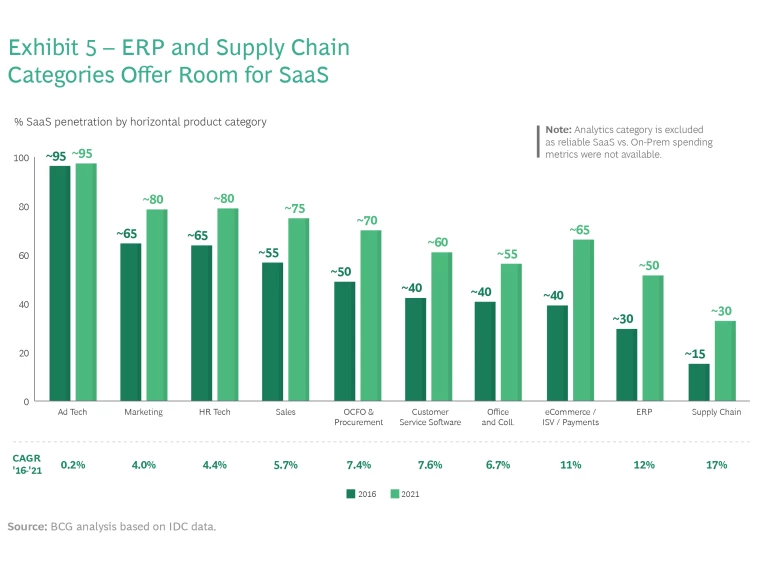
Exhibit 5 shows an estimate of cloud penetration by horizontal categories, derived from IDC data on both SaaS spending and overall software spend within a category. Areas of lower penetration—supply chain and office and collaboration solutions—appear to be horizontal categories where future adoption may occur.
At first, investors may think that plenty of whitespace exists for adoption of newer SaaS resources to replace older on-premises software installations. However, private equity teams should pause where SaaS adoption could be limited to a modest push. Transitions to SaaS from on-prem resources can be small in scale. In government technology, an on-prem incumbent vendor may offer a SaaS solution that includes processes already integrated into the existing on-prem solution. We have also seen this dynamic play out in other spaces—such as Real Estate tech—in which end-customer payment information is integrated with existing systems and transitioning to other solutions is costly. This smaller SaaS engagement would not necessarily translate into the sort of meaningful competitive shift to another vendor that could initiate larger growth in a sector.
The practical aspects of transition may impede adoption. Organizations sometimes balk at the major costs involved in replacing the ingrained workflows and processes that have built up around on-prem installations. IT departments and users do not easily give up the familiar planning and processes of ERP solutions, which slows down the trajectory of SaaS adoption—even if a SaaS model could be more advantageous for a customer to use in the long run.
Watch for vertical growth where newer entrants’ solutions offer unique use cases, bespoke features, or functionality—which larger horizontal platforms do not always match.
Take the Measure of Vertical Specialization
Observers may think that vertical adoption of small solutions would be unlikely, as some of the world’s largest technology vendors address specialized use cases with horizontal solutions. However, a smaller vendor’s vertical expertise is often a convincing selling point to B2B customers with specific needs. For example, a vendor offering a customer relationship management solution designed for use in the fitness industry may compete for share against a larger, more generalized CRM offering by providing unique features such as class scheduling or POS integration.
Private equity teams should watch for this type of vertical growth that gains force wherever newer entrants set apart their solutions by offering unique use cases, bespoke features, or functionality, which larger horizontal platforms do not always match—and which specialty vendors often know well.
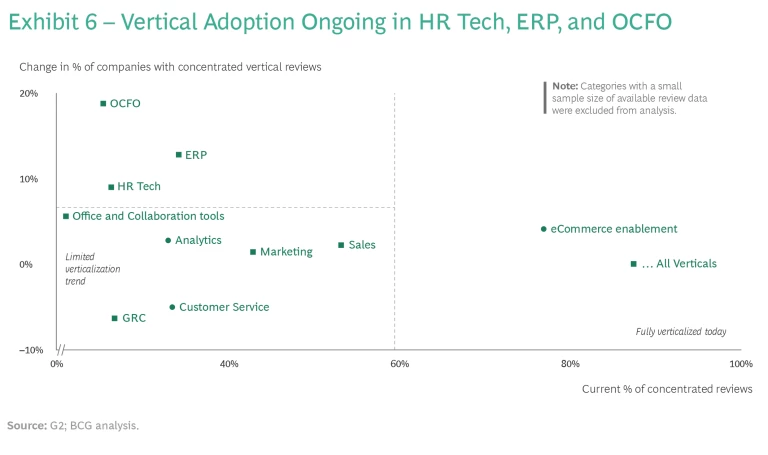
To assess how products are moving into vertical markets, we looked at G2’s database of product reviews for feedback from customers to see if reviews were showing up more consistently within verticals or across categories. If we saw a pattern change from customer reviews in a broad array of industries to reviews in only a few verticals, we identified increasing activity and adoption within a vertical. (See Exhibit 6.)
Several drivers explain the vertical adoption appearing in a handful of subcategories. Within OCFO (Office of the CFO), specific verticals such as retail or fashion often have much more complex planning requirements that necessitate a custom application. While ERP solutions have often used a universal data and workflow toolset, more and more ERP products are built with specific business management workflows in mind—for example, the processes found in equipment dealerships or industrial factories.
Another example of vertical growth is found in HR Tech, which we frame in the Disruptive Space archetype. While horizontal HR offerings often deliver more general functionality, many companies have specific people management needs as employment conditions evolve. In response, more customers are buying specific HR Tech solutions to serve specific types of workers or requirements, such as skilled tech professionals or compliance with employment regulations.
Look Downmarket for Growth Potential
To try to capture a sector’s total addressable market (TAM), software companies also move downmarket, adjusting their product and pricing model to meet the needs and capabilities of small and medium-sized businesses (SMBs).
Established enterprise-level B2B providers commonly try to expand their TAM by going after smaller customer segments. However, this strategy doesn’t reap rewards for all incumbents. Smaller businesses are often less sophisticated in their technology usage, and they tend to move slowly when adopting software. A vendor selling enterprise software that requires major post-implementation support or customer training will lose money guiding downmarket customers. Private equity investors stand to realize more wins with targets offering SaaS-native architecture that can be deployed quickly with less professional services support.
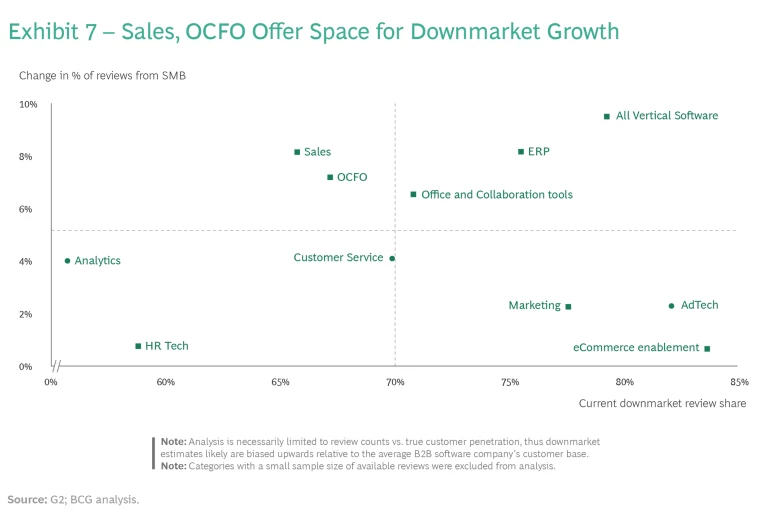
To assess movement in downmarket penetration, we analyzed median percentage of G2 reviews from SMB customers within each product category. If we found an increase in SMB reviews, we concluded that adoption and downmarket traction had grown. For example, Sales Tech, OCFO, and collaboration tools have seen increasing adoption, with plenty of whitespace still available. HR Tech and analytics show more stability and less growth downmarket. (See Exhibit 7.)
Opportunity certainly exists downmarket, but the scale of downmarket adoption is much smaller than the growth of analytics, HR Tech, or customer service solutions across numerous sectors. Legacy incumbent software vendors often struggle to migrate downmarket absent mergers or acquisitions. In certain verticals, horizontal platforms gain traction with smaller customers by offering very simple-to-use functionality to serve the basic needs of the vertical in a cost-effective way.
Framing patterns of growth into a set of archetypes is key to designing the investment style for a software category.
Conclusion
Software holds rewards for any investor who can find advantages in the mass of solutions, products, and services that will continue to power business for years. Investment strategy, then, must be built on rigorous analysis that goes beyond instinct and intuition. Using data sources that illustrate the way B2B customers are adopting software allows investors to more effectively understand patterns of growth. Framing these patterns in the right growth archetype is a key step in designing the firm’s investment style for the software category. The guidance that we offer here allows private equity investors to prioritize targets and build greater confidence in where they choose to invest.


