Industrial policy is back. After taking a laissez faire approach to growth, policymakers now realize that building a future-proof economy requires a bigger government role. That includes partnering with the private sector to create thriving economic clusters around fast-growing industries.
This article is part of a series of BCG’s best thinking about how to create an economic growth plan driven by industry clusters. In this piece we tackle key questions including how governments can decide which business clusters to back—and which strategies work best.
Why Clusters?
In the hyperconnected world we live in, economic success depends less on natural resources and location and more on nurturing economic clusters built around promising technologies. Germany’s Upper Bavaria region with its robust automotive and engineering clusters, Denmark with its concentration of thriving cleantech companies, and Israel's cybersecurity, AI, and fintech clusters exemplify the success of this approach.
As the growth of these regions shows, achieving critical mass around cutting-edge technologies is the new imperative to building long-term prosperity. These success stories also demonstrate the value of industrial policy, particularly in support of economic clusters. But for governments seeking to emulate such successes, how do they identify which industries to invest in and support? Equally important, how do they ensure the supply chains supporting these clusters are resilient and secure?
Achieving critical mass around cutting-edge technologies is the new imperative to building long-term prosperity.
Fortunately, there are road maps that can guide economic planners on their journey, as we show in this article.
For many governments, building a national clusters strategy requires a different mindset from the economic development strategies they used in past decades. The traditional sector approach—providing incentives to areas like manufacturing that share related activities—often benefited just the companies in that sector. Then there are clusters, which are groups of interconnected companies and institutions in a particular field that are geographically concentrated. Unlike sectors, a cluster approach aims to create greater synergies and unlock support from companies throughout the full stakeholder ecosystem.
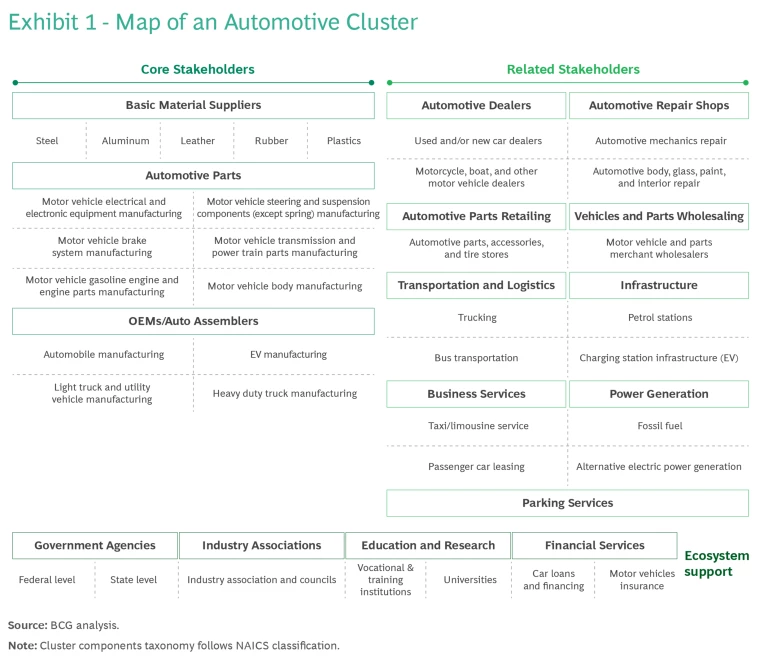
For instance, to establish a thriving automotive cluster today requires more than financial and fiscal subsidies. It also means supporting car manufacturers with essential resources such as a strong transportation infrastructure, green energy, shipping facilities, financing tailored to the auto industry, job training programs, and a base of reliable local auto-parts suppliers. If you succeed, you get a thriving economic engine, as Exhibit 1 shows.

As different as fintech, cleantech, and edtech are, successful clusters like these have more in common than you’d think: most benefit from geographic proximity and critical mass, which includes having a tight-knit group of stakeholders with both local and international reach. Most are complementary, featuring multisector ecosystems that share products, skills, and technologies. And most well-run clusters balance collaboration (such as joint R&D) with competition (vying for the same customers).
The power of the cluster approach is evident across different continents of the world. For instance, the Basque clusters in Spain helped the Basque Country region achieve impressive economic growth, including a 41% GDP growth, 20% increase in productivity, 7% increase in exports, and 6% decrease in unemployment rates in the first 20 years of operation. As a result, the Basque clusters outperformed the rest of Spain by one percentage point per year on GDP growth.
Similarly, the Singapore Biopolis cluster, which focuses on biopharmaceuticals, has been the source of 950 patent filings annually, the establishment of eight out of the ten largest global pharmaceutical companies, the creation of approximately 7,500 jobs, and an increased GDP contribution of pharma to 3% of Singapore's economy.
Identifying Clusters with the Most Upside: A Technical Approach
Most countries do not measure their economic data on a cluster level. Instead, their attention is too often at the sector level, treating companies within, say, the manufacturing or transportation sectors as the same. But by focusing their efforts on clusters—and then creating an environment that fosters innovation, attracts talent and investment, and builds resilience—economic planners can create a virtuous cycle of growth and success. To effectively pursue economic development through the cluster approach, countries must adopt a four-step approach to determine which clusters to prioritize.
The first step in building a cluster strategy is to analyze the subsectors in an economy based on quantitative data, and then rank the sectors and subsectors that hold the most promise for a particular region.
1. Identify strongest subsectors quantitatively. The first step in building a cluster strategy is to analyze the subsectors in an economy based on quantitative data, and then rank the sectors and subsectors that hold the most promise for a particular region. (For the purposes of this exercise, sectors are areas of the economy such as manufacturing that share related activities; subsectors are subsets such as pharmaceutical manufacturing; and clusters represent a group of interconnected companies and institutions that are geographically close. Clusters can include many economic subsectors.)
The quantitative analysis can be applied at the subsector level, following three criteria and eight indicators to rank the best subsectors to anchor the economy over the next five to ten years. The three criteria consist of:
- Current economic contribution, representing the existing presence and activity of the subsectors. This includes not only the cluster’s contribution to GDP but also its success at creating skilled jobs, value-added economic activity, and exports.
- Historical investment, which measures past investments and the accumulated fixed capital. This measurement also looks at the allocation and growth of investments, including by international financiers.
- Export potential to the country’s top ten trading partners, and whether that will boost economic output.
When completed, this quantitative analysis identifies clusters that have enough presence to attain economic growth in five to ten years.
After identifying the best indicators for the criteria, the next step is to identify the relevant data, which must come from reliable sources.
After identifying the best indicators for the criteria, the next step is to identify the relevant data, which must come from reliable sources. Data needs to be mapped to International Standard Industry Classification or a compatible format that, like ISIC, uses numerical codes to group businesses by their primary economic activity. Compatible formats include the North American Industry Classification System (NAICS), Standard International Trade Classification, and the Harmonized System.
Once the indicators have been finalized and the data sources have been identified, then the identification process can begin. In this model, there are four steps that can take the data from its original form to the end result:
First, we start by making the data easier to work with by converting it into an ISIC format.
Second, the data goes through an analysis. This involves listing and comparing measures for each category, making them easier to understand by scaling the scores from 0 to 10, based on the highest and lowest values for that category. Take, for example, the contributions from foreign direct investment (FDI). If the highest contribution in one year was 30% and the lowest was 2%, then a subsector that received 17% of FDI would receive a score of five, since it is in between the highest and lowest values.
Third, after the analysis the scores are combined using weights that the user provides. These weights are important because they reflect the importance placed on different factors. For example, if planners are focused on the next five years, then subsectors making strong economic contributions today will be given more weight. Finally, subsectors with the highest scores are classified as "priority subsectors," indicating their potential upside.
In the fourth step, the high-scoring subsectors are classified as “priority subsectors.”
2. Map priority subsectors to their relevant clusters. The second step in identifying the most promising clusters is to map the top subsectors to their relevant clusters. Fortunately, there are road maps that can help. For example, Harvard Business School’s Michael Porter and the US Cluster Mapping Project created a taxonomy of 67 economically important clusters in the United States. While this project focused on US industries, the principles and methodology can be easily adapted for use in other regions around the world.
Of the 67 clusters Porter identified, 16 were classified as “local” and the other 51 as “traded” or “tradable”—meaning that they sell locally, nationally, and even internationally. (Note that clusters can have a local and a tradable equivalent: for instance, there is a local motor vehicles cluster as well as a traded automotive cluster.) The methodology for traded and local clusters is explained on the US Cluster Mapping Project website.
Each of the 67 clusters covers multiple sectors and multiple subclusters. For instance, the Cultural and Educational Entertainment subclusters encompass many clusters including art dealers; museums; historical sites; zoos and botanical gardens; and more.
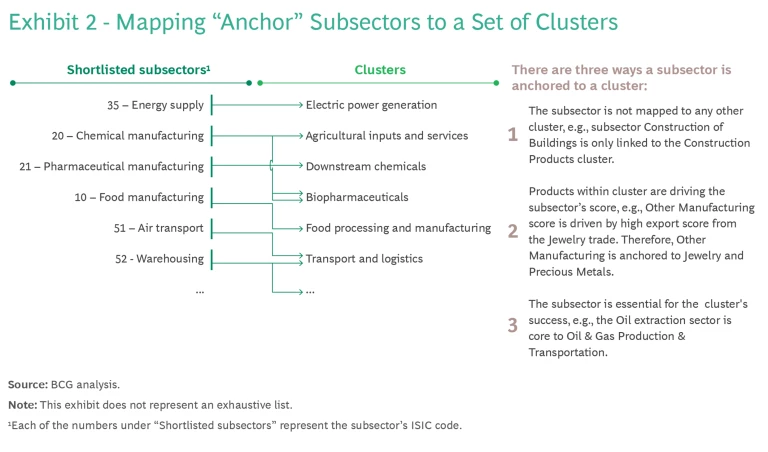
The priority subsectors serve as “anchors” for specific clusters and can be identified through the methods described in Exhibit 2. The outcome of this exercise is the identification of clusters with potential that map to these anchor subsectors.

One way to determine every cluster’s potential is to conduct a qualitative analysis of clusters with the best—and worst—competitive advantages.
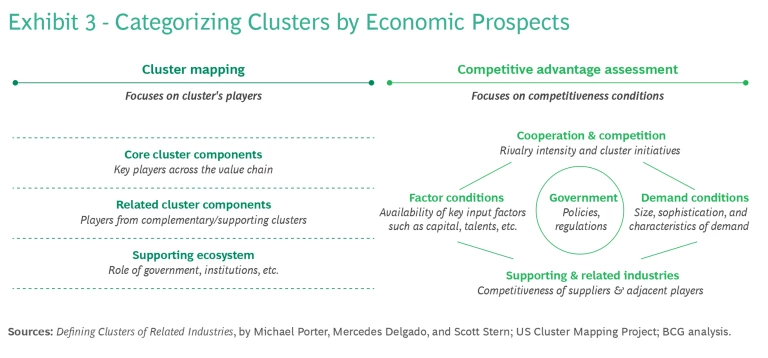
3. Assess clusters by their economic potential. Next, categorize clusters by their economic prospects. Here, economic planners can create two groups—one for clusters whose economic contributions have been strong, and a second for clusters that show limited potential. One way to determine every cluster’s potential is to conduct a qualitative analysis of clusters with the best—and worst—competitive advantages. As Exhibit 3 shows, this analysis consists of two assessments: cluster mapping and competitive advantage assessment.

- Cluster mapping provides a snapshot of the stakeholder landscape focusing on the cluster’s key players across the value chain. (An example is the Automotive cluster shown earlier in Exhibit 1). The cluster mapping exercise examines the contributions of players from the complementary clusters, and the role played by governments, financial institutions, and other members of the supporting ecosystem.
A competitive advantage assessment measures the comparative edge that nations, as well as clusters, possess based on the resources available to them. Building on the Porter Diamond Model, this assessment provides a visual demonstration of how governments can act to improve a country's position in the global economy.
Competitive advantage assessments incorporate a variety of factors, including: the level of cooperation and competition among the ecosystem participants; size and sophistication of potential market demand, both domestically and in key export markets; availability of key inputs such as the pool for skilled labor; competitiveness of the adjacent sectors that will support the industry cluster; and the level of government support, including key policies, regulations, and financial instruments supporting the cluster’s growth.
4. Categorize clusters. The final step is to categorize clusters into:
- Mature clusters, which are competitive, have well-developed constituents, and already make sizable contributions to the economy.
- Emerging clusters, which contribute economic growth but need to fill in minor gaps in their competitiveness and supporting ecosystem. The mature and emerging clusters enjoy enough upside that economic planners should prioritize their future growth.
- Nascent clusters that, despite their strong constituencies, are limited in the economic contributions they can make.
- Deprioritized clusters, which lack the natural resources to be competitive outside their home markets. Economic planners can also deprioritize clusters that:
- lack the natural resources to succeed;
- suffer from shrinking demand––for instance, global coal demand is forecast to plateau in the next few years before declining;
- cannot be traded in other countries; and
- do not support national priorities––for instance, in countries with antismoking policies, that could mean deprioritizing the tobacco cluster.
Cluster Strategy: Setting Priorities for the Next Half-Decade
Identifying the clusters with economic potential is just the first step. With limited resources and the long lead times required to enact new policies, most countries must take a strategic approach to cluster development. They need to focus their efforts on a select few standout clusters. Attempting to develop all mature and emerging clusters simultaneously is unrealistic.
The number of priority clusters varies by country and depends on two main factors: the country's stage of development and its track record in cluster creation.
The number of priority clusters varies by country and depends on two main factors: the country's stage of development and its track record in cluster creation. Developing countries typically focus on fewer clusters, as their private sectors are less mature and require more government support. Countries new to cluster development also start smaller, with a cautious pilot approach, and expand over time as their expertise grows.
In general, developing countries start with a small number of clusters. For instance, Denmark, Singapore, Vietnam, and Italy all started with four to five clusters before scaling up as their economic capabilities became more robust. (By comparison, developed countries, with their access to greater resources, can afford to focus on ten clusters or more.)
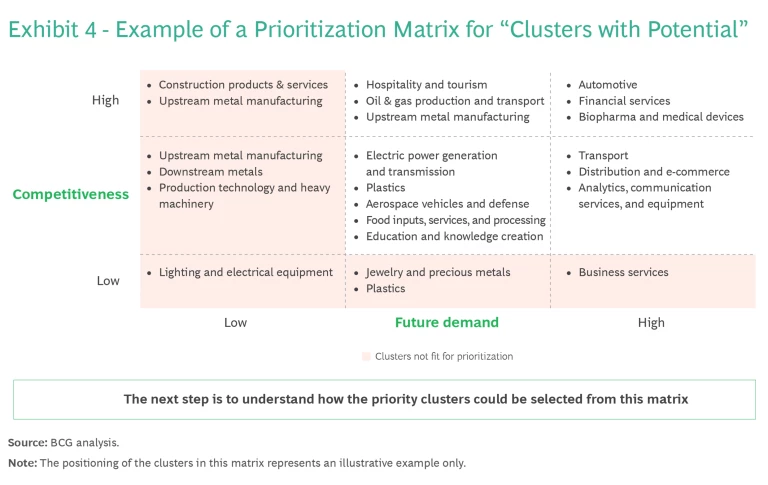
The first step in the prioritization exercise is to plot clusters with potential on a 3x3 prioritization matrix consisting of two considerations: competitiveness and future demand. (See Exhibit 4.) Competitiveness uses the qualitative results of the “cluster mapping” and “competitive advantage assessment” exercises described earlier to measure how well-positioned a country is to develop robust clusters. Mature clusters typically score highest in these exercises, with emerging clusters usually earning medium or low scores. The second consideration—future demand—considers the regional and global outlook measured by market size, trade and investment flows, and other relevant megatrends.

Clusters in the upper right quadrant of Exhibit 4, with high competitiveness and demand, show the most promise. Those in the lower left need more development. This matrix guides strategic focus, developing opportunities with the largest potential impact first while building up others over time.
Once clusters are plotted on the matrix, decision makers can choose priority clusters from this selection. Three primary strategies emerge: the mature focus, emerging focus, and balanced focus. Each of these strategies comes with different risks, rewards, and timelines. For instance, the mature focus carries lower risk and can usually produce economic results within five to seven years. By contrast, the emerging focus carries higher risk and takes a decade or longer to deliver impact. A balanced focus lies somewhere in between in terms of timeline and the tradeoffs in risk and reward.
Which approach a country chooses often depends on its preference for economic growth versus diversification. It can also reflect the political dynamics between nations, including one country’s desire to reshore production to boost employment and reduce its dependence on other countries for sensitive technologies.
The mature clusters focus maximizes short-term economic growth (usually for the next three to five years) by concentrating on established clusters already generating substantial impact. The primary drawback is that this approach overlooks the potential for economic diversification by excluding emerging clusters. This can limit the range of industries that contribute to economic growth.
For instance, Norway chose to concentrate on its top national mature clusters, such as Blue Maritime (ship and vessel building), Ocean Technology (subsea installation), and the oil & gas, offshore, energy, and other maritime services offered by the 100 companies that comprise its GCE NODE cluster. By doing so, the country strengthened its already leading maritime cluster (but may have missed opportunities to develop other emerging sectors such as renewable energy).
The emerging clusters focus maximizes economic diversification by supporting clusters that have not yet reached a high maturity stage of development and economic impact in the country.
The emerging clusters focus maximizes economic diversification by supporting clusters that have not yet reached a high maturity stage of development and economic impact in the country. While enabling longer-term potential (ten or more years), it may sacrifice some short-term growth. But this approach is often the only option for developing countries without mature clusters. Taiwan's decision to develop semiconductors illustrates an emerging-cluster focus that worked well. While Taiwan lacked many of the resources available to companies in markets such as North America and North Asia (Japan, Korea), Taiwan today ranks as the world’s leader in semiconductor manufacturing.
The balanced clusters focus is the most widely adopted approach. By selecting a mixed portfolio of mature and emerging clusters, it enables cities and states to nurture both stable mature clusters with riskier emerging clusters that offer the biggest rewards. Countries including Germany, Netherlands, and Canada have opted for the balanced approach. For example, Saxony (with the eighth-largest gross regional product of Germany’s 16 states) pursued a balanced strategy by focusing on microelectronics where it has a strong competitive advantage, while exploring the clean energy and renewables sector where its comparative advantage isn’t as apparent.
Planning, Patience, and Prosperity
The success of Taiwan, Munich, and Singapore demonstrates how clusters can serve as powerful drivers of economic development. Their distinct features—geographic proximity between stakeholders, complementary products and services, a blend of collaboration and competition, and a focus on a diverse stakeholder ecosystem—can boost an economy's productivity and speed its transition toward a knowledge-based economy built on high-quality jobs.
To fully realize these benefits, governments must choose their cluster investments very strategically. This process begins with an evidence-based analysis that identifies promising clusters and weeds out weaker ones. Evaluating the future global demand for a cluster’s services provides additional confirmation of clusters with the greatest potential.
It is important to understand, however, that the final step in cluster selection is not one-size-fits-all. There is no universal approach for identifying the best clusters. Each country must start by conducting a rigorous analysis, evaluating the prospects of potential clusters, and then aligning on the priorities of its most important stakeholders. But with foresight, patience, and the willingness to invest the appropriate resources, the cluster approach can foster growth, employment, and prosperity for decades to come.


