The five-year period ending on December 31, 2022, was sobering for the global chemical industry . The industry’s overall worldwide average total shareholder return (TSR) was 7% from 2018 through 2022. For the previous five-year period, the TSR had been 12%. The 2018–2022 figure represents the chemical industry’s worst five-year shareholder performance the since 2008–2013. Moreover, nearly all of the decline took place from June 2021 to December 2022.
Investors are still trying to figure out whether the TSR decline is a temporary shock or a new normal for the chemical industry and what it will take for shareholder value to bounce back. Yet experience tells us that the industry is highly resilient, and already it seems to be adapting to the strong headwinds it is facing.
Among the recent challenges are the war in Ukraine and its ancillary shortages, inflation and rising interest rates, energy price volatility and higher costs, sudden decreases in demand, and increasing regulatory pressure around sustainability, particularly in Europe. The industry is largely committed to reducing carbon emissions—an expensive but necessary transition. In addition, the distance between the companies with the highest TSR and those with the lowest TSR narrowed, a sign that structural factors are affecting many companies, regardless of their strategic position or managerial and technological excellence.
The chemical industry was not alone in facing adverse conditions. Indeed, it outperformed the average TSR for all industries, which dropped in 2022 from 12% to 5%. That is not much consolation, however. All geographies except emerging markets were affected, and so were all five industry subsectors: agrochemicals, base chemicals and basic plastics, focused specialties, industrial gases, and multispecialties. Unfortunately, we have seen few signs of improvement so far in 2023: the industry’s TSR did not rebound in the first half of the year.
Nonetheless, we remain firm believers in the chemical industry’s ability to weather the storm. While TSR has fallen overall, it remains high in a few geographies such as India, Switzerland, South Korea, China, and the Middle East. Furthermore, some high-flying product categories—such as electronic chemicals, fertilizers, and industrial gases—have prospered by focusing on a specific market with strong demand. Notably, top TSR performers exist in every region and subsector, generally distinguished by their approach to business and operations.
The focus of this year’s Value Creation in Chemicals report is on the trends affecting the industry, and the ways in which they vary by geography and subsector. We will look at reasons for concern along with bright spots, and highlight factors that may lead to stronger performance in the future. (See “How We Calculate and Report TSR.”)
How We Calculate and Report TSR
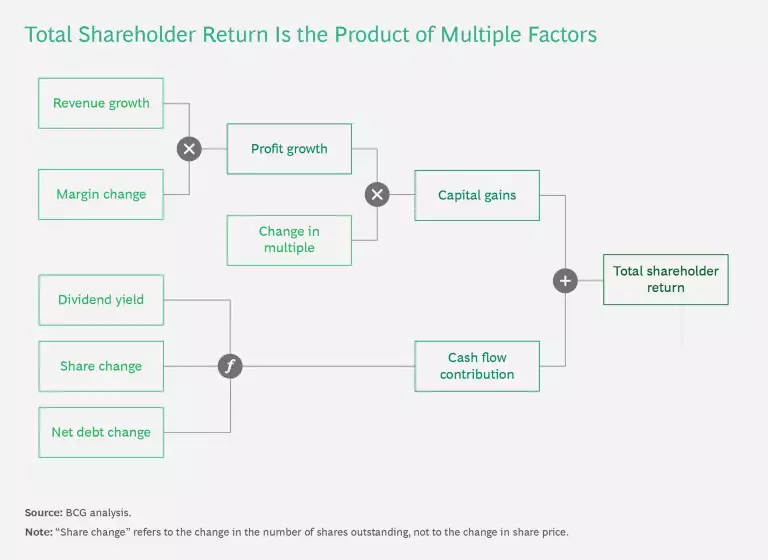
Multiple factors affect TSR. Readers of BCG’s Value Creators series may be familiar with our methodology for quantifying the relative contributions of the various components of TSR. (See the exhibit.) We use the combination of revenue (sales) growth and change in margins as an indicator of a company’s improvement in fundamental value. We then use the change in the company’s valuation multiple to calculate the impact of investor expectations on TSR. Together, those two factors determine the change in a company’s market capitalization. Finally, our model also tracks the distribution of free cash flow to investors and debt holders—in the form of dividends, share repurchases, and repayments of debt—to determine the contribution of free-cash-flow payouts to a company’s TSR.
All of those factors interact—sometimes in unexpected ways. A company may increase its earnings per share through an acquisition and yet create no TSR if the acquisition erodes its gross margins. Moreover, some forms of cash contribution (such as dividends) can impact a company’s valuation multiple differently than others (such as a share buyback); the effects are complex.
In this report, the TSRs used for groups and for purposes of comparison are generally medians. The TSRs associated with individual companies are straight calculations of those companies’ capital gains—changes in share price value plus dividend value—rounded to the nearest percentage.
Investors Switch to Large-Cap Companies
Each year, we explore the changes in shareholder value, as measured by five-year annual TSR, for companies in the chemical industry whose market value exceeds $1 billion. For the current assessment, covering 2018 through 2022, 326 companies qualified. This number is slightly lower than the one in our previous report, which covered 338 companies over the 2017–2021 timeframe. We excluded Russian chemical companies from this year’s assessment because of the Ukraine war, and we excluded Turkish chemical from it because of hyperinflation in that country. Both of these factors make data comparisons extremely difficult.
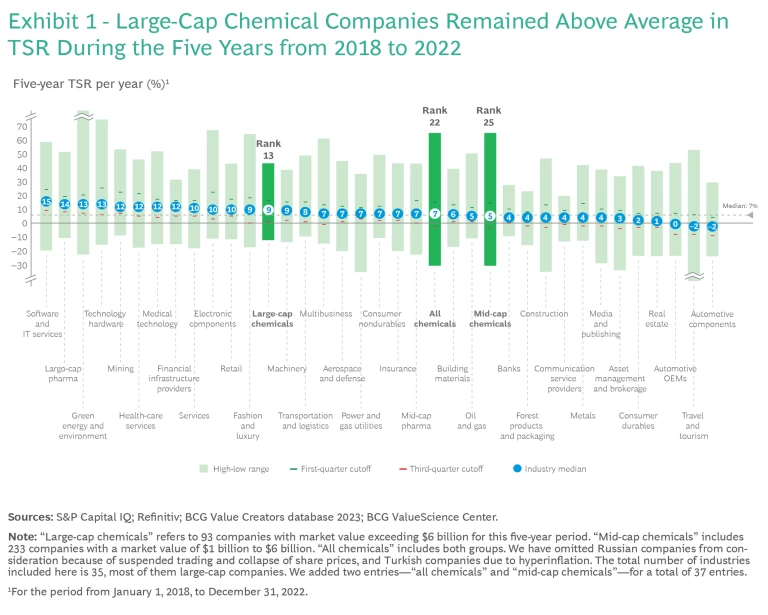
As in previous reports, we have singled out large-cap chemical companies—those with a market value of more than $6 billion—for comparisons with other industries. We generate these metrics with BCG’s long-established Value Creators database. There are 93 large-cap chemical companies in this year’s report, up from 79 in last year’s report. This indicates that, even in a turbulent market, 14 former mid-cap companies crossed the $6 billion threshold. Another hopeful note is that the chemical industry remains above average in average five-year TSR, ranking in the top 40% of the 33 major industries that we track. (See Exhibit 1.)
Nonetheless, the large-cap results slipped from their previous ranking of 7th among 33 major industries for the 2017–2021 period, to a ranking of 13th for the 2018–2022 period. Their average shareholder returns per year dropped from 19% to 9%.
Mid-cap chemical companies fared even worse. Their TSR dropped from 10% to 5%, marking the second five-year period in a row in which large-cap companies outperformed mid-caps—a reversal from previous reports, where mid-cap companies generally did better.
This trend may turn out to be a sustained shift, and several factors may explain it. First, scale can provide operational efficiencies, and this is particularly important when supply chains are in flux. Functional excellence is also easier to achieve at large scale. Larger companies can more easily manage regulatory burdens, which seem likely to increase for chemical companies, and they have more resources for sustainability-related investments. They are less vulnerable to inflationary costs, too. Still, these factors may not help all large-cap companies. For example, as a group, multispecialty companies did not fare well in this five-year period, even though they tend to be relatively large.
A Storm with Many Headwinds
Exhibit 2 shows in stark terms how the chemical industry has fared during the past five years. It plots regions versus industry subsectors, with positive average TSRs shown in green (if they’re above 10%) or gray (if they’re relatively flat). Red circles represent the subsector-region combinations where TSR declined.
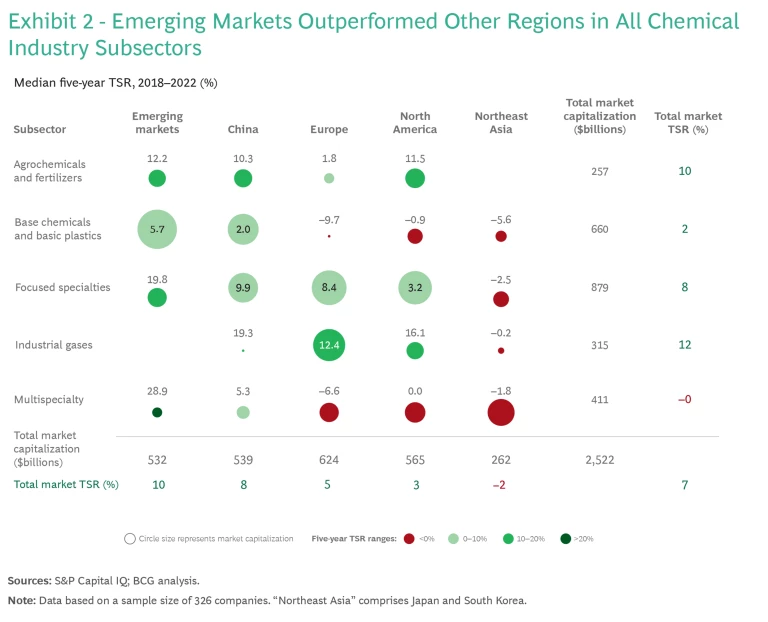
The shock affected just about the entire industry. Indeed, the decline in TSR in eight regional subsectors, all in mature economies, is unprecedented in the industry since we began this series of studies in 2010. Only a few product categories—electronic chemicals, industrial gases, and fertilizers—delivered average TSRs over 10%, with all three below 13%.
Multispecialty companies and base chemicals and basic plastics, in particular, were adversely affected. Geographically, the chemical industry struggled most in Europe, North America, and Japan. One bright spot for Europe and North America was industrial gases, a relatively small group of companies that includes Linde, Praxair, and Air Products.
The best overall TSR performance came from emerging markets, a geographic group that includes South Asia, Latin America, Africa, and the Middle East. India, at 23%, was the only country with average TSR above 20% (23%) and it was followed by Switzerland, averaging 12%. The two countries with the largest-volume industries, China and the US, averaged 8% and 3%, respectively.
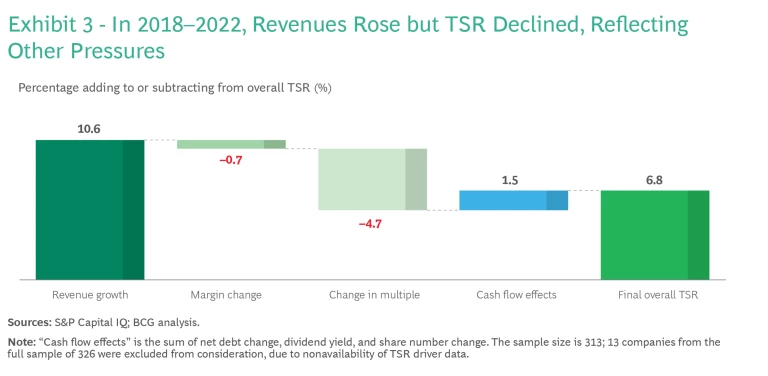
Exhibit 3 offers clues about the business fundamentals underlying these results. The exhibit breaks down the average TSR for our roster of 313 chemical companies according to the impact of key drivers of shareholder value. The left-most column shows revenues rising rapidly—more rapidly than in any previous five-year period since 2011. Revenues contributed 10.6% in shareholder value between 2018 and 2022, compared to 9% in the previous period of 2017–2021.
Unfortunately, several other factors helped pull TSR down. First, worldwide demand for chemical products and raw materials is slowing. One strong indicator of this is the fact that chemical production volume in Europe has declined for two consecutive years, in 2021 and 2022—a phenomenon we have not seen previously in these reports. This suggests that the rise in revenues reflects price inflation, at least to a small extent. Another indicator is the ever-growing number of sales and profit warnings from global chemical companies in recent months. We also see higher-than-expected chemical inventories.
Because it supplies virtually all other industries, the chemical industry tends to be highly responsive to changes in the global economy. For example, as rising interest rates slowed construction in categories ranging from wind turbines in the UK to residential buildings in China, demand for materials also fell. In addition, there is a demand ceiling in geographies with aging populations such as Japan, South Korea, and Western Europe. People there have less need for automobiles, home improvement, or personal care products. The extent of this demand ceiling is not yet clear, but for now, at least, it seems to be having a dampening effect on TSR.
Another major factor in the decline in TSR was the volatility of supply and demand—imbalances generated by the turbulence of the pandemic and its lockdowns, together with a rapid reduction in building and infrastructure construction. There were also some periods of extreme shortages in product categories such as medical equipment and paints. Chemical companies responded by quickly ramping up production, often to see demand fall again.
The second column of Exhibit 3 shows that margins were squeezed, leading to a small loss in TSR (–0.7%). General inflation played a role here, especially for companies that had deferred investment and were then adversely affected by debt. Production costs increased for most companies, and the volatile prices of fossil fuels had varied effects—benefiting companies in Asia, for example, but hurting those in Europe. Supply chain costs have risen, too, as many of the pandemic’s disruptions remain unresolved, and as logistics have generally shifting from global to more local footprints, even for complex products like batteries.
An even larger decline in multiples, shown in the third column of the exhibit, reflects investor concerns about overall market conditions and margin effects, along with other uncertainties about the future. The Russian invasion of Ukraine added immeasurably to geopolitical tensions and further disrupted supply chains, which were already weakened by the pandemic. No one knows how long that conflict will last. Fluctuations in supply and demand may persist for some time.
Potential investors in this industry are also factoring in the costs of sustainability and decarbonization efforts, which are driven in large part by government regulation and market pressures. Shareholders are also concerned about regulatory shifts that might affect costs—proposed limits on polyfluoroalkyl substances under the US Toxic Substances Control Act, for example, and limits on food additives in the European Union.
Cash flow effects, shown in the fourth column, represent the sum of financial factors: net debt change, dividend yield, and changes in the number of shares. The annual rise of 6.8% in these effects over the period from 2018 to 2022 is about half that of the previous five-year period. We attribute this relatively low growth, in comparison with previous reports, to inflation and other effects of a generally dismal year.
Regions: A Bright Spot in Emerging Markets
The problems of 2018–2022 were not distributed evenly. A few geographies—most notably Germany, Japan, Australia, and East Asia—endured the most dramatic declines in TSR. Other industrialized geographies experienced flat or modest growth. (See Exhibit 4.)
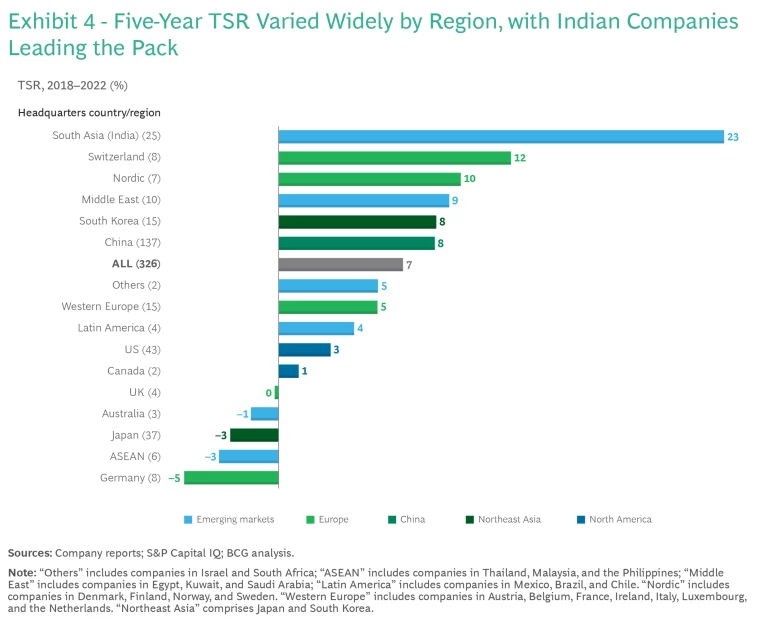
With the mature consumer markets hitting a demand ceiling, the greatest sources of growth for the chemical industry are emerging economies—particularly South Asia. (This year, all South Asian mid-cap and large-cap chemical companies are headquartered in India.) The average TSR in 2018–2022 was almost twice for chemical companies in South Asia (23%) as for those in Switzerland, the next highest geography at 12%.
The average Indian chemical company has positive multiples and a steady cash flow. India’s growing base of wealth and its expanding middle-class population support steadily expanding local demand for consumer products, construction, and ultimately chemicals. At the same time, India still has a very low asset base, consisting mainly of base petrochemicals, pharmaceuticals, fine chemicals, intermediates, agrochemicals, fertilizers, and dyes and pigments. All of this adds up to a market with very healthy growth prospects.
It has taken years for India to develop a chemical industry that can meet domestic demand. Overall, industry revenues have increased by more than 6% annually since 2012. This decade of relatively steady, rapid, compounding growth has solidified the chemical industry’s influence and presence in India. The government provides financial incentives for launching manufacturing operations in several industrial sectors that the chemical industry supplies: automobiles, pharma, and electronics. These incentives also apply directly to the chemical industry. In addition, the government explicitly encourages and subsidizes new industrial parks that include this industry. More generally, it has instituted regulations to make doing business easier.
Other geographies with higher-than-the-median average chemical company TSRs include Switzerland at 12%; the Nordic countries in Europe, averaging 10%; the Middle East, at 9%; and South Korea and China, each at 8%. (The median for all chemical companies was 7%.) The chemical industry is often a harbinger of the future of business in general, so its strong TSR performance in India and the Middle East may signal accelerated industrialization in those areas.
For Switzerland, one key factor may be the presence of specialized companies such as Bachem, the only European chemical company among the top 10 in TSR performance. Bachem is a market leader in peptides and oligonucleotides. It has maintained its TSR ranking by consistently investing to capture market growth and expanding its manufacturing capacity.
South Korea is home to 15 chemical companies whose market value exceeds $1 billion, and most of them have ties to growing and profitable product categories such as battery materials, electronics, or life sciences. Meanwhile Japan’s 37 companies in the large-cap chemicals category faltered, delivering an average TSR of –3% over this five-year period.
Although China had the strongest chemical industry revenue growth of any geography, highly deflated multiples kept TSRs down. Investors were aware that the softening Chinese economy has caught some Asian chemical companies off guard. Less vigorous construction activity is affecting many chemical and materials manufacturers—for example, those that make PVC and other plastic materials. In addition, shifts in global supply chains have affected the Chinese market for raw materials. Until recently, 70% of the chemical industry’s worldwide growth had been projected to come from China. Today, the expected figure may be lower. Finally, the Chinese chemical industry’s weakening TSR performance may lead to a softening of foreign investment in the country.
Nevertheless, China had some strong TSR performers in the most recent five-year period. SKHSU is an example of a Chinese chemical company that has demonstrated active TSR performance management. This focused specialty company, which makes paints for Chinese builders and home improvement buyers, has distinguished itself by linking business performance to a clear strategic narrative—in this case, around sustainability. The company follows a carbon reduction regime and has released its own environmental, social, and governance report. Revenues increased by 22% in the first half of 2023, indicating one path to growth.
Subsectors: A Turbulent Year for the Unfocused
Since 2012, when BCG began publishing value creator reports on the chemical industry, the rising market value of focused specialty companies has been a consistent theme. This report once again confirms that finding. Even in a turbulent five-year period, in which large-cap companies improved as a group, the two overall lowest-performing industry subsectors remained base chemicals and basic plastics and multispecialty companies.
Global TSR for base chemicals and basic plastics players was just 2%. In Europe, North America, and Northeast Asia (Japan and South Korea), base chemicals and basic plastics recorded negative TSRs. This reflects an increasingly challenging competitive and regulatory environment. Fortunately for the subsector as a whole, these economically mature geographies represent a relatively small industry footprint. The companies are predominantly centered in emerging markets and in China, where their overall TSR performance was fairly stable, albeit just above 5%.
TSR performance for multispecialty companies was still lower: 0% returns over five years. Here, again, the most dramatic declines occurred in Europe, North America, and Northeast Asia, which happen to be the home regions of nearly all of the companies in this category. ≈ Their –7% TSR in Europe is unprecedented. Never in the 12 years of publishing this report have we seen that much shareholder value destroyed in a regional subsector over a five-year period.
Why did this happen? In general, the capital markets have punished chemical conglomerates whose portfolios contain unrelated business models. As shareholders respond to declining multiples by exiting further, the stock value tends to race to the bottom, reflecting the conglomerate’s worst-performing lines of business. As in the case of base chemicals and basic plastics, these outcomes also reflect the influence of external factors: higher costs for raw materials, greater sensitivity to energy prices, higher levels of environmental regulation, and lower demand in mature markets.
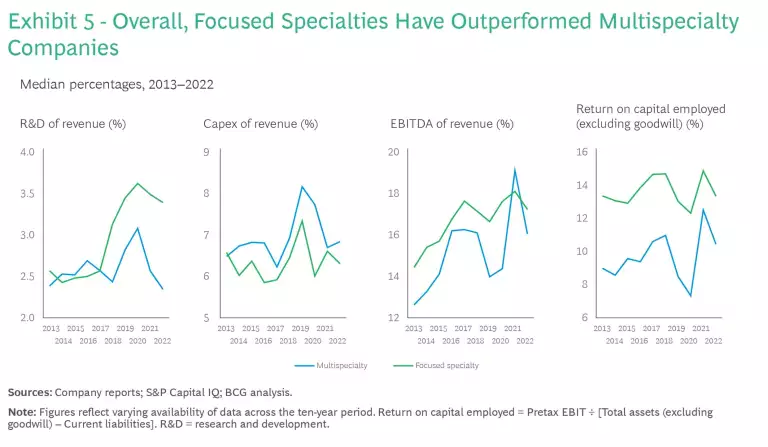
Exhibit 5 tracks key financial factors for multispecialty companies versus focused specialty companies. The exhibit shows how key KPIs in these two types of chemical companies have moved farther apart during the past 5 years.
That doesn’t mean that all focused specialties did well. Our analysis found that poor performers in this category were associated with regions burdened by stagnant GDPs and relatively mature markets. Among the most challenged product categories were inks and pigments (–6%), fibers and intermediates (–2%), and paints and coatings (which saw a drop in TSR from 15% in the previous five-year period to 6% in 2018–2022).
Still, there are exceptional companies, with relatively high TSRs, in all five subsectors, including multispecialty companies. And in the first half of 2023, multispecialty companies appear to be doing better. Two examples are Posco Chemical in South Korea and Mitsubishi Chemical in Japan. This subsector has recently regained a median 5% TSR—above average for the chemical industry.
Top Performers Within Subsectors
Overall differences among product categories during our five-year period were striking. Perennial high-performing product categories such as electronic chemicals (13% TSR) and industrial gases (12%) stayed strong, buoyed by persistent demand. Fertilizers (at 11%) and agrochemicals (10%) rebounded from past lower performance. These numbers seem to reflect this year’s agricultural shortages, including those associated with the war in Ukraine, which led other geographies to compensate by boosting food production.
The other product categories that performed above the global median line were all specialty chemicals: personal care (10%); adhesives, tapes, and construction chemicals (10%); engineered and high-performance materials and functional products (9%); and additives and functional chemicals (7%). In general, chemicals related to green energy, environmental technology, and life sciences did well. These include the raw materials used in batteries, and chemicals related to bioscience research and innovative medicine.
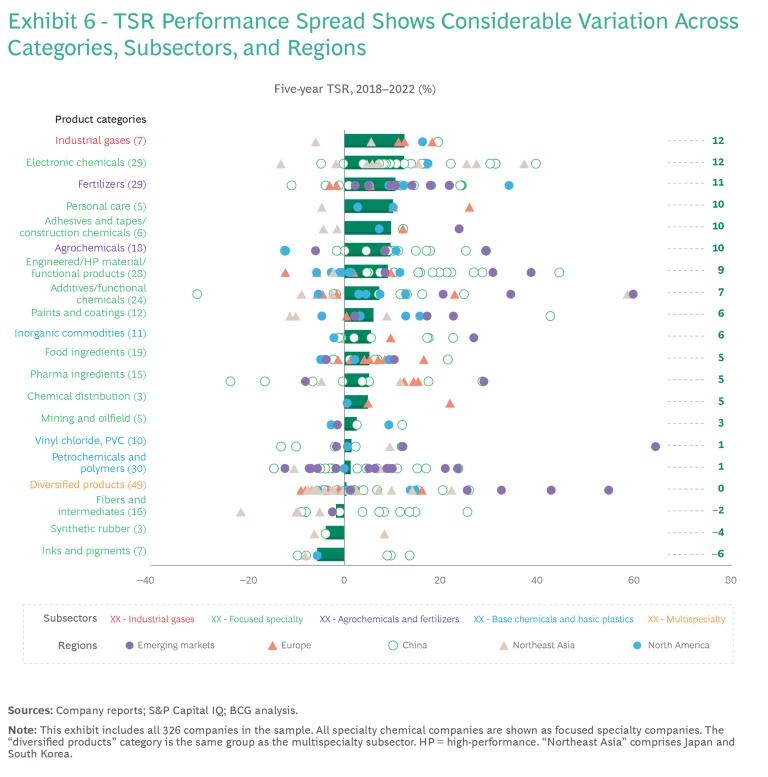
Within most product categories, companies delivered a wide range of TSR performance. Exhibit 6 shows this spread of performance broken out by product category and region. The chart demonstrates that even in challenging regions like Europe, and in challenging subsectors like base chemicals and basic plastics, companies can generate consistently high performance if they have the right management, portfolios, and business models.
The broad spread of performance also tells us that the success of a single product category does not automatically translate into success for all players in it. For example, in electronic chemicals, Northeast Asian companies and Chinese companies varied dramatically in their TSR returns. We also saw a wide range of TSR performance in two other product categories: engineered, high-performance materials and functional products; and additive and functional chemicals. In these cases, Chinese companies showed the most consistently strong shareholder returns.
Diversified companies, all of which are in the multispecialty subsector, had dramatic spreads in shareholder returns too. In the end, no geography, subsector, or product category (except chemical distribution, which is actually a service category) could claim that all of its companies were above average.
Learning from the High Performers
A few high performing companies stood out as dramatically high performers within their subsectors and regions. By averaging TSRs over 5-, 10-, and 20-year time frames, Exhibit 7 reveals how the list has changed over time. To remain in the top ten for all three lists, a company had to maintain the highest shareholder value consistently for two decades. Only four companies, all of them Asian, managed to do so: Wanhua in China, SRF and Pidilite in India, and Posco Chemtech in South Korea.
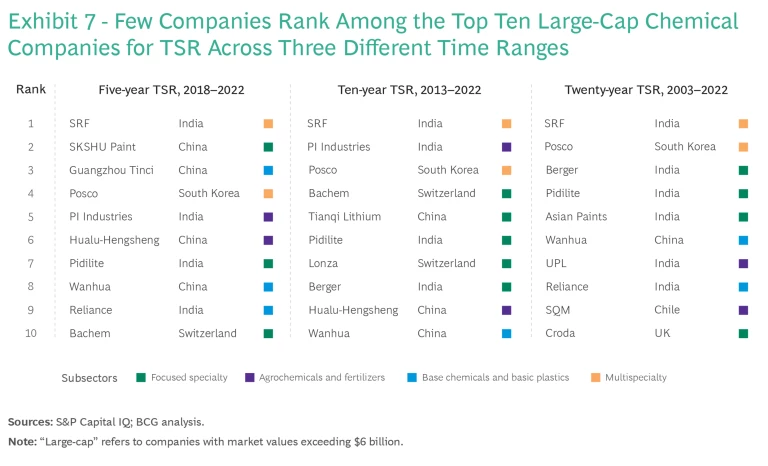
In general, Asian companies dominate the list of dramatic high performers. Only four non-Asian large-cap companies made the grade: SQM in Chile, Bachem and Lonza in Switzerland, and Croda in the UK. Mid-cap companies added another four to the list: Unipar Carbocloro in Brazil, Abu Qir Fertilizers in Egypt, and CVR and Newmarket in the US. The remaining 27 companies consist of 5 in South Korea, 7 in China, and 15 in India.
Our 2021 report profiled Wanhua as a producer of basic chemicals with an asset-focused strategy, with the polyurethane component MDI as its core product. Few companies with similar profiles generated high TSRs. Wanhua maintains low production costs by operating its own power plants, and exercising extremely well-honed capabilities in capital efficiency and global M&A. SRF, a multispecialty company profiled in our 2022 report, is an industry leader in the fields of fluorospecialties, pharmaceutical and agricultural intermediates, and refrigerants. It is one of just a few refrigerant producers in India, along with Navin and GFL, that possess backward integration to basic chemical ingredients, a very successful business model.
In short, Wanhua and SRF have built sustainable business models that protect them from many external challenges. So have the other two companies in the 20-year top ten. Pidilite has relied for success on its production of focused specialty chemicals, primarily paints and adhesives, for India’s large and steadily growing middle class. More than 80% of its revenue comes from its consumer business: arts and crafts, home improvement, and contractor supplies. The company’s B2B line consists largely of industrial materials for packaging, textiles, paints, and paper. Its reputation in India is bolstered by a long-standing hands-on approach to corporate social responsibility: providing apprenticeships, helping small businesses in remote villages, and funding construction projects such as river dams. Pidilite subsidiaries in other emerging markets, including Brazil, Sri Lanka, Thailand, Egypt, Dubai, and Bangladesh, grow through similar strategies. The one subsidiary that it closed recently was in the mature market of the US.
The other 20-year top-ten TSR company is Posco, an industrial conglomerate based in Seoul that operates a large chemical business. As one of South Korea’s leading electronic chemical producers, Posco has benefited from the growing global demand for the cathodes, anodes, and lithium used in battery manufacturing. The company currently has orders locked in through 2033 and has a unique presence throughout the battery value chain, from mining and metal processing to manufacturing to recycling.
Posco was founded in the 1960s as a state-owned steel manufacturer and privatized in 2000. The company’s investments in lithium began in 2010 and have generally kept pace with demand, including demand for use in electric vehicles. Posco’s chemical businesses recently focused on operational efficiency, and its cathode operating profit contribution is expected to rise from 18% in 2021 to more than 70% in 2025.
Three of these four exceptionally high-performing companies are in low-performing subsectors: SRF and Posco are multispecialty companies, and Wanhua produces basic chemicals. Only Pidilite is a focused specialty company.
Prospects for the Next Few Years
TSR in the chemical industry has not rebounded in the first half of 2023. Indeed, it has dropped to a negative (–1.5%) overall. As a result, the 2024 report, which will be based on a five-year pattern of shareholder returns from 2019 through 2023, is unlikely to show much uptick, if any. That could change in early 2024, but many of the factors associated with this TSR decline remain in play.
The war in Ukraine continues. Inflation has leveled off in some geographies, but not fully. Softness in the Chinese economy, particularly in the construction sector, may affect the chemical industry for several more years. The pressure to reduce greenhouse gases continues to grow, as decision makers take climate change more seriously. Meanwhile, energy and natural gas prices remain higher than in the pre-COVID-19 era, and no observable rebound in construction has yet occurred.
On the other hand, demand factors affecting chemical company TSRs may shift. Global sales of automobiles appear to be rising, and have almost returned to pre-pandemic levels. Construction in the US is doing the same. Europe appears to have resolved its feedstock supply shortages, although high energy prices negatively impact the competitiveness of European players. Regional supply chains are getting stronger. If inflation and interest rates fall, chemicals may be positioned for a rebound. It is easier to restock chemical supplies than many other industries’ products.
Moreover, innovation in chemical products (materials, biomaterials, and batteries) and in processes (operations, supply chain logistics, and recycling technologies) is accelerating. The results have not yet fully materialized to affect TSR, but they could do so, especially with the advent of generative AI (GenAI) and other forms of data analytics. The workforce’s skills are improving, and opportunities for growth in emerging economies look promising.
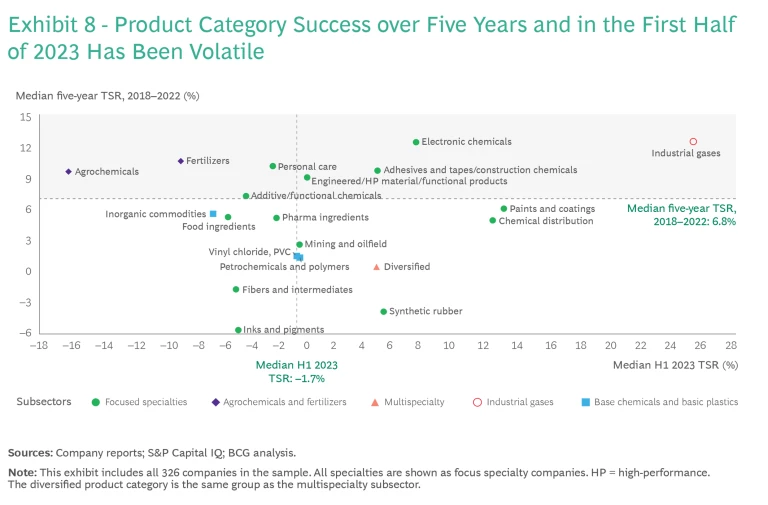
The most expansive domains of the future chemical industry, at least for now, are the focused specialty product categories shown in the upper right quadrant of Exhibit 8. These have demonstrated high TSR over the five-year period from 2018 through 2022, and also in the first half of 2023.
Note, however, that the top-performing product categories so far this year (those in the two right-hand quadrants) are not identical to the top-performing categories in recent past years (those in the upper left-hand and upper right-hand quadrants). Agrochemicals and fertilizers have fallen behind in 2023, which may reflect supply chain disruptions, shifts in food production, and geopolitics. Diversified (multifunctional) companies, paints and coatings, synthetic rubber and chemical distribution businesses appear to be getting stronger.
Finding Success in a Challenging Time
As the larger macroeconomic trends play out, the success of a few companies in every part of this industry suggests that high-leverage strategic paths exist in all sectors. These paths involve management disciplines that may have seemed less necessary in the past. Now, shareholder value demands operational, organizational, and business model changes, with the exact mix varying by the region, subsector, and management needs of each company. Attention to eight areas is critical:
- Market Awareness. With supply chains shifting and demand fluctuating, a deep, data-driven understanding of the market and industry landscape is essential. More explicit market assessments, emphasizing supply and demand imbalances and the hierarchy of customer needs, can lead to more flexible and rapid responses.
- Agile Operations. More flexible production requires advanced digital technology (including AI-equipped operational systems) and the management changes that go with them. More sophisticated approaches to end-to-end cost reduction and pricing continue to appear, using data and GenAI models more effectively.
- Innovation. The success of innovative product categories such as electronic chemicals demonstrates that chemical companies cannot ignore R&D spending. Drawing on machine learning and partnering with outside researchers, companies can gain more from their investments and better tailor products to the markets they know well.
- Sustainability. Investment in renewable energy systems can help overcome fossil fuel price inflation and meet regulatory requirements. Cradle-to-grave offerings can be market differentiators.
- Organizational Change. Companies that want to emulate the top performers may need to change their fundamentals. This might include adopting a clean-sheet approach to cost discipline (using methods such as zero-based budgeting) and rethinking the operating model. Revised operating models, motivational engagement, and governance structures can shift a business culture so that people see the value of the new approach and are willing to change with it.
- Productivity. Although most chemical companies have driven out costs incrementally, they can still gain productivity and reduce costs holistically by looking freshly at operations, pricing, contract structures, and new ways of working.
- Operations, Supply Chain, and Procurement. Advanced analytics can transform logistics and manufacturing, even in organizations with well-established operations in place. Measures to consider include real-time supply chain management, improved end-to-end visibility, AI-based predictive maintenance and bottleneck detection, digital twins, smart contracts, order and inventory processing, and negotiations. Chemical companies are well positioned to improve their intra-organizational, supplier, and customer relationships by using digital platforms such as next-generation enterprise resource planning (ERP) systems that embed AI in their user interfaces and coordinate planning and steering processes across functions and business units.
- Talent Management. With the advent of AI, next-generation ERP, and analytic technologies, employees increasingly need new skills. Industry-leading companies are shifting their recruiting priorities and upskilling their existing teams accordingly.
The need for change in multispecialty companies is especially urgent. Although they are improving, their average TSRs remain weak. Most have diversified structures, in which each main business unit follows its own management approach. That may no longer be feasible. They may instead need more focused portfolios and differentiated steering models. There may be opportunities to restructure portfolios, swapping businesses so that they can focus on the capabilities that provide the most value. The same need may exist at some of the larger focused specialty companies.
When we look at the trends and prospects of the chemical industry in depth, we return to what we said at the beginning of this report. The industry is highly resilient, and it already seems to be adapting to the strong headwinds it is facing. North America and Asia are showing signs of coming back, and the rest of the world may follow. The past few years represent a perfect storm of unusual events hitting at the same time. When the storm subsides, the energy and capabilities of the global chemical industry will remain, and it may be stronger than it was before.
The authors acknowledge the contributions of their BCG colleagues Jooyoung Ahn, Matthias Baeumler, Robert Blaudeck, Prakash Chandrasekar, Paul Duerloo, Clint Follette, Christoph Franck, Jan Friese, Abhrajit Guria, Susumu Hattori, Christian Hoffmann, Alexander Hogreve, Marcin Jedrzejewski, Ryan Jones, Jihoon Kim, Livia Lin, Martin Link, Tobias Mahnke, Julia Meisel, Marcus Morawietz, Christophe Nauts, Sanjay Parihar, Semi Park, Eduard Pujol, Arun Rajamani, Katarzyna Raszka, Mirko Rubeis, Asheesh Sastry, Gabriela Schaefer, Ranu Sharma, Priyanka Singh, Ekaterina Sycheva, Siqi Tang, Jegor Tsihnjajev, Kirill Tuishev, Anand Veeraraghavan, Yaroslav Verkh, and Han Zhou. They also acknowledge the contribution made by BCG’s ValueScience Center.
