Cloud revenue and earnings for the three major cloud service providers (CSPs)—Microsoft Azure, Amazon Web Services (AWS), and Google Cloud Platform (GCP)—surpassed high expectations in the first quarter of 2024, driven by strong demand for generative AI (GenAI). Collectively, they generated $53.7 billion in revenue, with a quarterly sequential increase of $2.6 billion. Azure led the pack with 31.1% year-over-year revenue growth. GCP also performed exceptionally well, with revenue increasing 28.4% year-over-year. According to Gartner, overall cloud spending is expected to account for 58% of IT spend by 2027, growing at 18% CAGR.
About the Series
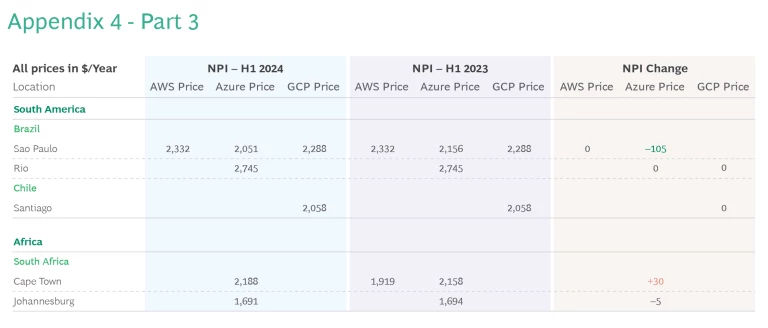
As cloud spending grows, BCG is keeping an eye on recent pricing changes using our Nimbus Pricing Index (NPI). The NPI, which reflects average pricing in US dollars converted at constant currency across the three main CSPs, saw a small decrease of 0.4% since the last installment of our Cloud Cover report in November of 2023. The decrease would have been greater, but GCP actually increased prices by 0.9% on average, driven by new high-cost locations. AWS was able to reduce prices, in part, by omitting some compute services in the high-cost city of Cape Town.
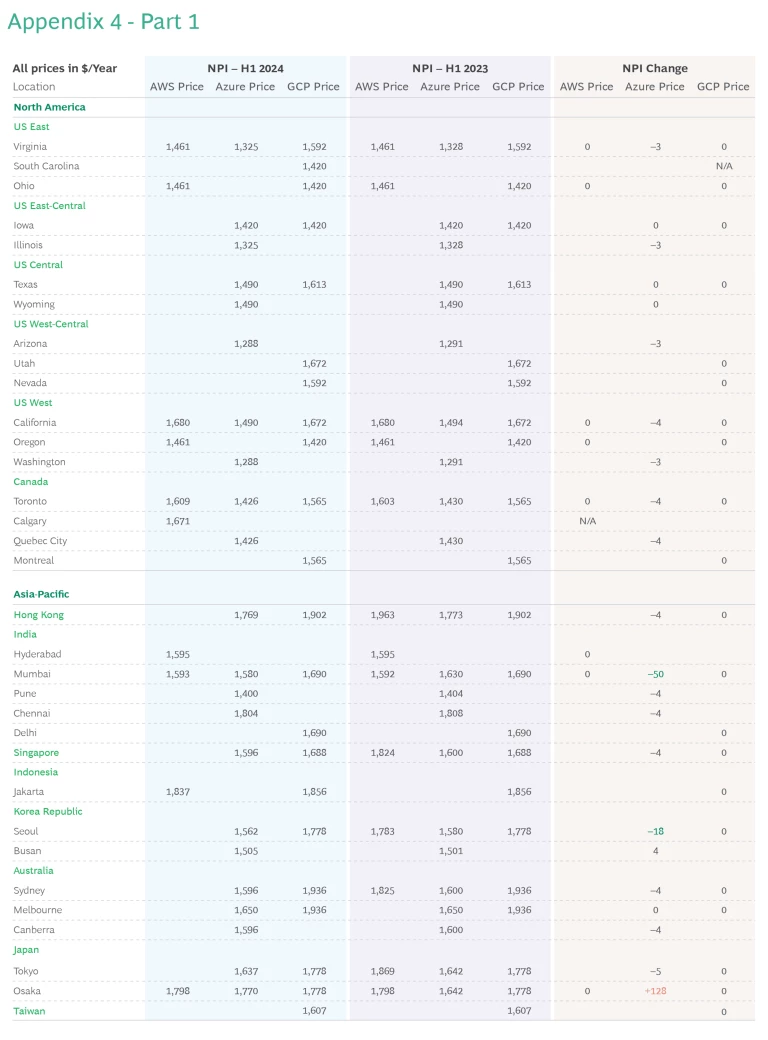
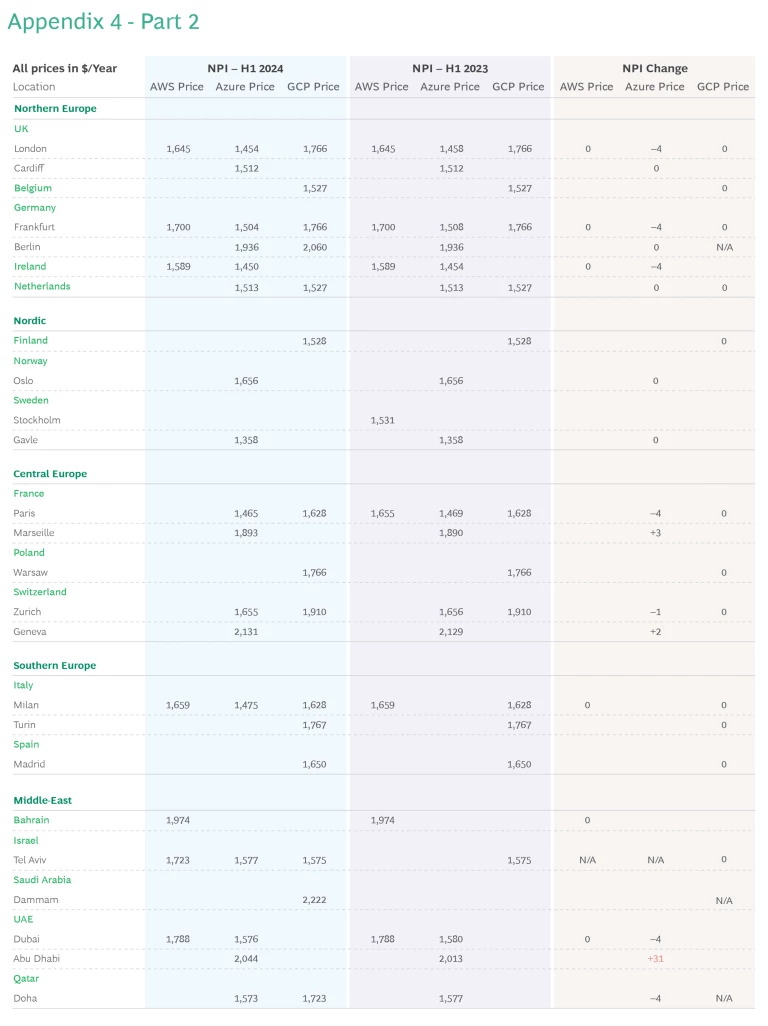
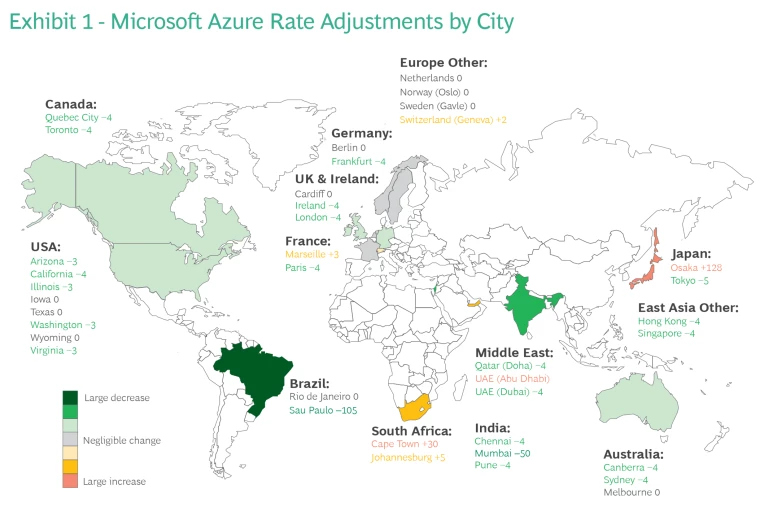
Azure was the only CSP that changed rates in existing locations in the first half of 2024, driven by adjustments in compute rates. (See Exhibit 1.) Storage and network rates remained consistent. Globally, Azure’s pricing adjustments resulted in mostly small changes in each region. The most dramatic swings occurred in Osaka (+$128), Abu Dhabi (+$31), Cape Town (+$30), Mumbai (–$50), and São Paulo (–$105). Even with the substantial Osaka rate increase, Azure still offers the lowest rates in that city. Moreover, its competitive pricing in Tokyo means Azure is the most affordable CSP in Japan.
Providers Add Locations
While AWS, Azure, and GCP all added locations in the first half of 2024, there were notable differences in the expansion strategies. (See Exhibit 2.) Azure added two locations (Tel Aviv, Warsaw); AWS also added two (Tel Aviv, Calgary); while GCP added four locations (Berlin, Dammam in Saudi Arabia, Doha, and South Carolina).
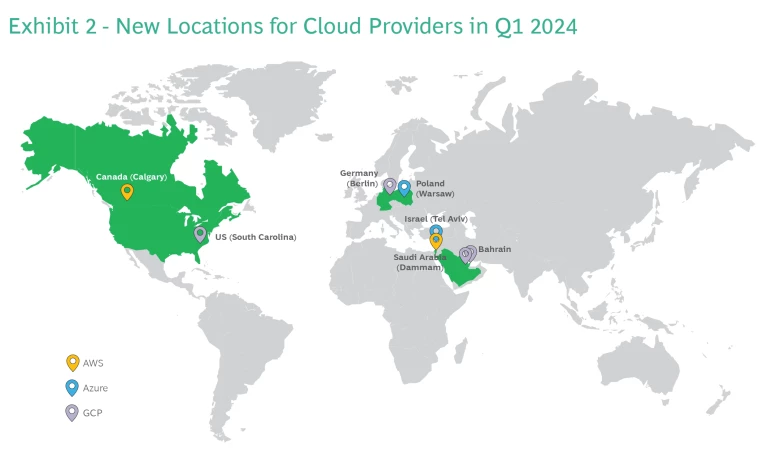
With the addition of Tel Aviv by AWS and Azure, GCP is no longer the only provider in that city—although GCP rates remain the lowest ($1,575/year), slightly less than Azure, and $147/year less than AWS. Meanwhile, AWS is the first provider in Calgary, though its rate of $1,671/year is pricy, even above its Toronto rate. Overall, AWS’s Canadian rates are the highest among the providers.
Meanwhile, GCP’s addition of Dammam gives it the first location in Saudi Arabia, though on the expensive end of the spectrum ($2,222/year)—similar in cost to Brazil and South Africa. GCP also debuted in Doha with a rate of $1,723/year, which is $150/year less than Azure, the other provider in the region. Also, in the first half GCP added Berlin, once again in competition with Azure, but with less competitive rates at $124/year higher than Azure. Finally, GCP became the first provider with three hubs in the US, adding South Carolina to Virginia and Ohio.
Serverless Services
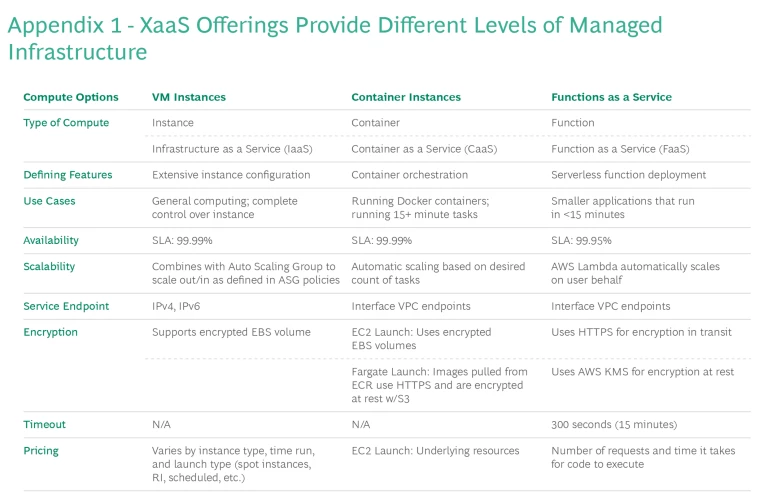
Since the introduction of the AWS Lambda service in 2015, serverless has gained momentum in the cloud computing space and may ultimately revolutionize how the industry develops next-gen IT architectures. (See Appendix 1 for different levels of managed infrastructure.)
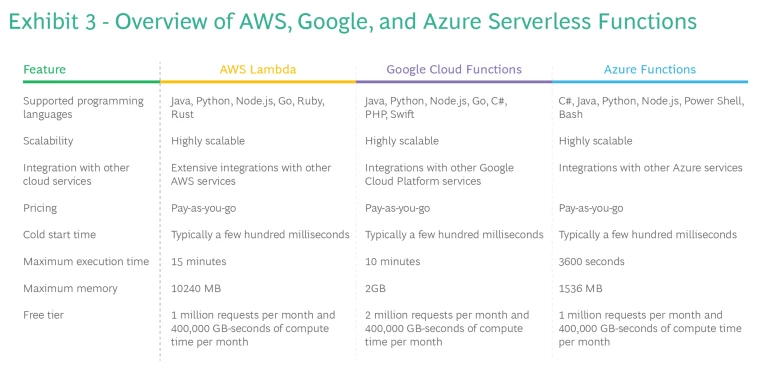
With serverless, DevOps teams can build and run applications and services without thinking about the servers running the code. They can focus on improving code, processes, and upgrade procedures, instead of on provisioning, scaling, and maintaining servers. AWS Lambda, Azure Functions, and Google Cloud Functions are some of the most popular offerings in the serverless cloud market. (See Exhibit 3.)
Serverless Pricing
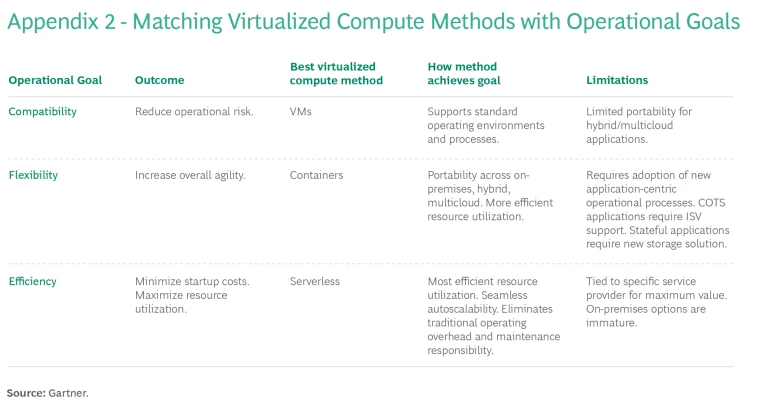
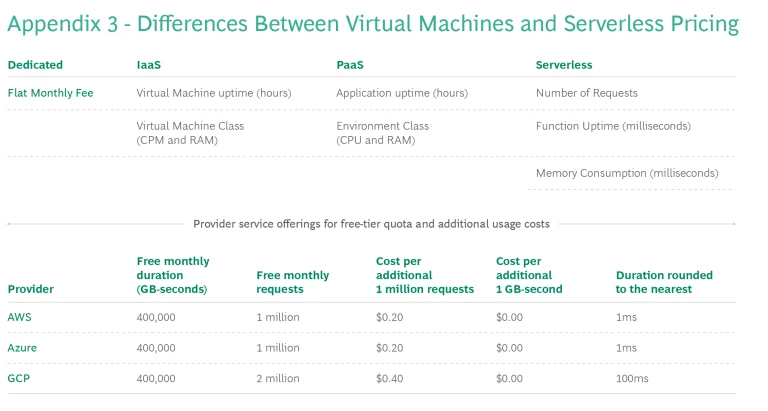
The downside to serverless is that, in contrast to the traditional virtual machines pricing model, pricing for a given set of parameters is often inconsistent across regions. (See Appendix 2 for pricing differences and Appendix 3 for city-level pricing.) Azure is the only player in the market which shows consistent per-unit pricing across all regions, something that engineering teams appreciate since they can run their applications on Azure functions without worrying too much about the most cost-effective region. (See Exhibit 4.)
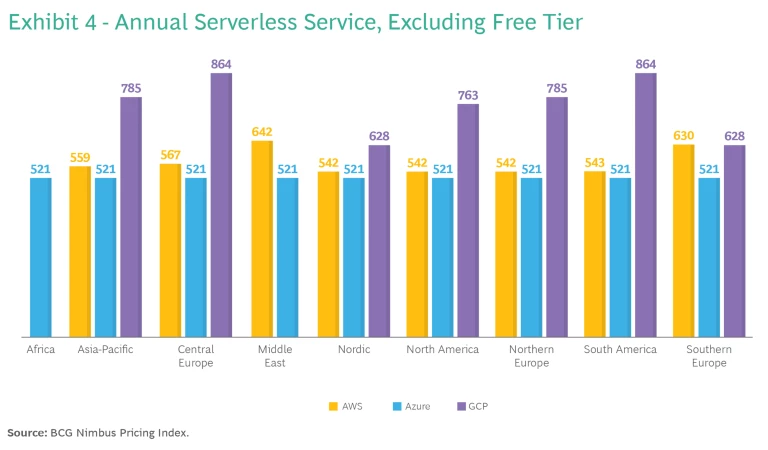
If we compare the pricing for all three vendors, Azure currently is the cheapest option across regions, followed by AWS and then GCP. In most regions, AWS is 4% to 9% more expensive, while GCP is 20% to 60% more expensive. Despite GCP’s premium pricing—second generation serverless compute costs are almost double in some regions—it offers the most generous allotment of free monthly requests. Eventually, this feature could make GCP a more economically viable alternative for applications with lighter volume requests.
Pricing Optimization
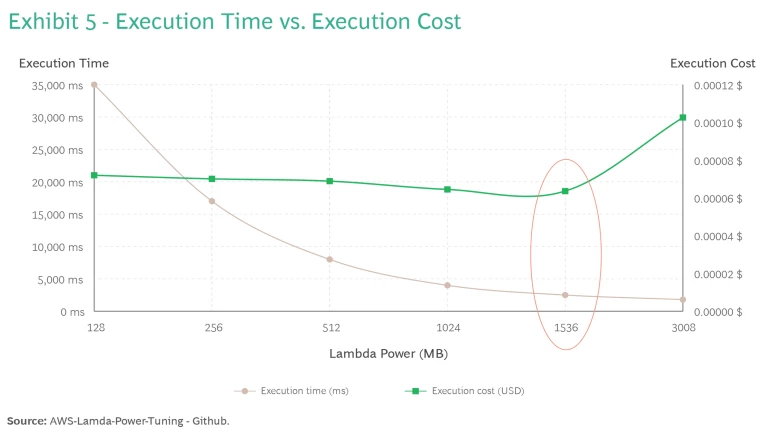
While most billing charges are based on service consumption, some services require that customers choose configuration parameters that partially determine the amount billed, which creates an opportunity for customers to optimize these parameters. For example, an AWS Lambda function defines how much “computing resources” the function receives once triggered (measured in MB of memory). The cost of a function varies based on the allocated computing resources and the number of milliseconds it takes to execute. So, to optimize a function’s cost, the company should aim for smaller computer resource allocations and shorter execution time. (See Exhibit 5.)
Besides memory, AWS allocates more CPU to larger power allocations, resulting in faster function execution. Determining the optimal power configuration means finding the sweet spot between the fastest execution and the lowest cost. For example, as shown in Exhibit 5, execution time goes from 35s with 128MB to less than 3s with 1.5GB, while being 14% cheaper to run.
Fine-Tuning Your GenAI Model
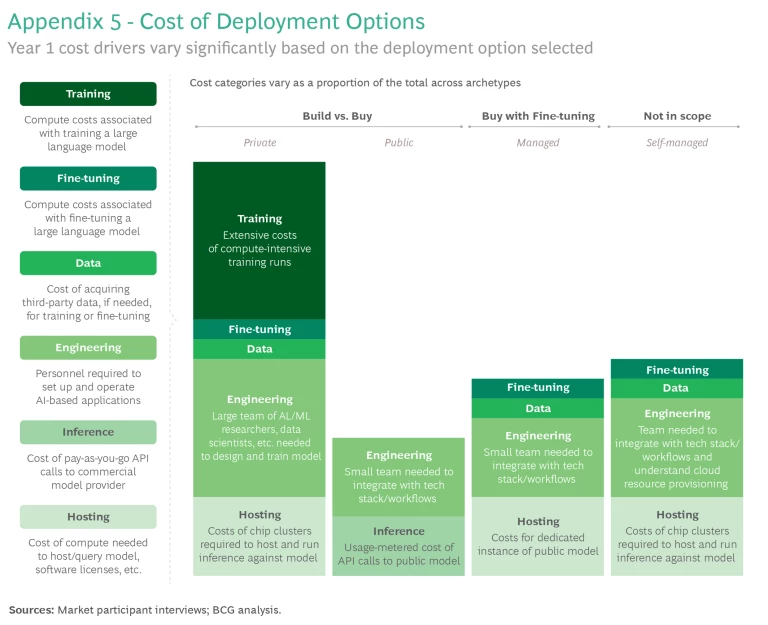
In our last Cloud Cover report, we outlined a framework to estimate the cost of “building versus buying” GenAI models. (See Appendix 4.) The “buy” models we looked at are ready-made, without the option to tailor them. In this report, we dive deeper into the “buy” question and explore the cost factors to consider when deciding whether or not to fine-tune a GenAI model.
Fine-tuning usually involves pre-trained models and a custom dataset. Pre-trained models are broad-purpose models that have been initially trained on large, unlabeled datasets. These models are further trained, or “fine-tuned,” on a smaller, more specific dataset relevant to the task at hand. Through fine-tuning, models can learn the nuances of a particular field or dataset, resulting in better predictions, translations, or other outputs more aligned with the company's requirements.
Customized models come with some drawbacks. They are resource intensive and consume more computational power than generic models. The data used for fine-tuning can at times introduce or perpetuate biases, requiring careful selection and monitoring to ensure fairness and relevance.
Costs of Fine-Tuning
The cost of fine-tuning GenAI models depends primarily on the size of the training dataset in tokens and the number of iterations (or epochs) necessary for training. Typically, the more epochs, and thus more exposure to the data, the better the model becomes. For simpler and smaller use-cases, a general recommendation is to train using 5 to 10 epochs.
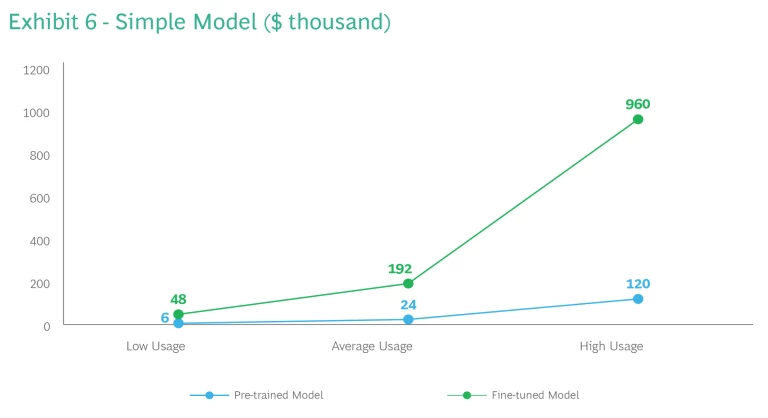
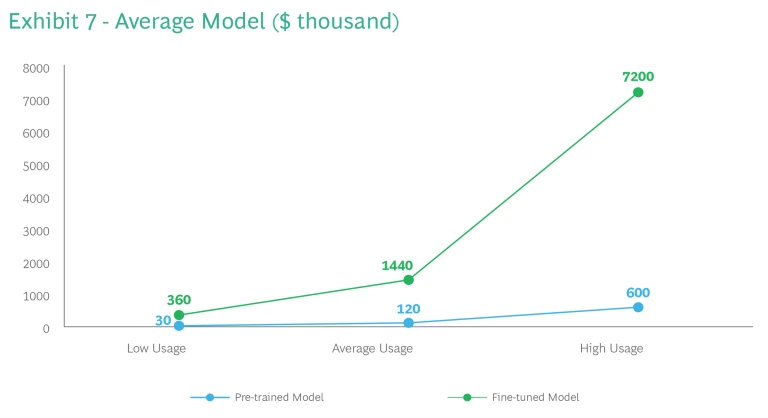
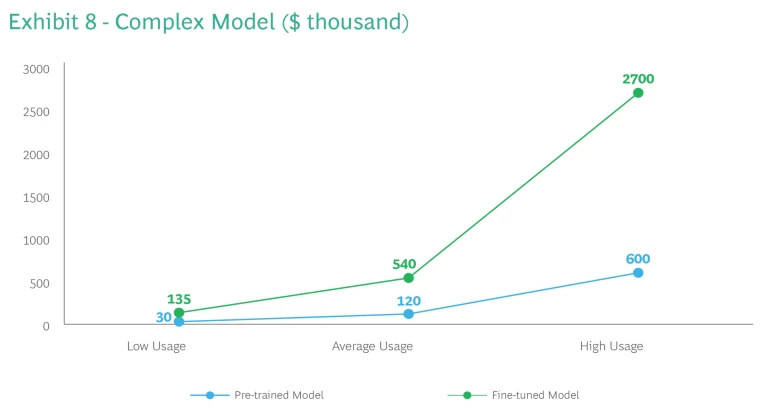
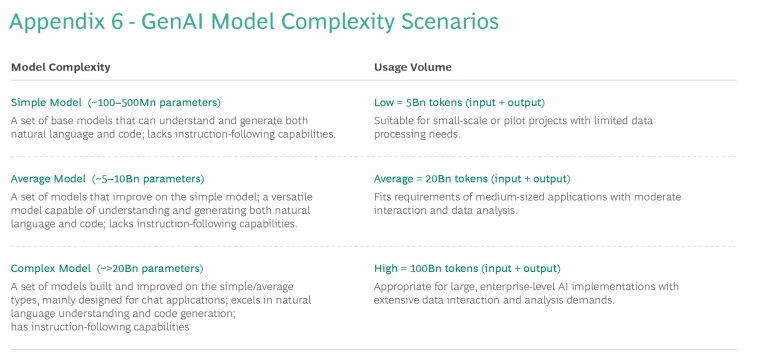
As model complexity escalates, so does the cost of fine-tuning—from a mere 0.032 million USD for a simple model, to 0.48 million USD for an average model, to 0.64 million USD for a complex model. (See Appendix 5 for model complexity scenarios.) Once built, there’s an exponential increase in the resources needed to run the models across all usage tiers. Interestingly, while usage costs escalate from pre-trained to fine-tuned, the scale of the increase for complex models is less drastic (4.5x) compared to simple models (8x) and average models (12x). (See Exhibits 6-8 slideshow).
Also worth noting is that while the simple model offers better efficiency at lower usage levels, at higher volume the complex model might be more economical. Complex models can become less expensive to run than average models at high usage rates. (See Exhibit 9.) These insights demonstrate that aligning model complexity with expected usage is extremely important to optimize performance and costs.

Please keep an eye out for the next issue of Cloud Cover, where we’ll continue to develop the NPI and address key questions on cloud services and pricing—including insights on specialist offerings, other CSPs, and price evolution over time. We will also be conducting a more detailed analysis comparing the economics of deploying VM machines versus serverless functions.


