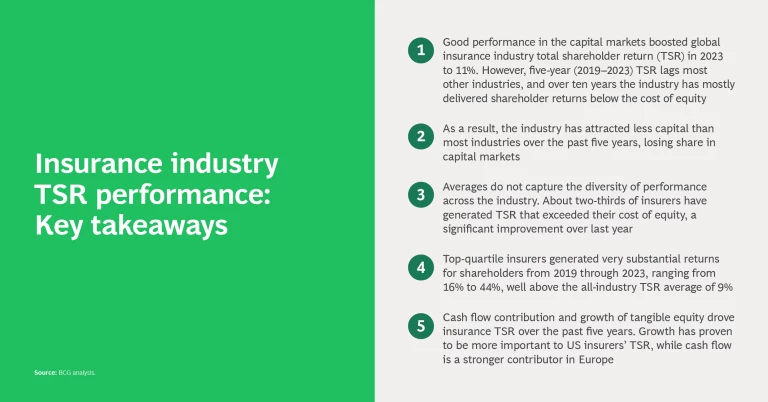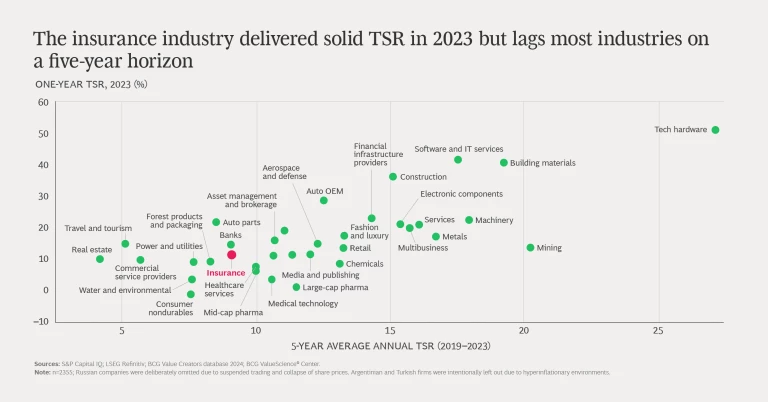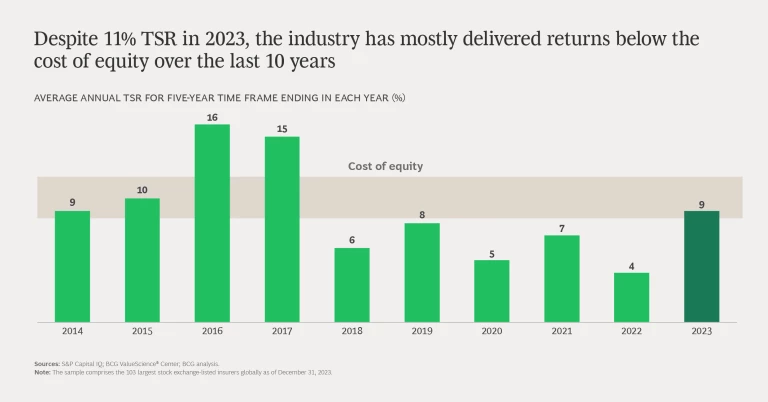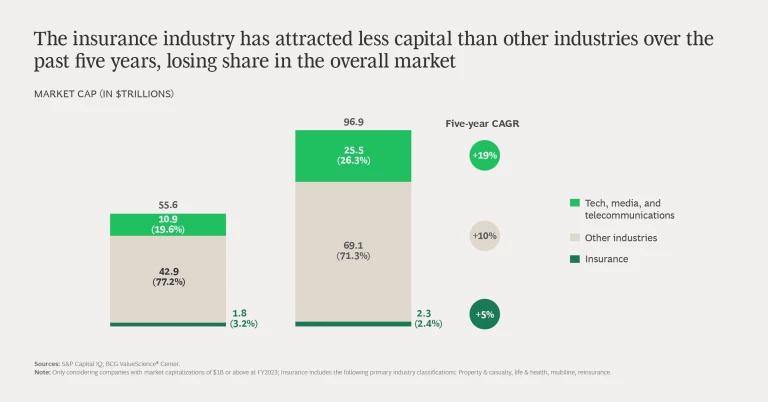
Value creation in the global insurance industry recovered somewhat in 2023, riding the back of generally rising share prices over the last year. Insurance TSR (total shareholder return) rose to 11% from 8% in 2022, but five-year (2019–2023) TSR lags most other industries, and over ten years the industry has mostly delivered returns below shareholders’ cost of equity (calculated at 8% to 11%). Not surprisingly, capital has left the industry over time. The share of investment in global capital markets of insurers worth $1 billion or more dropped to 2.4% in 2023 from 3.2% in 2018. (See “About the 2024 Insurance Industry Research.”)
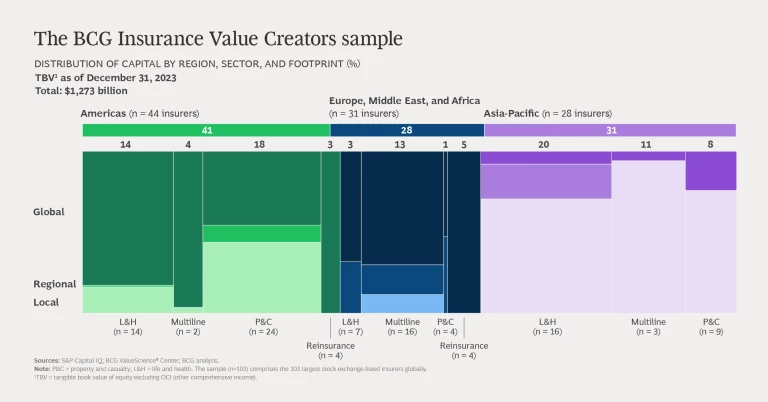
About the 2024 Insurance Industry Research
The 103 companies break down as follows:
- Region: 44 are based in the Americas, 28 are in Asia-Pacific, and 31 are in Europe, the Middle East, and Africa.
- Sector: 37 focus on life and health insurance, 37 specialize in property and casualty, and 21 operate in multiple lines. Eight are purely or primarily reinsurers.
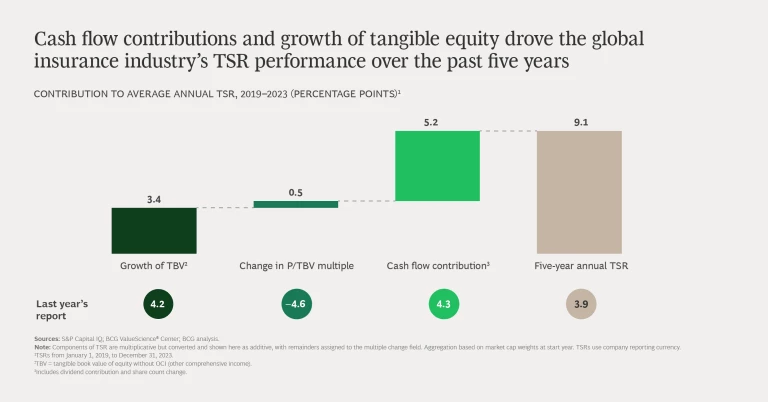
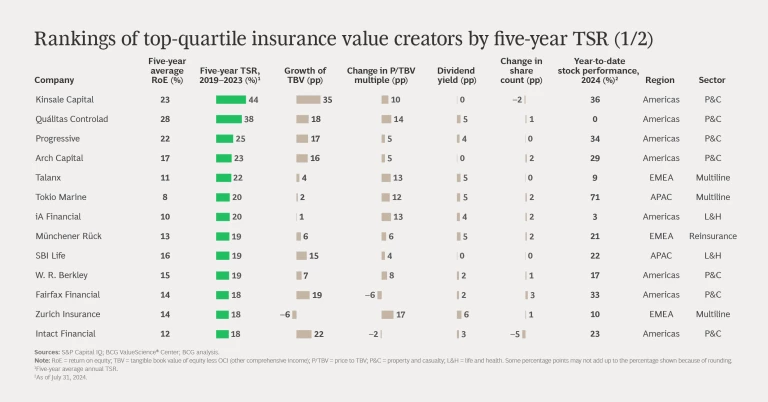
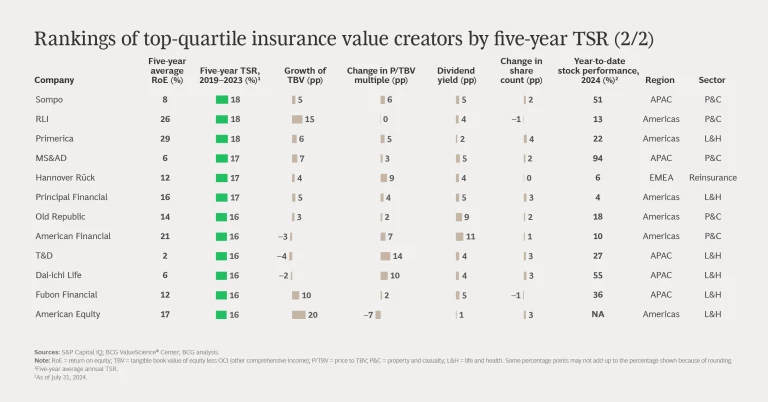
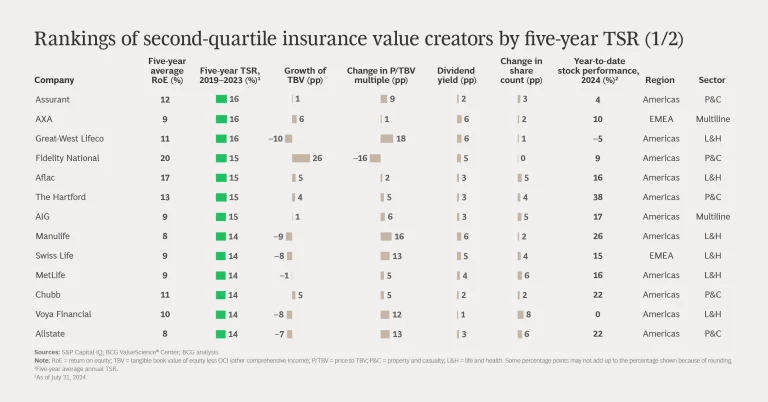
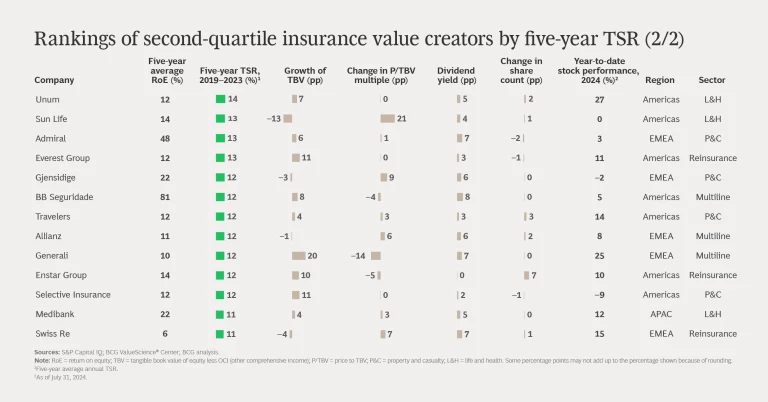
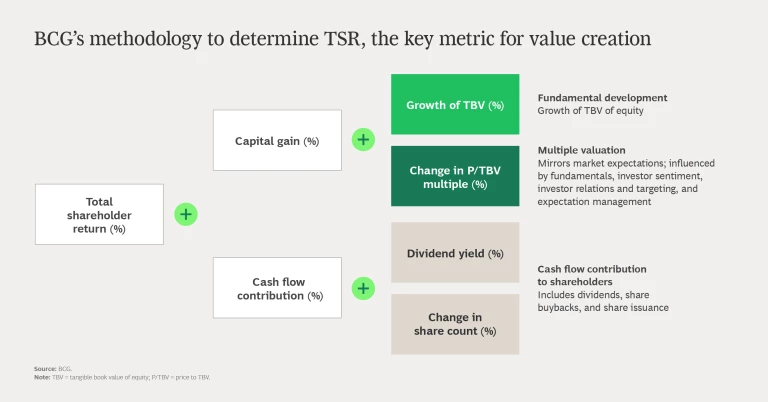
Calculating total shareholder return is a straightforward matter of combining share price gains and dividends. More interesting is the process of disaggregating insurance TSR into its three components:
- Growth in tangible book value (TBV)
- Change in price to tangible book value multiple (P/TBV)
- Contribution from cash flow (comprising dividend yield and share count change effects)
We base our analyses on data from S&P Capital IQ and Refinitiv. Given the large valuation variances in the first half of 2022 that resulted from interest rate movements, we adjusted the TBV for other comprehensive income, which we believe allows us to derive more meaningful insights into how TBV variances affect TSR over time.
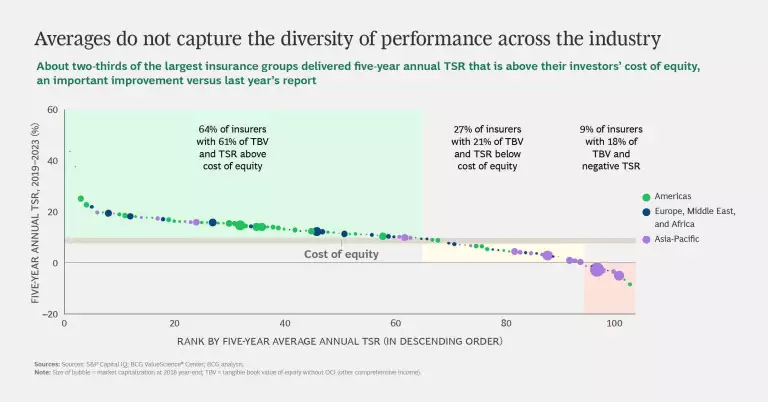
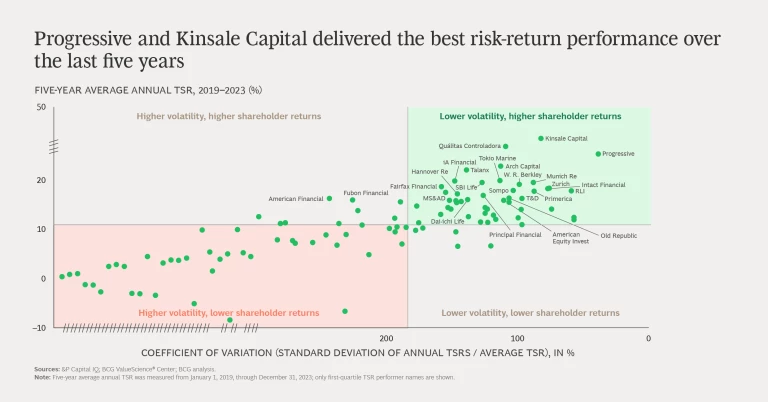
On a global basis, insurers still have a lot of work to do to improve their competitiveness with investors. But on a segment, regional, and company-specific basis, many are doing quite well, with their performance obscured by worldwide or industrywide trends. About two-thirds of insurers have generated TSR that exceeds their cost of equity, a significant improvement over last year. Top-quartile insurers generated very substantial annual returns for shareholders from 2019 through 2023—ranging from 16% to 44% and averaging 19%, well above the all-industry TSR average of 9%.
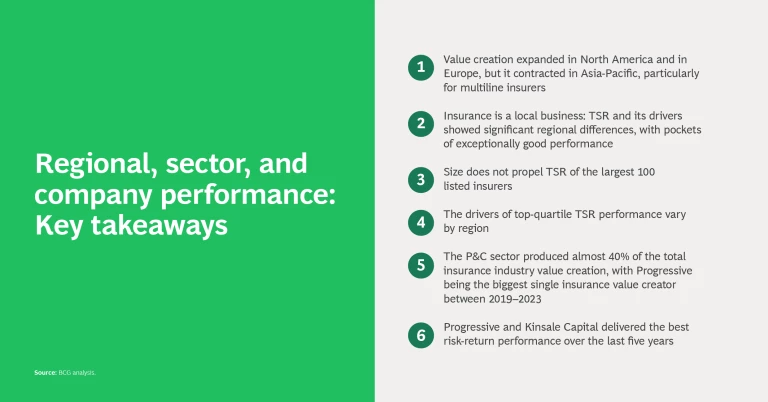
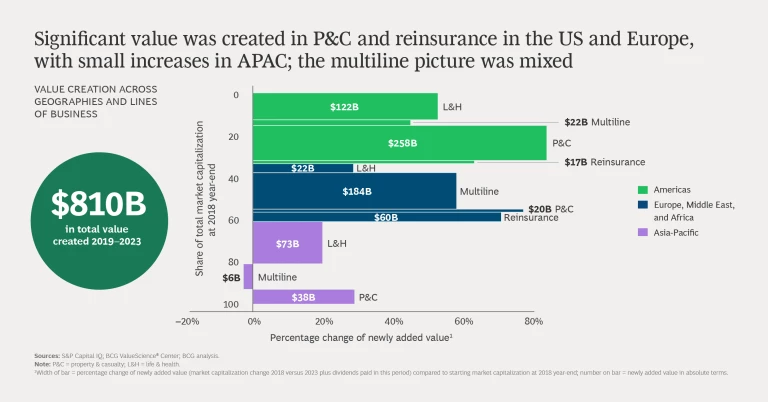
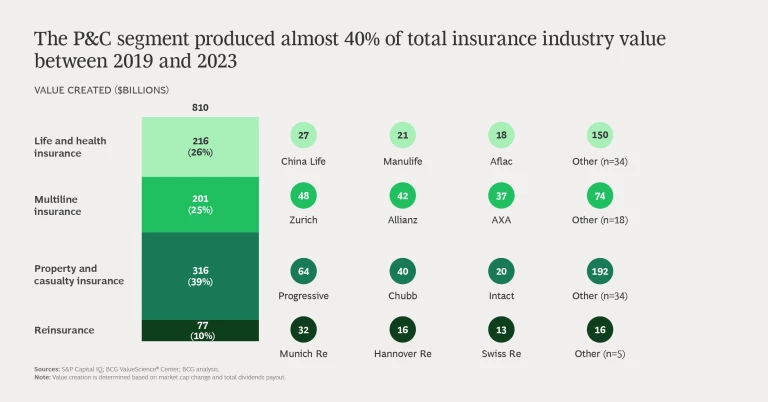
The property and casualty (P&C) segment, especially in the US, and reinsurance broadly outperformed the rest of the industry—and many other industries—on a five-year TSR basis. P&C produced almost 40% of total insurance industry value between 2019 and 2023.
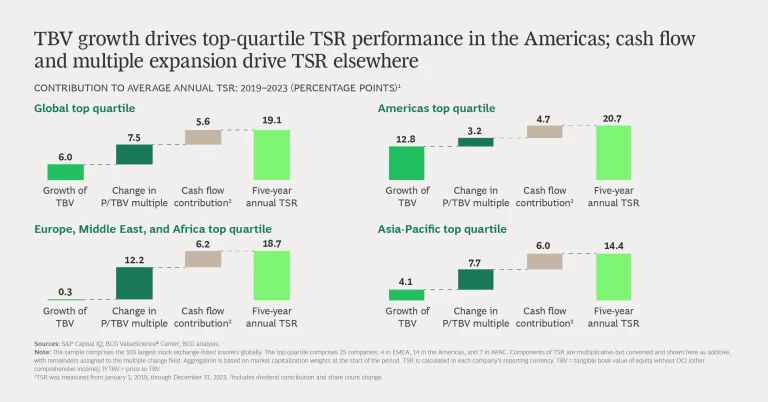
The top-quartile companies globally are well balanced: five-year annual TSR was 19.1%, of which growth in tangible book value (TBV) contributed 6%, multiple expansion 7.5%, and cash flow 5.6%. However, looking more closely at the different regions, growth was responsible for 12.8 points of the 20.7% annual TSR in the Americas, but only 0.3 points of the 18.7% TSR in Europe and 4.1 points of the 17.1% TSR in APAC.
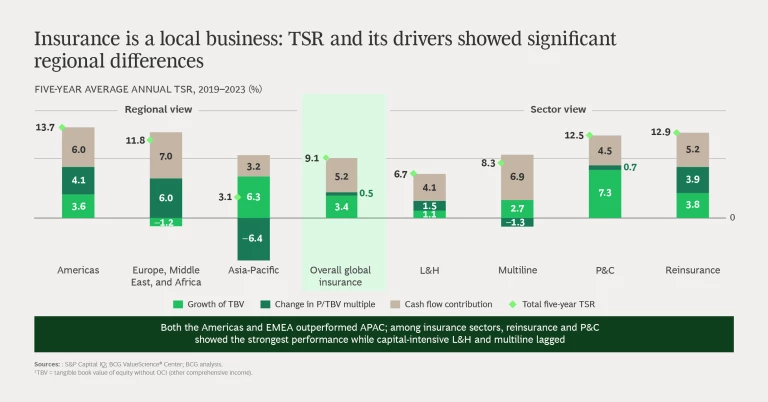
Many insurance companies operate worldwide, but outside large global lines of business (such as cyber, marine, aviation, and other global specialties as well as certain reinsurance lines) business conditions and the opportunities to create value have little in common in the three big economic regions: Europe, the Middle East and Africa (EMEA), the Americas, and Asia-Pacific (APAC). In a similar vein, the main segments of the industry—property and casualty, life and health, reinsurance, and multiline—are very different businesses that produce value in quite different ways and are measured using different sets of metrics.
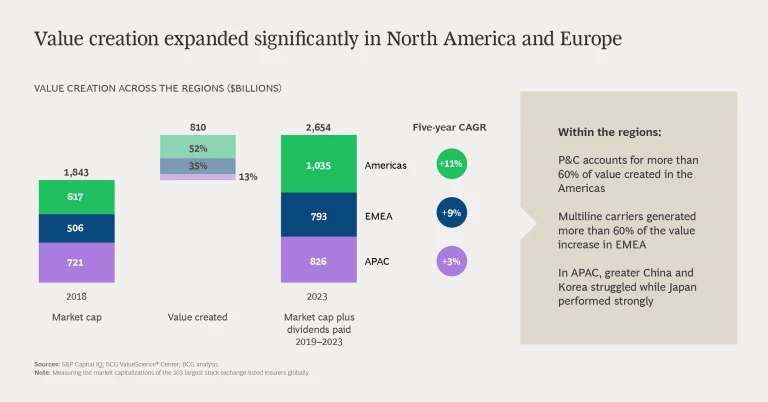
Regionally, value creation over the last five years has been largely concentrated in the Americas, which had more than 50% ($418 billion of $810 billion) of the overall gains. Value creation in EMEA was about two-thirds of that in the Americas. APAC generated only slightly above $100 billion of value creation. Greater China and Korea struggled, while Japan performed strongly.
The following slide show provides a detailed look at the insurance industry’s 2019–2023 TSR story.