What is commonly referred to as the energy transition actually consists of dozens of discrete transitions that span industries such as power generation, transportation, and agriculture. These various pathways to net zero are often tightly connected, with overlapping value chains, technology innovations, adoption rates, and feedback effects.
Given this complexity, using first-order analysis or toy models to shape corporate strategy , policy, or investments will lead to dangerous blind spots and poor decision making. Leaders won’t know how to stack or sequence critical initiatives, nor will they be able to identify hidden risks and opportunities.
Instead, leaders must adopt a holistic, integrated systems lens. A systems approach can inform action by creating deeper insights and realistic scenarios, including:
- A view that goes beyond the silos of any one industry, technology, value chain, or geography and considers the many stakeholders and factors at play.
- The ability to understand and assess the intricate interconnections of supply chains, materials, production capacities, labor, capital, and regulation, among other factors—which in turn allows us to identify potential synergies, avoid unintended consequences, and gain perspective on where technological innovations and substitutions are likely or essential.
- Guidance on predicting how energy and industrial systems may change over time due to their cascading impacts—and an understanding of the conditions under which certain transition pathways are economically feasible and can deliver a more sustainable, adaptable, and resilient future.
BCG’s proprietary Systems Workbench for Insight on Transition Change–Green Transformation (SWITCH-GT) enables such an approach by allowing us to examine the dynamics of various energy transition pathways across sectors. (See the sidebar “Modeling the Complexity and Dynamics of the Energy Transition.”) To illustrate the value of this high-fidelity computational workbench, we’ve used it to explore how companies in one sector—wind turbine OEMs—can apply a systems lens to their business.
Modeling the Complexity and Dynamics of the Energy Transition
BCG is developing its Systems Workbench for Insight on Transition Change–Green Transformation (SWITCH-GT) to help stakeholders across the public and private sectors understand the industrial requirements for the ongoing energy and sustainability transition. Stakeholders need that insight if they are to successfully accelerate the development of clean energy, sustainable transportation, and other technologies required to achieve global net zero.
The workbench includes a high-resolution network model of the materials and technology supply chains and their interconnected dynamics that draws on other BCG proprietary models—for a sense of magnitude, BCG has a dozen proprietary models for renewable hydrogen alone—along with more than 400 external data sources, including the International Energy Agency, US Energy Information Administration, International Renewable Energy Agency, US National Laboratories, academic papers, analyst reports, industry reports, and expert interviews. Currently, the model covers 134 subtechnologies within power, buildings, and transportation and roughly 300 materials.
In addition, more than 125 experts across BCG contributed to the development of this systems workbench. Their inputs were instrumental to the development of SWITCH-GT.
Although our wind OEM example focuses on a small slice of the overall energy transition, it underscores the vital importance of the systems approach. As corporate leaders, policymakers, and investors reshape companies, industries, and economies to avoid the worst effects of climate change , this systems lens offers them the broadest possible view of energy transition dynamics—which in turn will help them make better decisions for businesses and for the planet.
Breaking Out of Silos
Many companies begin their decarbonization journey by looking within the immediate boundaries of their own business—their operations, product development, supply chain, and sometimes their industry’s ecosystem. This industry-specific view misses the potential interconnections and dynamics across sectors that may impact a company’s plans and returns over time.
To demonstrate the risk of this limited perspective, we compared a sector-based view of demand for 18 materials used in wind turbine manufacturing to a broader cross-industry view. (See Exhibit 1.) Our comparison uses a base scenario roughly aligned with a 2°C warming projection under the IEA’s 2022 Announced Pledges Scenario (APS) and assumes the requisite deployment of various technologies to meet that target.
Looking only at demand from the wind industry, it is unclear which, if any, of the materials face supply constraints in this decade. Taking a cross-industry view—integrating demand from industries such as solar, storage, auto, buildings, and aviation—completes the picture.

At least 13 key materials used in wind turbine manufacturing—including carbon fiber, copper, cobalt, neodymium, dysprosium, praseodymium, and terbium—face scarcity by 2030 under the cross-industry analysis. While potential shortages of some of these materials (particularly the rare earth elements) are well recognized and have been identified as a potential obstacle to the pace of the energy transition, possible supply dynamics for other materials are less well known.
The real-world implications of scarcities are significant , whether in driving up raw material prices, contributing to project delays, or even forcing operational or technical redesigns. In the wind industry, for example, scarcity drives higher project delivery costs; in the worst cases, it causes developers to park their projects at a time when the world desperately needs more capacity.
These constraints can be further shaped by several factors. Geopolitical developments, for example, can exacerbate shortages, with countries scrambling to secure supplies in a global economy where control of mining and processing is increasingly concentrated. Moreover, the demand for materials will change depending on how the numerous discrete transitions that are underway track above or below the APS trend in our base case. A different deployment trajectory for major transition technologies, such as EVs, wind power, solar power, and building efficiency improvements, would substantially shape the scarcity of various materials.
Understanding the Underlying Drivers
For the wind industry in our case study, the potential shortage in carbon fiber shown in Exhibit 1 is not widely recognized, and thus worthy of deeper investigation.
Carbon-fiber-reinforced polymer is replacing glass-fiber-reinforced polymer (fiberglass) as the dominant composite material used in the spar cap, which spans the length of a turbine blade and serves as a structural support. While carbon fiber is more expensive than glass fiber for wind applications, at more than ten times the cost, using a higher share of carbon-fiber-reinforced polymer in the spar cap creates lighter and stronger blades. As a result, wind OEMs can build longer blades capable of producing energy more efficiently—a particularly important factor in the offshore wind sector. The upshot: a potential shortage of carbon fiber could delay technology-based efficiency improvements in the wind industry.
Assumptions in Our Base Case
We assume that the share of total wind power generated by offshore wind turbines will increase from 7% in 2022 to 20% in 2030. Our model further assumes that wind turbine power capacity and blade length increase over time and that the blade design (including the use of fiberglass versus carbon fiber) is related to wind turbine size. The size distribution of onshore and offshore wind turbines, as well as the share of fiberglass versus carbon fiber blades, roughly aligns with Brinckmann’s Global Wind Technology Forecast from February of 2023.
The material composition of each wind turbine blade aligns with either reference blade SNL 100-00 (fiberglass) developed by Sandia National Laboratory or a modified IEA 15 MW turbine blade (carbon fiber) from the Offshore Renewable Energy Catapult. (The modified IEA reference blade is referred to as “carbon fiber” due to the use of that material in the spar cap, but it also includes fiberglass in its design.) The material mass was scaled using a relationship between blade length and weight; the scaling factor was 2.2, per Lawrence Berkeley National Laboratory.
We assume wind turbine blades use fiberglass blades in 100% of 50-meter blades, 80% of 70-meter blades, 22% of 90-meter blades, and 5% of 110-meter blades; we assume 100% of blades longer than 130 meters use carbon fiber designs.
This analysis assumes waste in wind ranges from 5% to 15% depending on the turbine blade component and material (fiberglass versus carbon fiber) and applies a 15% waste factor to carbon fiber in aviation, automotive, and other sectors. It also assumes that procurement of materials occurs in the same year as the installation of new wind capacity.
Supply figures are based on aggregation of available supply projections and, where available, include production expansions underway or announced to date.
Under our base case, demand for carbon fiber is expected to grow at a compound annual rate of about 20% through 2030. (See the sidebar “Assumptions in Our Base Case.”) This will create a sizeable gap between supply and demand, even considering production expansions underway or planned to date. In fact, meeting the projected carbon fiber demand in our base case would require building out new capacity at roughly three times the historical rate. (See Exhibit 2.)
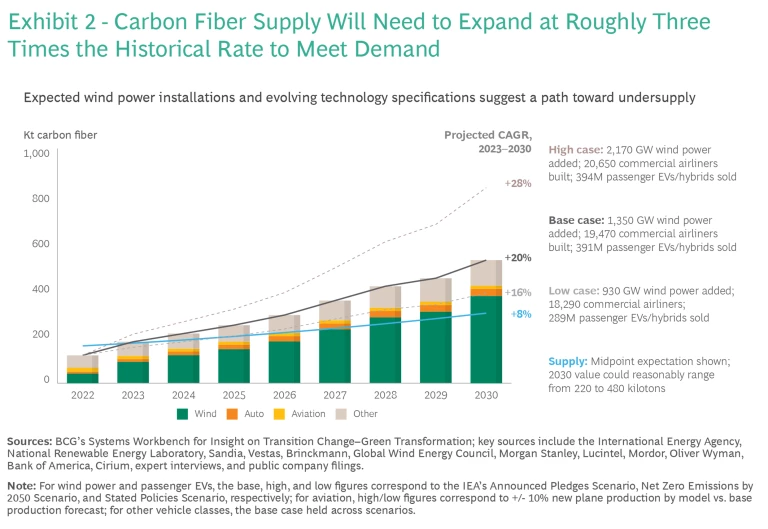
If we look at even more bullish demand scenarios within the wind sector and for other technologies like EVs, the predicted supply-demand gap is wider still. For example, based on the IEA’s projections for wind and EV demand aligned with a 2050 net zero scenario, total carbon fiber demand increases at a 28% compound annual growth rate through 2030.
Already, soaring demand has contributed to a 15% jump in carbon fiber prices since 2019. And critically, expanding carbon fiber production is laden with challenges beyond the capital requirements and time lags common to industrial project planning. For example, obtaining permits takes longer and navigating workplace safety regulations is harder due to the toxicity of certain precursor materials for carbon fiber, ultimately causing delays that deter expansion. It can take two or more years to build a new carbon fiber production facility.
Moreover, 77% of carbon fiber production occurs in the Asia-Pacific Economic Cooperation region; this geographic concentration of production further complicates supply dynamics, as it exposes supply chains to potential geopolitical disruptions.
Looking at the forecast above, wind OEMs will likely ask the following questions:
- First, is a pathway that relies heavily on carbon fiber in wind turbine manufacturing really feasible?
- If so, under which scenarios would carbon fiber supply meet demand?
- Which factors do we need to consider to better inform our decision making? For example, how do we weigh the tradeoffs in design choices that will impact carbon fiber demand? And for which industries can carbon fiber easily be replaced with an alternative?
In the face of potential carbon fiber shortages, wind OEMs will likely search for ways to limit future supply chain disruptions. This may include changing blade composition or delaying the deployment of larger turbines. If these choices are adopted industry-wide, that will alter both the demand for carbon fiber across the wind industry and the timing of that demand. (See Exhibit 3).
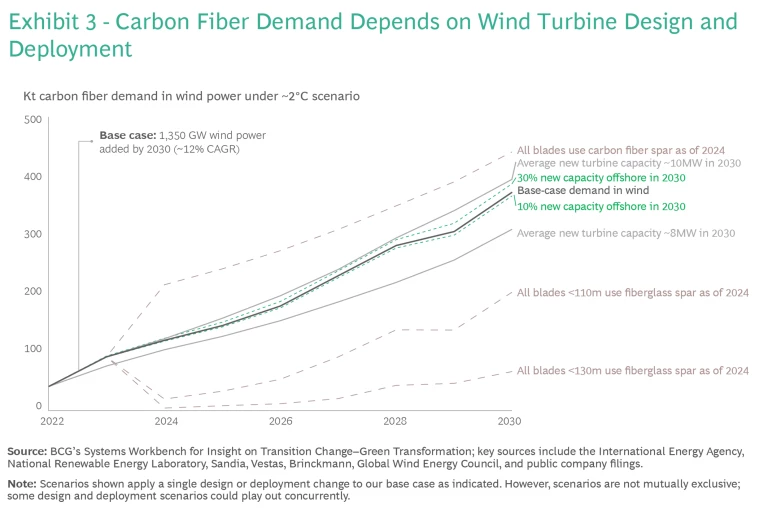
Beyond wind OEMs, automakers and aviation OEMs will also make engineering and sourcing decisions that will shape carbon fiber demand. Similarly, the extent to which carbon fiber manufacturers expand production in the face of this bullish forecast will further shape the risk of scarcity. The wind turbine manufacturer in our case study must consider different scenarios for carbon fiber demand, including those from other industries, as well as scenarios for the possible expansion of carbon fiber supply, and then map out how these changes would affect the underlying economics of their business. That will help them select the best strategy to assure profitable growth.
If a wind turbine manufacturer concludes that using carbon fiber is too risky without further action, then it may aggressively commit to pursuing long-term production contracts, strategic coinvestments, or even acquisition and further corporate development. Alternatively, the company may shift its material mix toward fiberglass over carbon fiber where feasible. In fact, some manufacturers still use fiberglass designs for turbine blades greater than 100 meters in length.
Examining Cascading Effects
So, what are the implications of a decision by the wind turbine OEM in our example to rely more on fiberglass for its blades? To answer this question, a good starting point is to create a systems diagram. (See Exhibit 4.)
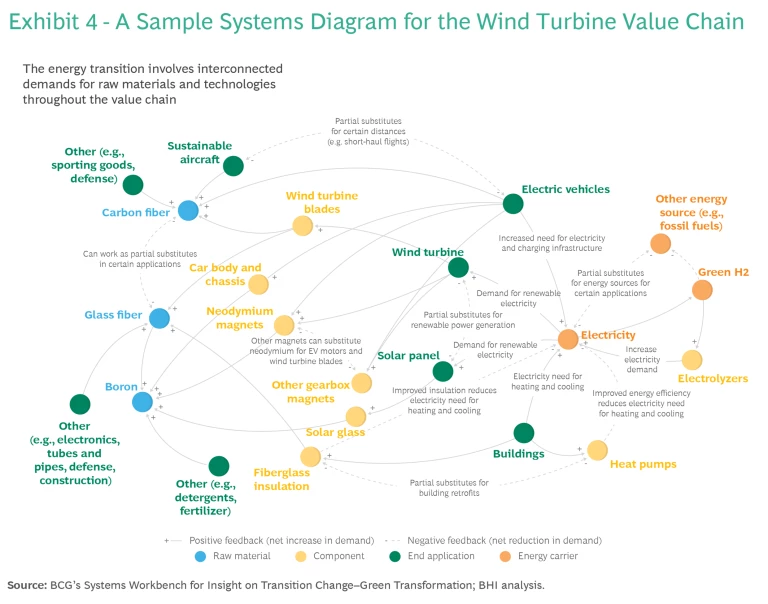
Even this simplified version illustrates the interconnections between demand for carbon fiber, glass fiber, and other technologies and materials in the energy transition. We also include boron here as an example of the roughly dozen materials added to glass fiber to tailor its material properties. Each bubble in the diagram has its own dynamics that can be modeled.
This systems map helps identify relationships the wind turbine OEM in our example should explore, including what actions could potentially prevent a supply crunch in carbon fiber and the ramifications these actions would have for closely connected materials like fiberglass and boron.
To bring these dynamics to life, we crafted two scenarios to examine what interventions in the wind industry could bring the carbon fiber market to a more stable supply-demand equilibrium. Starting from our base-case projections, we gradually increased the share of small and medium turbines using fiberglass spar caps in Scenario 1. In Scenario 2, we applied the same conditions as in Scenario 1 and layered in a slower deployment of carbon-fiber-intensive larger turbines.
In Exhibit 5, we show how each scenario plays out for carbon fiber, glass fiber, and boron. The blue line shows the base-case supply for each material, with the shaded area indicating a reasonable range on the high and low side.
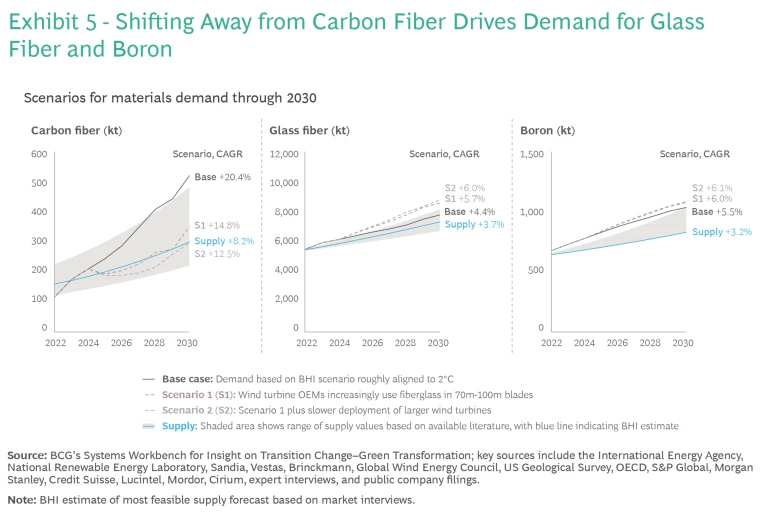
If demand shifts away from carbon fiber, the knock-on effects for fiberglass producers will be immediately apparent. What was a nearly balanced market for glass fiber shown in Exhibit 1 is now supply-constrained.
The mismatch between glass fiber supply and demand reveals a weakness in the way companies often assess supply constraints. Industry supply forecasts typically rely on projecting past trends into the future using industry rules of thumb, often built over years of predictable growth. That means that companies may miss a large structural change in demand, in this case driven by the confluence of multiple green transitions—which can create risk for those companies looking to secure scarce materials and opportunity for those that can step in to meet demand.
Let’s assume that glass fiber producers are able to rapidly expand capacity by securing permits, engineering and building facilities with furnaces and refractories, and obtaining the license to operate within two years. After all, history has demonstrated a fairly resilient fiberglass market given its geographically dispersed production and its varied end applications. Even in this case, reverting to more glass fiber creates different cascading effects and another challenge emerges: a surge in demand for boron, an already scarce material that is an additive in the production of the most common formulation of glass fiber.
Boron is required for the manufacture of more than 300 products. This includes well-established industrial uses in products such as detergents, fertilizers, and insulation as well as newer clean energy uses, such as neodymium magnets for direct-drive wind turbines and select EV motors, boron steel, solar applications, and neutron absorbers in nuclear power plants.
A shift in demand for a single material, such as boron, could have ripple effects throughout an industry.
Already, prices for boron have doubled since 2020. Our projections in Exhibit 1 suggest boron demand could exceed supply by roughly 20% by 2030—and that doesn’t account for the potential volality of supply and demand in the meantime. On the supply side, boron mining and processing are geographically concentrated, and the world’s largest known deposits are already being mined today. Opening a new boron mine has historically taken upwards of 20 years. Increased reliance on glass fiber could therefore increase a producer’s exposure to potential price spikes and supply bottlenecks for boron.
Certainly, innovation could help mitigate the impact of boron scarcity. For example, we may see substitution, with intermediate glass fiber producers swapping out boron for another material—or two, or three—depending on how well the other material(s) can mimic boron’s chemical contribution to the product. These new glass fiber formulations could ripple through the market, with implications for production utilization, time lags, and prices. This in turn would cause a different cascade beyond wind, extending to other value-added fiberglass applications like automotive and aviation.
Integrating Systems Thinking into Green Transition Strategy
This exercise examines the uncertainty, complexity, and cascading effects surrounding just a few factors affecting raw materials for a wind OEM. A holistic, integrated systems lens would not only consider the full range of material inputs but also assess other factors such as:
- The labor required to manufacture and assemble the wind turbines
- Costs and externalities of expanding mining, refining, and manufacturing
- Infrastructure and logistics limitations for scaling bigger turbines
- Policies and regulation impacts
- Trade flows and geopolitical vulnerabilities
- Adoption and integration rates into the grid
The transition to net zero is the challenge of our time. We are struggling to push decarbonization quickly enough to avoid the most dire impacts of climate change; a primary reason is the sheer scale of the undertaking and the fact that we cannot decarbonize everything everywhere simultaneously.
The good news is that we now have the tools—including extensive data, advanced analytics, AI, and systems-dynamics and agent-based models—to meet that complexity head-on. Through platforms such as SWITCH-GT, business and government leaders can leverage these tools to shape a systems approach to the energy transition. There is no time to waste.
The authors would like to acknowledge Marek Davis, Joshua Chakravarty, and Sandra Starkey for their outsized contributions to the development of SWITCH-GT. Additionally, we would like to thank Jens Gjerrild and Lars Holm for their contributions as experts on wind energy.


