
There are three truths about revenue growth. It’s imperative. It’s perilous. And it’s possible regardless of your industry or starting point.
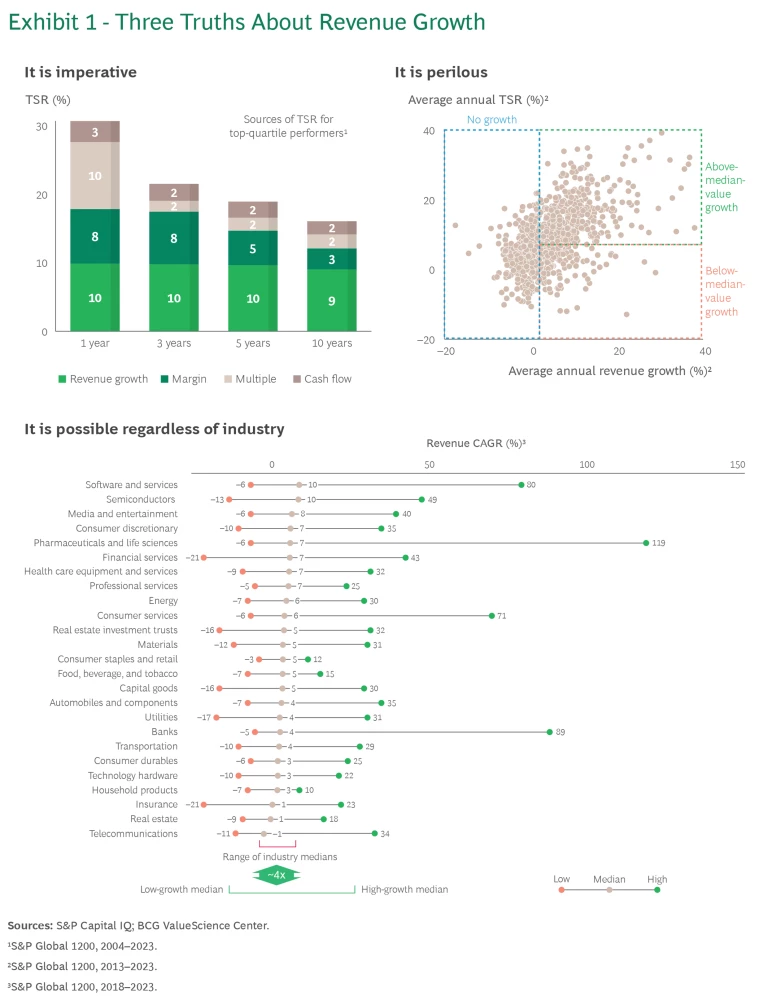
Revenue growth is imperative because, depending on the time horizon, it drives from 32% to 56% of total shareholder return (TSR). It’s perilous because more than one-third of companies deliver below-median TSR despite growing faster than the rate of inflation. It’s possible because the range of growth within industries is much wider than the range of median growth rates across industries. (See Exhibit 1.)
And there’s a fourth, critically important truth: there is no single path to growth. Many companies achieve it by doubling down on the core. Others do it by moving into adjacent markets. And some grow by exploring new, more distant frontiers. Growth can occur organically or via acquisition. It can result from product, service, or business model innovation, from geographic expansion, or from new pricing and go-to-market strategies.
Our latest research on growth confirms these truths. Ultimately, getting growth right entails making smart choices and investing time and money in them. We unearthed insights from successful growers that can help others choose their optimal growth path. Crucially, our analysis revealed that the right path to growth depends on a company’s starting point.
The Search for Growth
We started with the universe of all public companies that reported financial data for the 20-year period from 2004 to 2023 and had revenue of at least $5 billion in 2014. This yielded a sample of 1,784 companies. Within that universe, we identified 330 growth champions that delivered exceptional, peer-beating revenue growth for a period of five or more years at some point during the two-decade period. Among these growers, not all succeeded in translating exceptional growth to exceptional value for shareholders. Just 57% outperformed the S&P 1200—and about 17% actually destroyed value.
We studied these companies’ growth paths, looked for clusters of similar blends of growth moves across core, adjacencies, and new frontiers, and sought factors that were predictive of the clusters we identified. We found that looking at companies in a matrix defined by two variables—one a dimension of industry attractiveness (market growth rate) and the other a proxy for company performance (company share trajectory)—was the most illuminating.
Six Starting-Point Archetypes
Within the four quadrants of the matrix defined by gaining or losing share and by fast or slow industry growth, we identified six starting-point archetypes, each associated with different strategies to drive revenue growth and, ultimately, value. (See Exhibit 2.) We’ll discuss each archetype in turn from the vantage point of the matrix quadrant that it falls into.
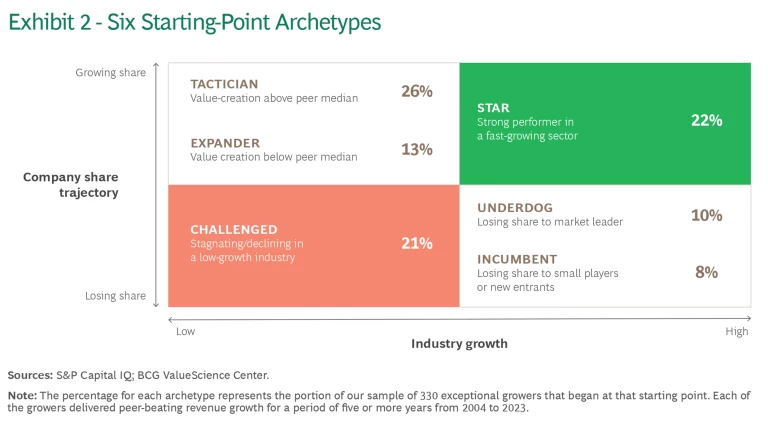
Gaining Share in a Fast-Growth Industry. Growers in this quadrant of the matrix find themselves at the right place, at the right time, with the right offer. We call them Stars. Companies in this archetype are having their moment in the spotlight, and they need to press their advantage while it lasts. Success requires a laser focus on scaling and achieving executional excellence in the core and potentially taking advantage of near adjacencies. Consistent with the imperative to scale, Stars typically spend 30% more on sales and marketing as a percentage of revenue than companies in other archetypes.
In an industry that was growing at 7%, payments leader Visa fueled a ten-year run of 13% per year revenue growth—and delivered a TSR of 27% per year between 2008 and 2018—by expanding its geographic reach and investing heavily in marketing to build the brand and encourage broader use of cards.
Losing Share in a Fast-Growth Industry. If you’re not winning in an attractive industry sector, something is wrong. Maybe it’s poor execution of a winning strategy, maybe your offering suffers from some type of structural disadvantage, or maybe both. The generic strategy in this situation is to fix what’s broken and then scale for success. However, our analysis identified two underlying starting-point archetypes tied to competitive dynamics:
Underdogs are losing share to the market leader or leaders. Perhaps operating at smaller scale leaves them at a price disadvantage relative to the leader. Or they don’t have a presence in the fastest-growing geographies. Or they lack privileged access to key manufacturing inputs. Or their product, service, or customer experience isn’t sufficiently compelling. They need to improve or sharpen the focus of their core offer and possibly build scale and reach. In our sample, Underdog growers spent 45% more on M&A (as a percentage of market cap) than the average M&A spending across all 330 growers.
In 2013, Steris was a $1.5 billion supplier of sterilization equipment for hospitals, pharmaceutical companies, and life sciences researchers. Company leaders realized that it was essential to adjust Steris’s exposure to the more cyclical equipment sales business by building up services revenue. At the time, the company’s main service business, contract sterilization, represented just 12% of revenue and was at a significant scale disadvantage to market leader Sterigenics. By 2018, Steris’s revenue had risen to $2.6 billion, with contract sterilization accounting for 20% and services overall for 38%, and its TSR had grown by 19% per year. Steris drove this growth both organically and through acquisitions, most notably via its $1.9 billion acquisition of Synergy Health, which transformed its contract sterilization business. As a result of this acquisition, Steris vaulted into a leadership position, expanding its geographic footprint from 19 facilities in North America to 59 facilities across the globe.
Incumbents are losing share to upstarts. Maybe they’re late to the next new thing in their industry or struggling to navigate disruption. To grow, these companies need to extend and reposition. Like Underdogs, they spike on M&A—likely to acquire new capabilities, place strategic bets, or buy their way into the next game—spending 43% more (as a percentage of market cap) than the average for all archetypes.
In the early 2010s, Constellation Brands faced many challenges to its portfolio, including the rise of small craft-beer suppliers, a slowing in its international business, and a softening in the lower-end wine business. It approached these challenges head on. Constellation was an early mover in reshaping its North American distribution network with the goal of strengthening its business by partnering more deeply with distributors. It invested in the strength of its beer brands including Corona, stopping price declines and launching bold campaigns such as “find your own beach.”’ It divested businesses—for example, part of its international business and its lower-end beer, wine, and spirits business—and used the proceeds to move up-market in wine and spirits and to expand its beer-production capacity in Mexico. In a move that nearly doubled the company’s sales, it also purchased the remainder of Grupo Modelo’s US beer business, giving it an exclusive perpetual license to sell Modelo and Corona in the US as well as a state-of- the-art brewery facility in Mexico. It then invested to build Modelo into another powerhouse Mexican beer brand alongside Corona. Investors rewarded these moves by making Constellation one of the top TSR performers of the past decade.
Losing Share in a Slow-Growth Industry. Companies in this matrix position, which we identify as the Challenged archetype, face headwinds that go beyond the relative unattractiveness of the industry in which they compete. They’re losing share to rivals because of disruption to the products, services, or business models they offer or because the features, cost, and execution of those offerings are less appealing than the competition’s. They need to pivot to grow. The 21% of companies in our sample that ultimately achieved breakout growth from this starting position tended to spend 18% more on R&D as a percentage of sales than companies in other archetypes—inventing their way into a winning position in an adjacency or new frontier.
The market for film for analog cameras peaked in 2000. By 2005, it had fallen by 50%. Faced with a precipitous decline in its core business, Fujifilm deftly managed a remarkable transformation. It launched a dedicated research lab in 2006. It moved into adjacencies—for example, developing new applications for triacetate cellulose, a key material in camera film, in the manufacture of flat-panel displays. It also pivoted to new frontiers. It leveraged its fine chemistry expertise to enter the cosmetics business, launching Astalift in 2006. And it expanded into pharmaceuticals through several acquisitions, beginning with Toyama Chemical in 2008. These new businesses were a significant growth engine that offset the rapid decline of film, and their contribution to company revenues increased accordingly, from about 40% in 2001 to 86% in 2023. Although Fujifilm’s top-line revenue has remained essentially flat since 2010, investors have rewarded the company’s efforts with average annual TSR growth of 9.6% for the decade ending in 2023.
Gaining Share in a Slow-Growth Industry. A company that is winning in a slow-growth industry sector is clearly doing something right. It likely offers some combination of superior products, attractive prices, and dependable service. Consolidation strategies aimed at becoming the “last man standing” are not enough. Growers in this quadrant chart a path to adjacent markets or to new frontiers. Interestingly, nearly two-fifths of our successful growers started in this quadrant.
Our analysis revealed two distinct starting-point archetypes in this quadrant, distinguished by differences in their value-creation track record:
Tacticians have made the best of a tough situation, gaining share and delivering above-median total shareholder returns. Their credibility with investors has earned them the trust to make incremental and more radical moves to establish a position outside the declining core, and they use that trust profitably. Their level of M&A activity outside the core is 71% higher than growers in other archetypes.
In 2008 Brooks Automation was a leader in the highly cyclical market for semiconductor equipment. In 2010, new CEO Steve Schwartz launched an initiative to look for sources of growth beyond the core. As part of that effort, Brooks discovered that researchers in the field of life sciences were citing the company’s patents. Digging deeper, they realized that the company’s expertise in moving materials in a vacuum at ultralow temperatures could be of huge value in handling human tissues—a highly fragmented market. By 2012, the company had completed four acquisitions in the bio-banking space and had mapped out a series of adjacent opportunities across the “cold chain,” from sample collection through analysis. This led to further acquisitions and significant organic growth. By 2017, life sciences represented about one-fifth of Brooks Automation’s revenue, and the company’s market capitalization had quadrupled to $2.2 billion. Today, after the $3 billion sale of the original semiconductor business to private equity, the pure-play life sciences business is the market leader, with a $3 billion market cap.
Expanders have achieved growth, but historically they have delivered below-median value creation. Before considering a move to an adjacency or new frontier, companies in this archetype need to rev up their core performance to translate growth into superior value creation, typically through moves to strengthen competitive advantage, improve business economics, and rebalance the portfolio.
After a period of below-median TSR from 2013 to 2018, industrial distributor Fastenal turned things around. From 2018 to 2023, it achieved sales growth of 8.2% per year, in an industry growing at about 2.5%, while also delivering TSR at an annual rate of 22.2%. The driver: its “growth through customer service” strategy, which focused on serving larger customers better. Proximity was a key factor. During the period, the contribution of its onsite business—essentially customer-specific stores in or near customer locations—grew from 21.8% to 39.8% of revenue. This involved increasing the number of onsite locations from 894 to 1,822 while rationalizing the company’s existing retail store portfolio.
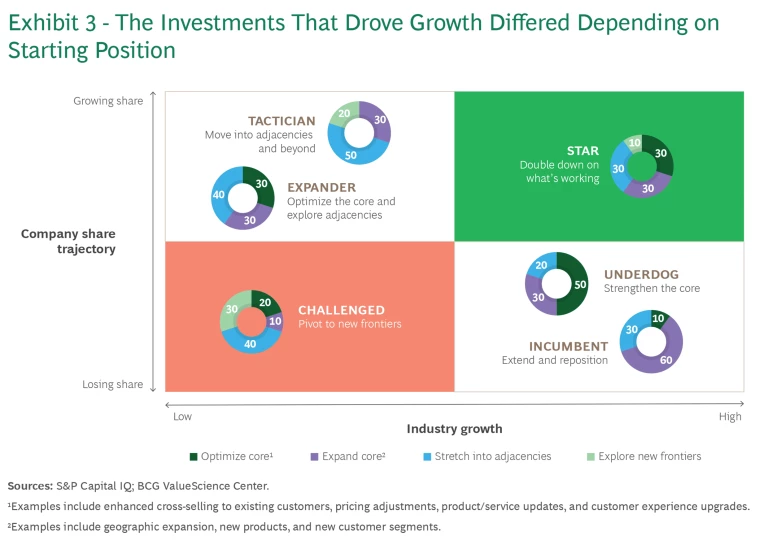
Exhibit 3 summarizes how growth investment patterns differed by starting point.
Putting off revenue growth is not an option, but embarking on the right path is a four-step process. First, perform a diagnostic analysis to clarify your company’s starting point and competitive advantages. Second, distill detailed lessons from the experience of successful growers that were in your company’s position. Third, develop a set of growth options consistent with your business’s position and advantages, and evaluate the promise and probability of each. And fourth, choose a path and invest to make it happen.


