Executive summary
Key Explanations
- Inflation impact hasn’t been uniform. Some countries export significantly more of products which have seen large price increases in recent years, making their performance look relatively impressive in nominal terms. However, in real terms the gap in performance isn’t as large (particularly when compared to more similar countries such as France).
- Many areas which have boomed aren’t UK strengths. There has been a rise in demand for products such as fuels and chemicals. However, often the areas which have seen highest growth aren’t those which the UK exports much of (e.g. fertilisers and natural gas), meaning the rise in demand had a disproportionately larger benefit for others.
- Underperformance in areas of strength. Traditionally stronger UK exports such as road vehicles and pharmaceuticals have also underperformed peers. This is the result of a mix of factors including Brexit, underinvestment, and structural issues such as higher energy prices.
Key Recommendations
- Don’t fight the last battle. Given its strengths, the UK is unlikely ever to be able to take advantage of booms in commodities or finished goods. A new strategy should think about where future booms might take place, such as in green tech/industries.
- Build a joined-up sector strategy to better protect the competitiveness of the UK’s strong sectors. This is not about picking winners but helping our businesses navigate an increasingly distorted trading landscape and manage market failures (e.g. on emissions).
- Target smaller, strategic trade partnerships. Now that its approach of seeking to strike broad free trade agreements (FTAs) has run its course, the UK should look for partnerships focused on technologies or industries, with a view to supplementing its areas of comparative advantage with skills it doesn’t have, and improving security within supply chains.
- Improve trade relationships with the EU and US. Much of the poor performance in trade can be accounted for in the UK’s trade with these partners, especially the US. Targeting improvements in these relationships should be a priority.
Much has been said in recent years about the end of globalisation and a decline in international trade, most of it overdone. However, there is no doubt we are in a new phase. Industrial strategies are changing the global economic landscape, while geopolitical tensions and the move to a multipolar world mean global supply chains are being overhauled, with a renewed focus on economic security and green industrial policies. The flow of goods, services and capital is becoming more complex.
Like many other countries, the UK faces both challenges and opportunities in navigating this ‘new normal’ – but with the added complexity of still determining the impact of Brexit on its trading relationships and dealing with the fallout.
To develop a new trade strategy for this changing landscape, we must first understand what is really happening to UK trade, the extent of challenges faced and the drivers behind the changes we have seen. So far, this debate has been largely absent in the UK, with most commentary simply ascribing changes to Brexit. While this has undoubtedly had a significant impact, it has been far from uniform across the economy. Limiting a discussion of the UK’s trade challenges to this single factor misses important nuances and may hide wider issues.
How Has UK Trade Performed Compared to Peers?
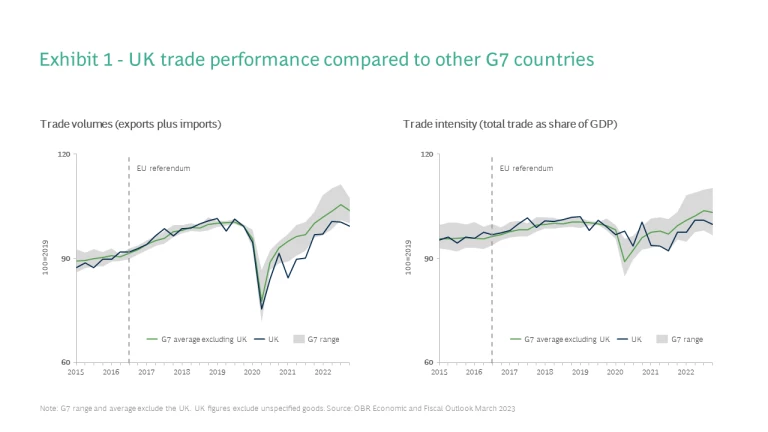
It has been well documented that UK trade intensity (share of goods and services imports and exports as a share of GDP) has lagged peers in the post-Covid economic recovery (Exhibit 1). However, this is rarely unpacked to determine the significance of this challenge and its drivers.
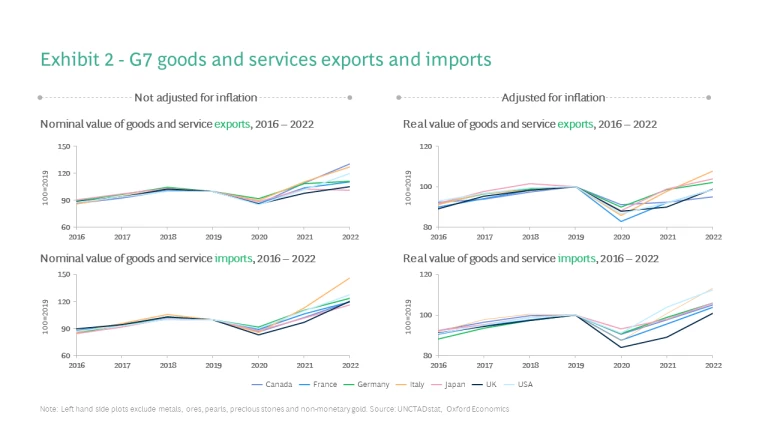
As Exhibit 2 shows, the UK has lagged peers on both imports and exports. Services have not been responsible for this: the UK’s services trade has recovered well since Covid, although imports took some time to do so. Among the G7 countries, the UK has seen one of the highest growth rates in services trade. UK global service exports have remained strong, even after adjusting for inflation. As highlighted recently by the OECD, global trade in services took 18 months longer to recover to pre-Covid levels than trade in goods. As a country with a large proportion of services trade, it is to be expected that the UK’s overall trade intensity will have taken more time to recover. Given this, we will focus on the country’s goods trade performance.
UK Goods Exports and Imports Have Underperformed Peers
Exports
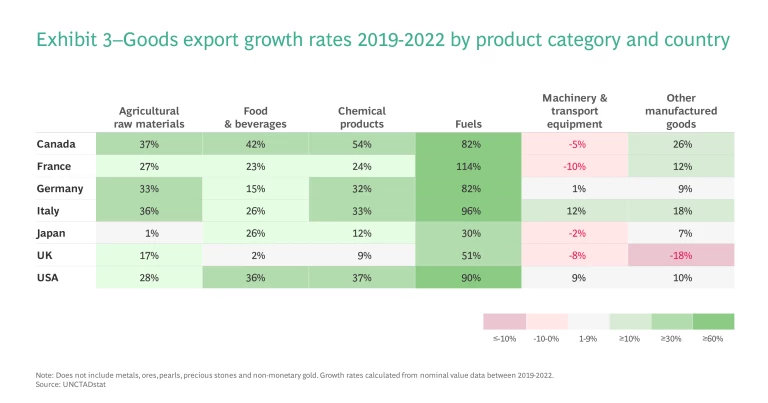
The UK’s poor export performance in goods is consistent across almost all product categories. The UK ranks in the bottom two among the G7 for goods export growth since 2019 in all major product groupings (Exhibit 3). The consistency of this poor performance is surprising, because the UK saw relatively higher positioning against G7 peers from 2016-2019 compared with 2019-2022 (Exhibit 8).
We think there are three explanations for the UK’s poor performance.
Factor 1: Inflation Impact Has Not Been Uniform Across Countries
The export performance gap narrows between UK and G7 peers when inflation is accounted for, though it does not improve the picture for imports (Exhibit 4). This suggests that the inflation impact hasn’t been uniform when it comes to goods trade – the trade value figures of some countries have been more inflated than others.
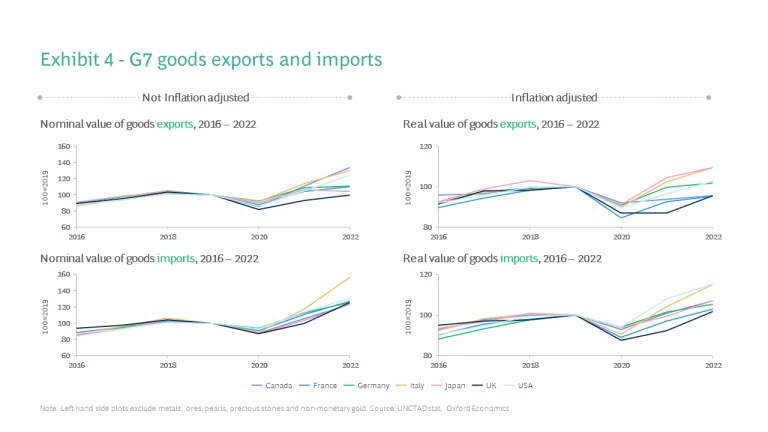
This is because some countries will have exported or imported more of those products that have seen the highest levels of inflation.
Between 2019 and 2022, the categories with the highest growth in global exports from G7 countries were:
- Fuels (83% growth)
- Chemical products (29% growth)
- Agricultural raw materials (29% growth)
- Food items (27% growth).
The UK experienced lower growth in all these categories relative to G7 peers (Exhibit 3). Some of this can be put down to an inflation effect – fuels and chemicals in particular saw massive increases in prices.
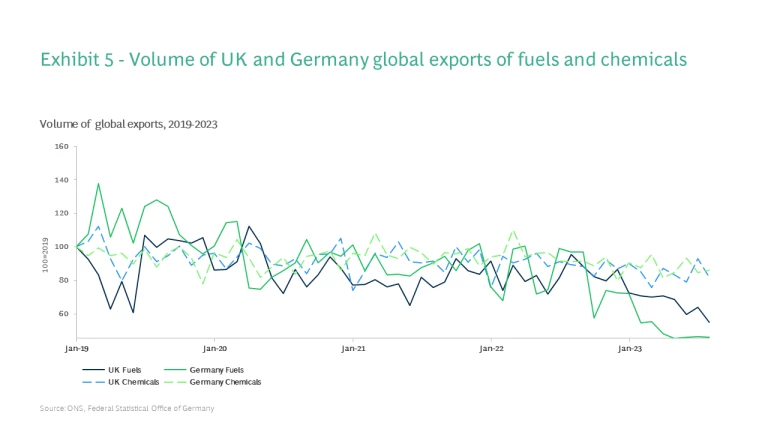
For example, in value terms, Germany saw its exports of fuels and chemicals rise by 82% and 32% between 2019 and 2022. This compares to 51% and 9%, respectively, for the UK in the same products. However, when looking at the volume data, we see a different story. As Exhibit 5 shows, exports of fuels and chemicals from the UK and Germany followed very similar paths.
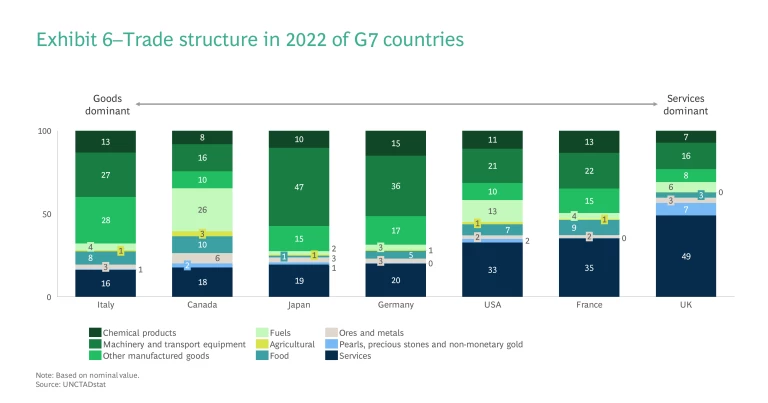
In an environment with more trade distortions and volatile inflation choosing the right benchmarks and comparisons is important. Whilst comparing to similar economies within G7 is a natural benchmark, the group’s constituent countries have very different trade structures and exposures (Exhibit 6). The UK has the highest proportion of service exports and the lowest of manufactured goods. This means that of the G7 nations, the UK’s trade portfolio is most similar to France and the US. Given the difference in size of economy to the US and the fact the US has been much less exposed to the energy price shock, France is a more appropriate benchmark.
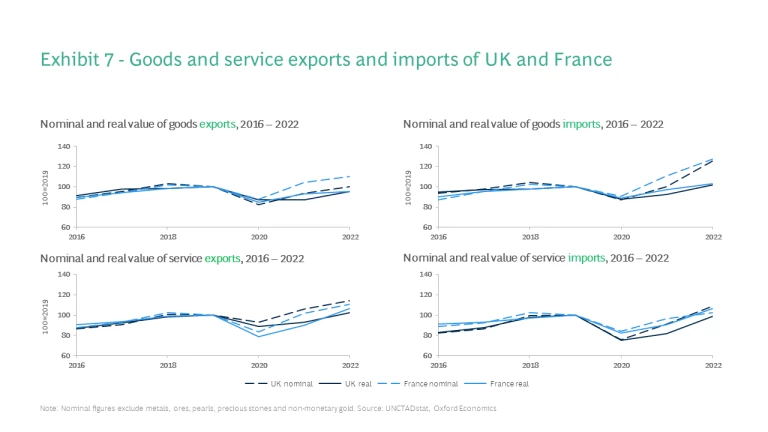
There is little difference between UK and France in real terms trade performance (Exhibit 7). The decision of which countries to compare to is particularly important when it comes to modelling counterfactuals. While some countries may have shown similar trade trajectories to the UK over the past two decades, the trading environment was also much more benign – meaning significant differences in trade structure and exposure were less relevant. In a more distorted environment, these countries are unlikely to be representative of a path that the UK could be expected to follow. Italy is a good example of this, where from 2010 to 2019, trade as a share of GDP averaged 29%, compared to 30% in the UK. By 2022, it was 33% for the UK and 37% for Italy – a massive jump thanks to its predominantly manufactured goods exports.
Once the effects of inflation are accounted for and the right benchmarks are chosen the performance gap is much smaller and, in the case of the above comparison with Germany on chemicals or France overall, closed. This all provides a partial explanation then of why the headline value data makes the UK look worse than others.
Factor 2: UK Not a Top Producer of Goods Categories that Experienced Boom
However, the inflation effect alone does not fully account for why price and demand rises for some global commodities benefitted other countries more than the UK. In many cases, this is because the UK was not a major exporter of the products that experienced both a rise in prices and an increase in demand for new supply lines.
For example, the UK exports extremely limited volumes of agriculture and food items and therefore would never have seen much benefit from the growth in these areas.
The UK does, on the other hand, export large quantities of fuels and chemicals. To understand why it may not have benefited more from growth in fuel and chemical products, we need to know which specific products were driving growth.
Given the significant disruption to fuel supply chains in the wake of the Russian invasion of Ukraine, high growth was observed across many different types of fuel (petroleum, coal, electric current and natural gas).
Between 2019 and 2022, G7 countries saw highest growth in global exports in electric current (303%) and natural gas (160%), followed by coal (82%) and petroleum (62%). Over this period, the UK saw a 278% increase in exports of natural gas, the joint second highest growth among the G7, as the country exported gas to European peers that lacked the facilities to land and vaporise LNG. The UK also exported 24x the value of electricity in 2022 vs 2019, switching from being a net importer to net exporter of electricity across its interconnectors with continental Europe. However, natural gas and electricity only represented ~30% of the total export value of fuels for the UK in 2022. The remaining 70% was from petroleum, which saw a smaller increase in demand/price (see Exhibit 6). The UK’s fuel growth therefore lagged other countries overall (Exhibit 3), making its relative trade performance look poor.
Fundamentally, the types of fuels exported from the UK exports were not those that saw the highest growth overall, nor those where high growth came from a low base.
Traditionally, chemical products have been considered a relative strength among UK goods exports. But the UK’s particular strengths within this category lie in pharmaceuticals and organic chemicals. Between 2019 and 2022, the chemicals that saw the highest growth among the G7 in global exports were fertilisers (127%) and inorganic chemicals (62%). The UK’s exports of these two categories only made up a total of 2% of its total chemical export value in 2019. The UK was therefore unlikely ever to be able to take advantage of the boom in these products.
This all tells us that part of the remaining gap in trade performance, even in real terms, is caused by the fact that the UK is neither competitive nor a major exporter in many of the areas that have seen booms in prices and demand over recent years.
Factor 3: UK Underperformance in Areas of Export Strength
Whilst the UK may not have been expected to compete in the product categories explored above, we would expect to see a relatively stronger performance among the UK’s top exports. Exhibit 8 shows the UK’s top two products in 2019 per major goods category.
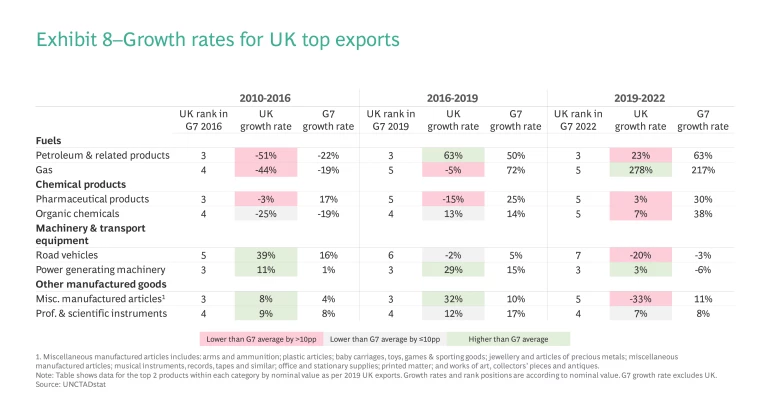
For six of the eight products in Exhibit 8, the UK saw lower growth from 2019-2022 vs 2016-2019. This was worse than the trend for the G7 average (excluding UK) which saw lower growth in only four of the eight products.
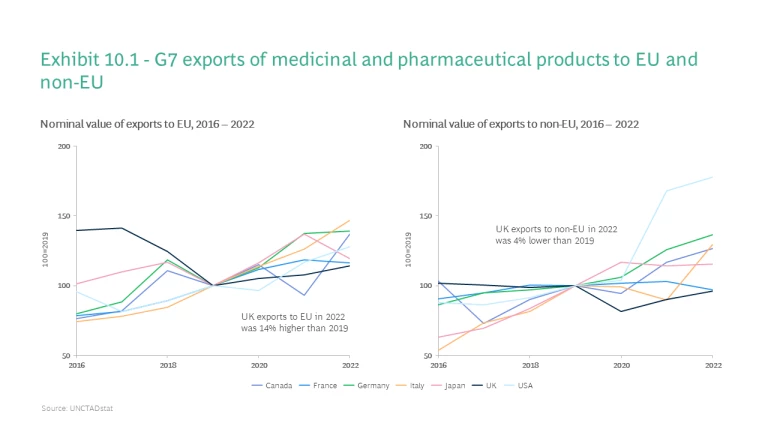
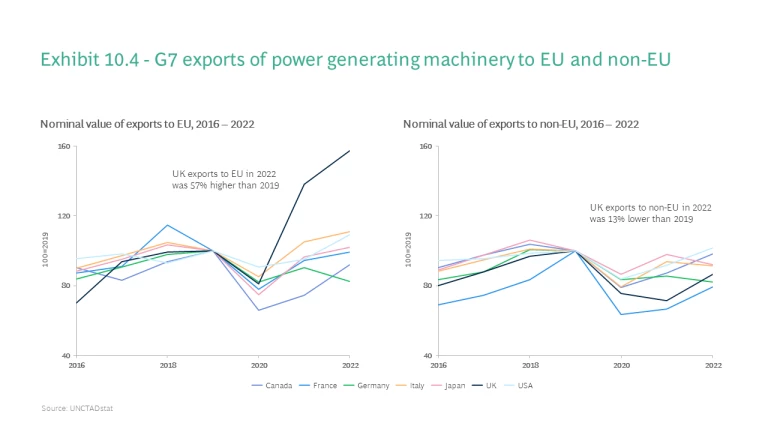
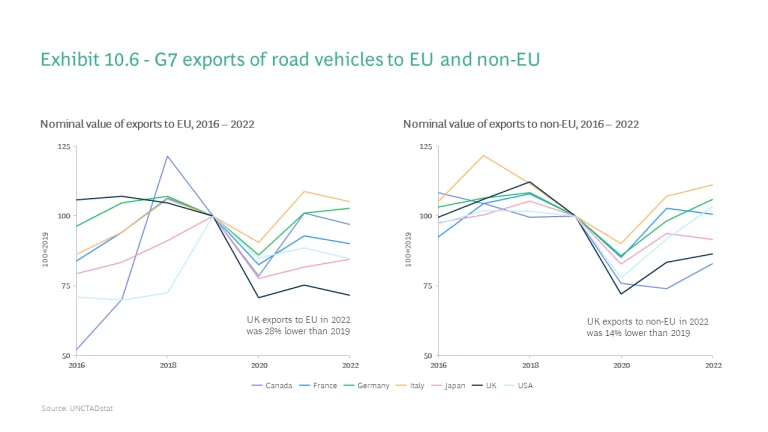
For trade between 2020-22, the UK’s growth rate was more than 10 percentage points lower than the G7 average for five of the categories. This trend looks to have preceded 2019 for pharmaceutical products and road vehicles, both of which were seeing negative growth from 2016-2019 (also observed in Exhibits 10.1 and 10.6).
There are several potential underlying reasons, including reduced production and lower investment in the UK.
For pharmaceuticals, the UK has become a less attractive destination for investment, resulting in site closures by major multinationals. As examined in the Centre for Growth’s report ‘ Towards a Healthier, Wealthier UK: Unlocking the Value of Healthcare Data ’, the UK’s clinical trials environment has deteriorated relative to peers, which will have knock-on effects for UK exports in this space. The Medicines and Healthcare products Regulatory Agency (MHRA) has faced significant capacity constraints since the UK’s exit from the European Medicines Agency (EMA), impacting the attractiveness of the UK and its regulatory regime in pharmaceuticals. This will have fed through into the competitiveness of the sector and its exports.
Reduced investment in the UK may also have contributed to the decline in growth for road vehicle exports. This sector has also faced supply chain challenges, notably in semiconductors. In addition, after the EU referendum, the UK’s business investment flatlined. This has been particularly acute for the road vehicle industry. UK business investment in transport equipment peaked in 2016/17 but fell by close to 30% in 2018 and had not recovered before being hit again by Covid in 2020. While investment has shown signs of recovering at the end of 2022 and during 2023, the timing of the downturn of investment is particularly problematic given the need to invest significantly in the shift to EVs, an area in which the UK has fallen behind. Furthermore, UK business expenditure on automotive R&D grew rapidly between 2009 and 2018 but has since declined. Earlier this year, the Society of Motor Manufacturers & Traders reported that car production remained 32.5% below 2019 levels. The global environment has also become more competitive, with China becoming a major exporter of vehicles, particularly EVs, in recent years.
For pharmaceuticals and road vehicles, the UK’s exit from the EU is likely to have been a major factor in reducing trade. It has disrupted established supply chains, increased the cost base for many producers and made exporting to the UK’s largest market more challenging and/or costly. Since Brexit, the UK has gone from best to worst G7 performer for EU export growth in these two industries.
All Factors are Common Across UK Goods Exports to EU and Non-EU Countries
Too often though, the UK’s trade challenges are blamed on Brexit alone. There is no doubt that it has had significant and wide-ranging impacts, but focusing on this single explanation misses some important nuances and hides wider challenges.
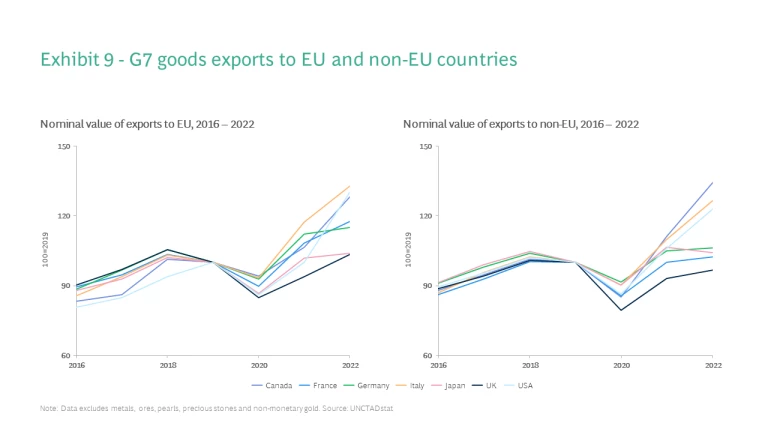
The UK’s trade performance with non-EU countries has also faced challenges (Exhibit 9). Since 2019, six of the UK’s top ten goods export categories (by value) have seen lower growth with non- EU countries than with EU countries. Some of this could be the result of Covid disruption and some non-EU countries seeing slower recoveries. However, it holds even for countries with the strongest economic recoveries.
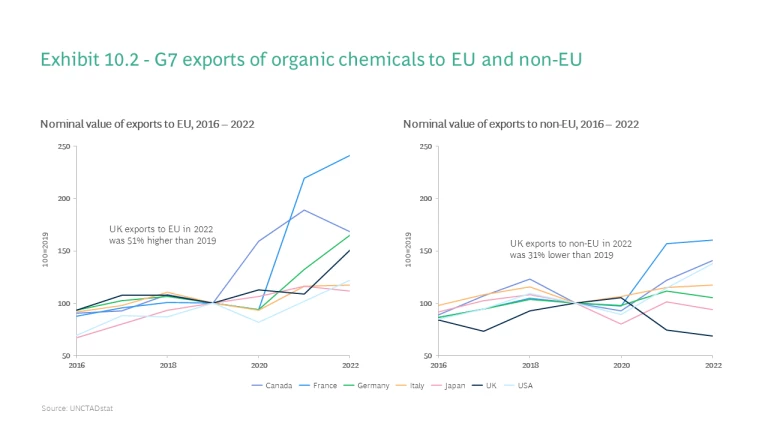
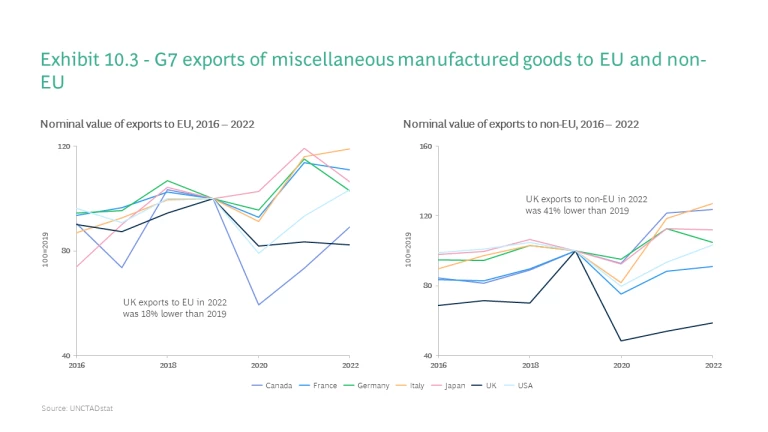
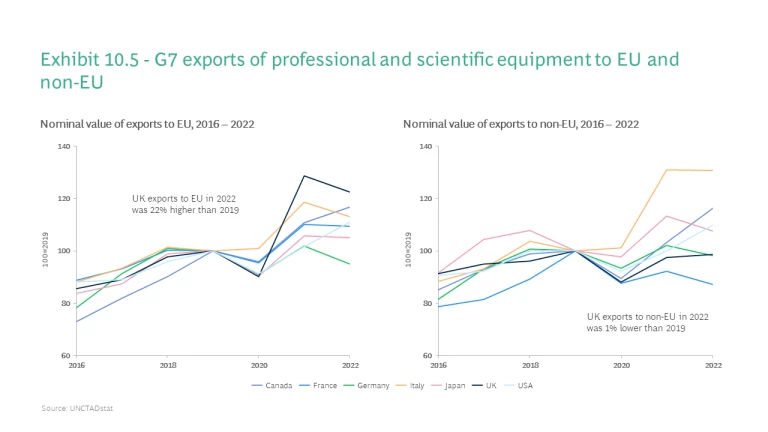
Looking at the products from Exhibit 8 as examples of products across a range of goods categories (Exhibits 10.1-10.6), the only example where non-EU exports are higher than EU is road vehicles (Exhibit 10.6). This is an industry that has been hit particularly hard by additional barriers to trade after Brexit, from customs formalities to VAT accounting.
The UK’s largest non-EU trading partner is the US. Between 2019 and 2022, UK exports to the US fell by 11% (Exhibit 11). The other G7 nations saw an average of 21% growth over the same period. It is also interesting to compare the UK’s 11% decline in exports to the US with its 4% growth in exports to the EU over the same period (Exhibit 11).
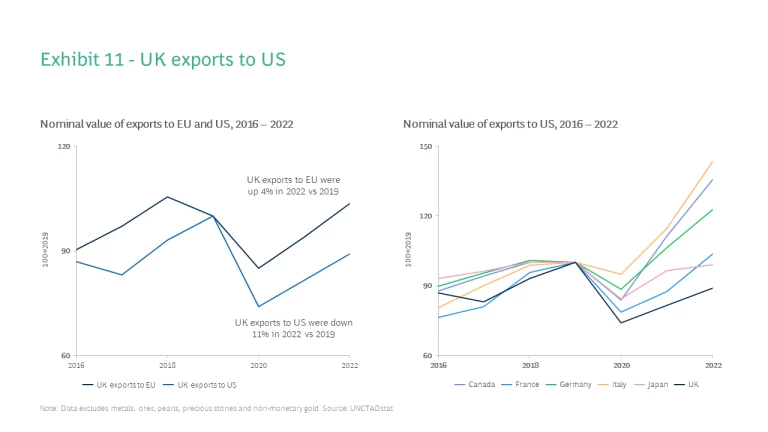
This is a worrying trend at a time when many had hoped that non-EU trade could help make up for challenges in EU trade. Indeed, this has been the case for imports to some extent, where the UK’s non-EU imports have been stronger than EU imports, which have plateaued since 2019.
It is certainly possible that Brexit has played a role in the poor performance of UK trade with non-EU countries. Knock-on effects from supply chain disruptions and reduced competitiveness, as well as more time spent dealing with compliance and other requirements for EU trade, may well have had an impact. This is likely to be true for sectors such as road vehicles and pharmaceuticals. However, it is not enough to explain areas where goods exports to non-EU countries have significantly underperformed exports to EU countries.
What’s behind the UK’s particularly poor performance in exports to non-EU countries? It is probably a mix of the factors discussed above combined with unique challenges in certain sectors.
For example, UK trade with the US has suffered in two ways: from the UK not producing products in which the US has seen significant import growth (such as finished electrical products, certain raw materials and energy related products); and from the poor performance of previously strong UK exports to the US (such as organic chemicals). In 1995, the UK and Ireland exported the same value of organic chemicals to the US, while China exported one tenth of that amount. In 2022, the UK exported a similar value of organic chemicals to the US as in 1995, while China exported 52x and Ireland exported 31x that amount. There have been ebbs and flows in this period, but where others have seen consistent growth, the UK has stagnated or declined. This is potentially the result of a lack of investment into high-value chemicals production.
There are also structural challenges in the UK that may be holding exporters back, such as high energy prices. For example, the recent poor export performance of the UK’s chemicals industry (an energy intensive sector) may be related to the significant rise in costs of production caused by higher energy prices. While the energy price shock is a common challenge across countries, the nature of the UK’s energy system means that the pass-through of higher energy costs to businesses was larger than most other countries, and from a base where energy prices were already structurally higher than many of the UK’s peers.
Imports
The UK’s goods imports have also been slower to recover than G7 peers. When we look at UK imports from EU and non-EU countries, there is a clear distinction. UK imports from the EU fell during 2020 and have remained at a similar level, in contrast to G7 peers, who have all since exceeded 2019 levels. By comparison, UK imports from non-EU countries have seen strong growth that is in line with, if not exceeding, that seen by other G7 countries. This non-EU growth has, however, not been enough to make up for low EU imports. After inflation adjustments, the UK remains behind G7 peers in terms of growth in imports (Exhibit 2). In contrast to the more complex picture of goods exports, this pattern suggests that the main structural barrier facing UK imports is Brexit. In many cases, the added complexity has seen those exporting to the UK from the EU decide to focus on other markets. Furthermore, with the UK border not yet being fully implemented or enforced for imports from the EU, we could see further disruption.
What Lessons Can We Learn From The UK’s Recent Trade Performance?
With a new, more complicated trading environment likely to remain for some time to come, there are several lessons we can learn from the UK’s recent trade performance. These fall into two categories – analytical and practical. Without action, it is likely that UK’s trade with major partners such as the EU and US will continue to struggle.
Be Realistic About When The UK Can Capitalise on Trade Booms
Given the UK’s trade structure, it is unlikely that the country will be a major beneficiary of cyclical goods or commodity booms. The UK does not produce the raw materials or finished products that see significant demand and price increases during such periods. While some advocate redeveloping a larger traditional manufacturing sector in the UK, this would be incredibly difficult and also akin to fighting the last war. The focus should be on what is coming: a likely increase in certain types of goods trade driven by net zero policies and/or technological innovations. The UK needs to decide where to position itself to be able to capitalise on these trends. For example, compared to broader manufacturing, the UK has certain strengths in goods trade with high R&D components, such as aerospace.
Sector or Industrial Strategy
As we have previously set out, the UK needs greater clarity on the areas where it wants to compete and to better protect areas of strength. Several sectors where the UK used to see strong trade growth have floundered in recent years – and not all can be put down to Brexit. International trade is increasingly distorted by subsidies and trade defences. Focused and strategic support for the sectors in which the UK wishes to succeed is more important than ever. This is not about picking winners but helping to offset global market failures and distortions.
This also shouldn’t be about seeking to revive industrial or manufacturing trade alone, but thinking about areas of UK strength and potential comparative advantage. UK services continue to perform well and should not be forgotten. A programme to continue to support services exports and to open up new opportunities as demand grows from emerging markets will be crucial. This approach must also go beyond a pure trade lens and be joined up with the approach to promoting innovation and investment in these sectors.
Smaller, Targeted Deals
The UK’s approach of seeking to strike broad and comprehensive free trade agreements (FTAs) has largely run its course. Beyond those deals that are relatively close to signature, there are unlikely to be any major deals on the horizon. The UK would be better to pivot towards agreements targeted at certain technologies and/or supply chain areas that are vital to UK competitiveness. Often, these will not take the form of typical FTAs but are more likely to be focused on strategic cooperation in emerging areas. For example, as we have noted before, the UK has prioritised clean hydrogen but has not struck a single international agreement in this space, while most competitors have multiple deals. These deals focus on partnering with countries that have different strengths and on ensuring cooperation in areas such as standards, subsidies and emissions.
Improve Certain Partnerships
Looking at the data, the poor performance of goods exports has been driven primarily by poor trade performance with the EU and US, which is unsurprising as they account for almost two-thirds of UK trade. When it comes to the EU, there are certainly improvements that can be made to the current UK-EU Trade and Cooperation Agreement – from a veterinary agreement to improved mobility provisions. But we shouldn’t expect these to make a material difference to UK-EU trade flows. Only a major shift on a customs union or single market, which neither major political party is currently considering, is likely to have a material effect. Even if such a shift did happen, there are no guarantees that supply chains that have now unwound would return to previous levels.
It is also worth considering better engagement in emerging areas, for example, better collaboration on issues such as carbon capture and storage, energy trading schemes and offshore wind. The US also presents challenges, not least given its current focus on industrial strategy rather than trade partnerships. However, its approach presents certain opportunities – for example, EU and South Korean exports of EVs to the US have grown 2.5x and 1.5x respectively since the start of 2022. Targeting technology-specific partnerships with the US, particularly in green industries, could present an opportunity for improved trade performance.
