The BCG Sustainable Economic Development Assessment (SEDA) is a new methodology that provides a dynamic perspective on the well-being of populations in 150 nations by assessing a broad range of social and economic dimensions over three time horizons: current level of development, recent progress, and long-term sustainability. SEDA scores can be used to measure how well a country translates its wealth, or income, into the overall well-being of its population. (See "How SEDA Measures Development" for definitions of terms.)
How SEDA Measures Development
SEDA takes more than one perspective on socioeconomic development. Here is an explanation of key terms:
- Current level shows how well a country is performing on ten dimensions of socioeconomic development based on the most recent data available. The dimensions are income, employment, income equality, economic stability, health, education, governance, the environment, infrastructure, and civil society.
- Recent progress measures how much a country has achieved over the most recent five-year period for which data are available along the same ten dimensions of development.
- Long-term sustainability assesses the "enablers" that help improvements on each of the ten dimensions of socioeconomic development continue into the next generation. It is measured on the basis of ten key sustainability factors: education and skills development, health care, investment capacity, public finances, economic institutions, infrastructure development, economic dynamism, social development, demographics and employment, and macroeconomic management.
- The wealth to well-being coefficient compares a country’s current-level SEDA score with the score that would be expected given its per capita GDP and given the average worldwide relationship between current-level score and per capita GDP, as measured in terms of purchasing power parity. A coefficient greater than 1 indicates that a nation’s living standard is higher than what would be expected given its per capita GDP, while a coefficient of less than 1 indicates that its living standard is below what would be expected given its per capita GDP.
- The growth to well-being coefficient compares a country's recent-progress SEDA score over the most recent five years for which data are available with the score that would be expected given its per capita GDP growth rate and given the average worldwide relationship between recent-progress score and per capita GDP growth rate during the same period. A coefficient greater than 1 indicates that a country has improved the well-being of its population more than would be expected given its GDP growth rate, and a coefficient of less than 1 means that it has failed to improve well-being to the extent expected given its GDP growth rate.
SEDA provides a variety of angles from which to tell a rich, instructive story about the dynamics of socioeconomic development. A nation’s development scores can be compared with those of the remaining 149 nations included in our assessment. They can also be used to make numerous other useful comparisons—for example, with countries in the same region or those with similar income levels, or, in some cases, with fast-growing emerging-market or oil-producer peers.
For the purposes of this report, we used SEDA outputs to show which countries have the highest current levels of development and which have achieved the most progress recently. We also assessed which countries are better at converting their current level of development and their recent progress into well-being for their populations. Finally, we looked at which dimensions of socioeconomic development stand out as the most significant in differentiating leading countries in terms of both current levels of development and recent progress.
Current Well-being
Not surprisingly, many of the wealthiest countries have the highest current-level development scores. Western European nations such as Switzerland and Norway dominate the top 20, which also include Australia, New Zealand, Canada, the U.S., and Singapore. (See the Appendix for complete scores.)
What distinguishes the top performers, other than that they enjoy the advantages of already-high income levels? By far, governance is the dimension of socioeconomic development on which the countries with the highest current-level SEDA scores most outperform the rest, on average. These nations enjoy solid political stability, freedom of expression, and low levels of corruption—issues with which many less developed nations still struggle. Civil society and infrastructure are other important differentiators. And while there are also differences in terms of the quality of health care and education, what really distinguishes the highest performers are such factors as the power of citizens to participate in the political process, express themselves freely, and trust in public safety and the legal system. SEDA cannot tell us, of course, whether good governance is the cause or the result of a high level of socioeconomic development. It may well be both. But clearly, governance matters.
Converting Wealth into Well-being
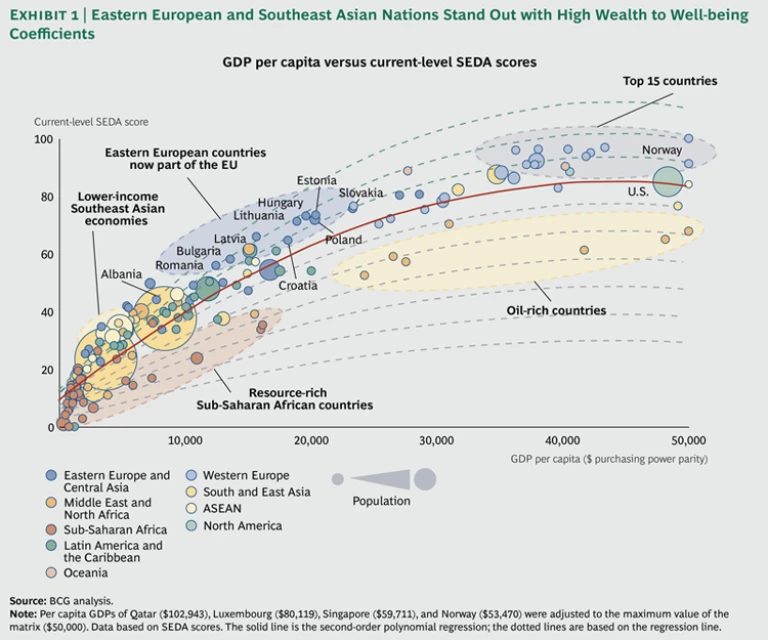
By looking at a nation’s current-level development score in the context of its per capita GDP, SEDA offers a way of assessing how successfully a country has converted its wealth into broad-based socioeconomic development—or well-being—for its population. To visualize the pronounced differences among the 150 countries assessed, we plotted the per capita GDP and current-level SEDA score of each one. We quantified the results by calculating the wealth to well-being coefficient for each nation.
Several of the wealthiest nations—and all the top 15 countries by current-level SEDA score—are relatively strong performers in translating wealth into well-being. Clusters of Eastern European countries, including Albania and Romania, and such lower-GDP Southeast Asian nations as Indonesia, the Philippines, and Vietnam, also stand out as having translated income into higher living standards. (See Exhibit 1.) It is notable that a number of petroleum- and mineral-producing states in the Middle East and Africa show relatively low performance in converting wealth into well-being.
Norway, which scores highest on current level of development and has a wealth to well-being coefficient of 1.19, illustrates the general excellence required to convert high per capita GDP into high living standards for a population. Norway exceeds the average current-level score of the top 15 nations on nearly every dimension. It is among the best in the world in terms of civil society, income equality, and governance. In education, Norway outperforms the remaining 14 economies as a group in pupil-teacher ratio and is one of the best in years of primary to tertiary schooling.
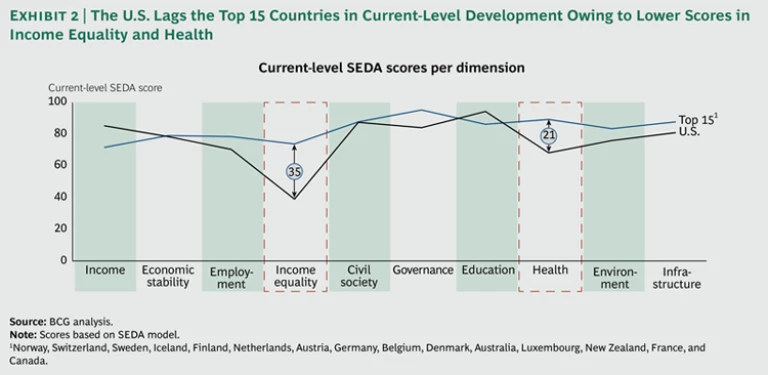
It may seem surprising that the U.S. does not score higher—as it often does in global indices. The U.S. has a wealth to well-being coefficient of slightly less than 1, compared with an average coefficient of 1.1 for the 15 nations with the highest current-level scores. The U.S. outperforms the top 15 as a group in per capita income. It also outperforms in education, thanks largely to very high enrollment in tertiary schools, and is on par in measures of civil society and economic stability. But it is below the average of the leaders on every other dimension. (See Exhibit 2.) The greatest gap is in income equality. The U.S. also ranks relatively low in health for a nation at its income level—in part because of high levels of obesity and the incidence of HIV
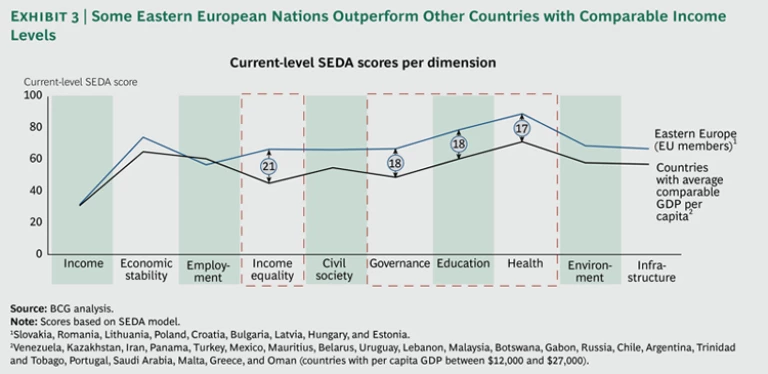
We studied nine Eastern European members of the European Union with high wealth to well-being coefficients to understand what sets them apart from other economies with comparable per capita income. The average coefficient of these nations is 1.2, well above the average of 0.9 for the 23 other economies we studied that have annual per capita incomes in the same range ($12,000 to $27,000). On average, the nine countries outperform the 23 comparable nations on every dimension except employment, where the difference is negligible. (See Exhibit 3.) They are most ahead in terms of income equality, governance, health, and education (Eastern European students test well in math and science); they also perform well on measures of property rights and safety
By contrast, the petroleum-rich Gulf Cooperation Council states (Saudi Arabia, Bahrain, Kuwait, Oman, Qatar, and the United Arab Emirates) have wealth to well-being coefficients of less than 1. The average for the group is 0.8. This suggests that these nations have not yet translated their wealth into widespread living standards comparable to those of nations with similar per capita incomes. The biggest gap is in education. Many Gulf states have low tertiary-enrollment rates, and their students perform relatively poorly in math and science. Low scores on press freedom in several Gulf nations pull down rankings on governance, while lack of gender equity harms rankings on civil society.
This does not mean that the Gulf states are failing to take steps to improve living standards. Indeed, one explanation for their low development scores is that oil and gas revenue represents relatively new wealth. Most of the Gulf states are investing to improve K–12 education , build modern universities, and upgrade health care. They are also introducing important reforms. Many are even taking steps to evaluate and plan their overall future. Qatar’s National Development Strategy 2011–2016, for example, clearly lays out development priorities across several sectors. But development takes time. The full impact of investments in education, health care, infrastructure, and the institutions needed to manage modern economies will take years to materialize.
Recent Progress
The economies that have achieved the greatest relative improvements in overall living standards over the past five years are scattered across the globe. What’s more, nations with the top 20 recent-progress SEDA scores represent a range of per capita incomes, from less than $1,000 per year in some African countries to more than $80,000 per year in Switzerland.
Brazil scores the highest in terms of improved well-being over the past five years. Several other Latin American nations, including Peru and Uruguay, are also in the top 20. Three African nations that in past decades were engulfed in crisis—Angola, Ethiopia, and Rwanda—show some of the strongest recent gains in living standards. Asian countries scoring among the top 20 in recent progress include Cambodia, Indonesia, and Vietnam.
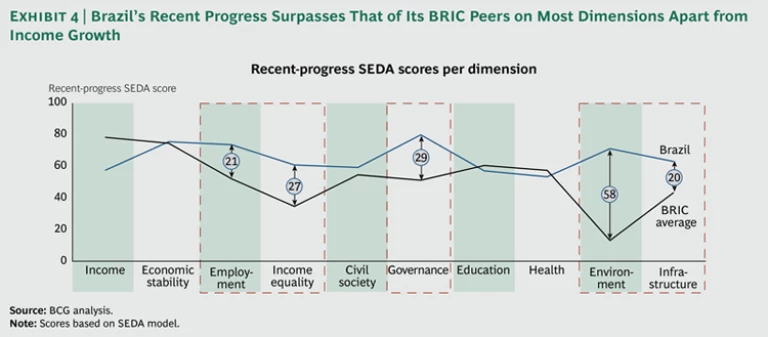
We also compared Brazil’s performance with that of its counterparts in the so-called BRIC emerging markets, which comprise Russia, India, and China in addition to Brazil. (See Exhibit 4.) While it lagged the others in income growth between 2006 and 2011, Brazil significantly outperformed the BRIC average in recent progress in the environment, governance, income equality, employment, and infrastructure.
Improving income equality has been a particular policy focus of the Brazilian government in recent years. Brazil has narrowed the income gap between rich and poor considerably over the past decade, reducing extreme poverty by half. The share of Brazilian children attending school, meanwhile, has risen from 90 percent to 97 percent since the 1990s. Programs such as Bolsa Familia (or “family allowance”) illustrate the government’s commitment to raising the incomes of the poor. Launched in 2001, the program distributes stipends of around $12 per month to 13 million impoverished families for each child in the household, so long as he or she continues to attend school.
Other BRIC countries are also beginning to focus more on equality. India, for example, while enjoying relatively high GDP growth, has thus far underperformed in translating that growth into improvements for its citizens in employment, governance, civil society, and environment. To encourage progress in these areas, the Indian government has made “inclusive growth” a high priority in its most recent five-year plan.
Converting Growth into Well-being
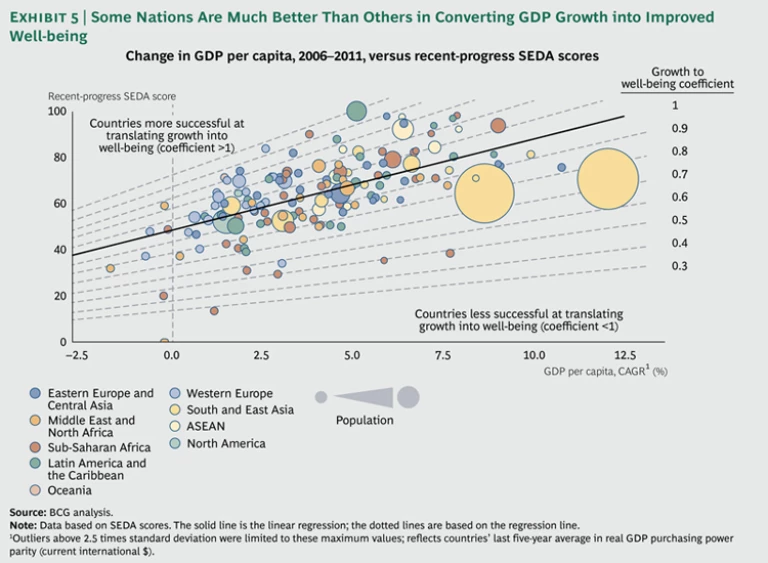
Which countries are best at translating their economic growth into broad-based social and economic development? Similar to what we did when measuring the conversion of wealth into well-being, we calculated growth to well-being coefficients by comparing—for the 150 countries assessed—per capita GDP growth over the past five years against recent-progress SEDA scores.
Interestingly, performance in translating growth into well-being appears to be much more varied than performance in translating wealth into well-being. (See Exhibit 5.) This could just indicate that five years is too small a timeframe in which to measure the impact of increases in income on socioeconomic development. But the wide variance could also provide clues to differences in performance from which policy insights can be gained.
With a growth to well-being coefficient of 1.5, Brazil scored highest on this measure. The Eastern European nations of Albania and Poland and the Southeast Asian nations of Indonesia and Cambodia also scored in the top 20. So did some high-income nations, such as Switzerland, New Zealand, France, and Australia, and such African nations as Kenya and the Republic of Congo (that is, Congo-Brazzaville, as distinct from the Democratic Republic of the Congo).
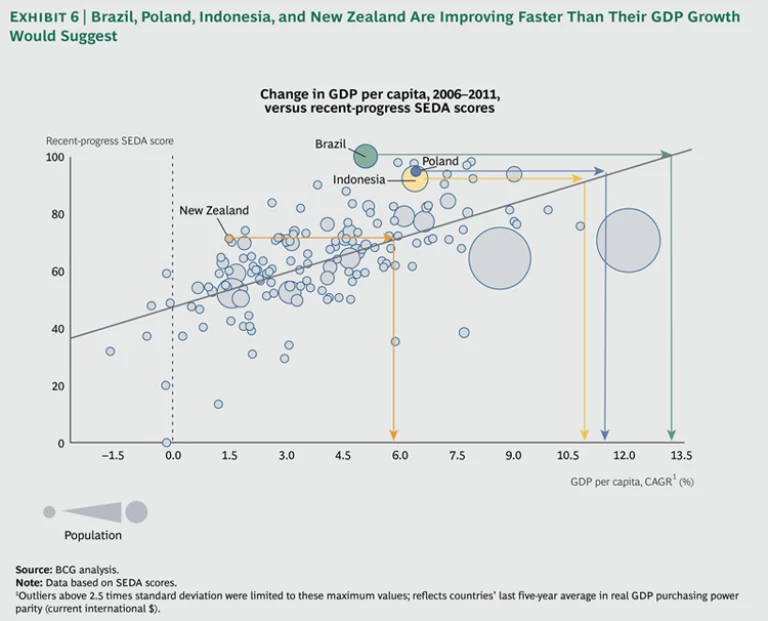
To put the performance of different countries into perspective, it is helpful to calculate the GDP growth equivalent of gains in well-being achieved over the past five years. Brazil, for example, averaged annual GDP growth of only 5.1 percent from 2006 through 2011, yet managed to generate gains in well-being that would be expected of an economy expanding by an average of more than 13 percent per year. (See Exhibit 6.) Similarly, New Zealand’s economy grew by around 1.5 percent per year over that period but delivered improvements in well-being that would be expected of an economy growing by 6 percent per year. Poland and Indonesia produced gains in well-being that would be expected of economies growing by around 11 percent, even though their per capita GDPs grew by around 6.5 percent per year.
Analysis of the SEDA scores of New Zealand and Brazil shows that these countries’ recent progress exceeded their GDP growth from 2006 through 2011 on virtually every dimension. In the case of Poland, recent progress in employment and governance significantly exceeded the country’s rate of GDP growth, while Indonesia outperformed on improved economic stability, employment, and governance.
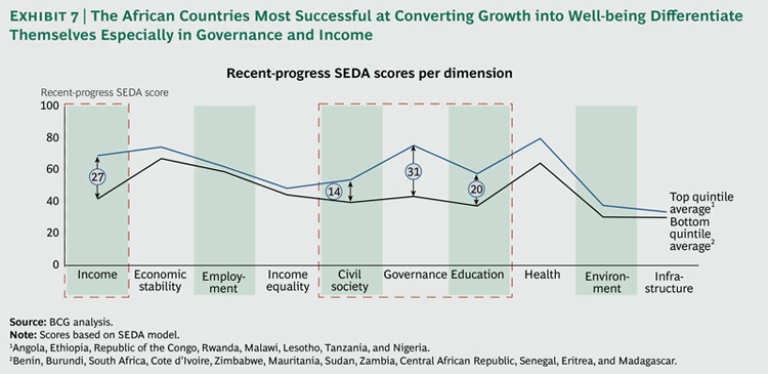
Sub-Saharan Africa provides a case study of what differentiates countries that are the most successful at converting income growth into improved living standards from countries at comparable levels of development that perform poorly. We compared the 8 African nations in the top quintile of recent-progress SEDA scores, whose average growth to well-being coefficient is 1.2, with the 12 in the bottom quintile of recent-progress scores, whose average coefficient is 0.6. The African nations in the upper quintile outperformed those at the bottom on every dimension. (See Exhibit 7.
However, the dimension that most differentiates the overperformers is governance. Rwanda, for example, has achieved strong improvements in terms of corruption, violence, and property rights. Rwanda also rates high among its peers in measures of political stability.
The next-biggest differentiator is income growth. Ethiopia achieved the sixth-highest percentage growth in GDP among the 150 nations between 2006 and 2011, and Angola—which benefited from rising oil prices—was eleventh; both countries are in the top quintile of scores for recent progress. Also important is these nations’ relative performance in improving education and civil society. The Republic of Congo (Brazzaville) achieved the largest gains in education in the world over the past five years, albeit from a low base. These were reflected in sharp increases in the number of teachers and the number of years of school attendance. The African nations in the bottom quintile registered the least improvement, on average, in environmental stewardship, education, infrastructure, and income. They also scored low as a group in governance and civil society. Countries with the very worst performance in converting growth into well-being experienced considerable political and social strife.
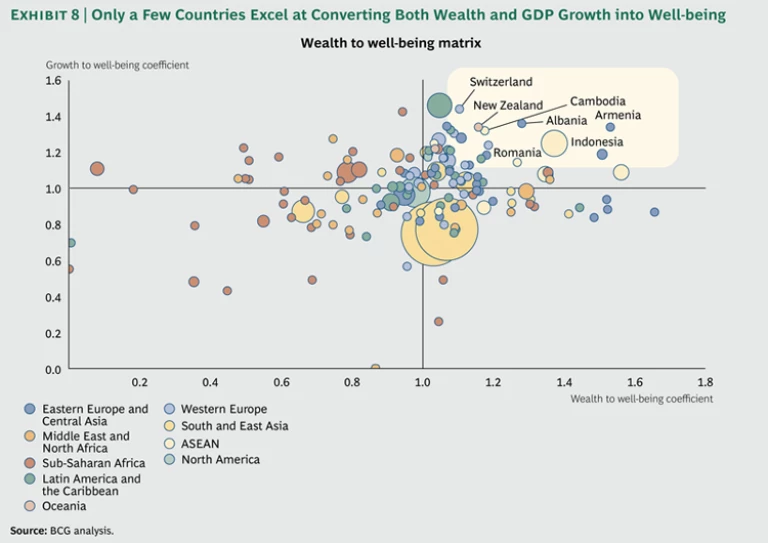
It is interesting to look at the wealth to well-being and growth to well-being coefficients together. Only a handful of countries outperform on both measures, and they represent all levels of GDP. New Zealand, Romania, Armenia, Indonesia, and Cambodia are among the nations that have been successful at converting both wealth and growth into high levels of well-being for their populations. (See Exhibit 8.
