In the global struggle to manage the cost of
health care, payers, providers
, and policymakers are increasingly focusing on value—that is, on improving outcomes while also maintaining or
The U.S. health-care system offers a kind of “natural experiment” for evaluating the differential impact of some of these models on the cost and quality of care. The United States is one of the few countries that employ multiple payer models in parallel, and has done so for some time, making possible a real-world comparison of their impact on health outcomes and costs.
A case in point is Medicare, the government program that covers some 52 million Americans who are 65 and older or who suffer from chronic disabilities or end-stage renal disease. Roughly three-quarters of the Medicare-eligible population see doctors and other providers on a traditional fee-for-service basis, with the costs of the services reimbursed directly by Medicare. About a quarter, however, are enrolled in Medicare Advantage health plans provided by private insurers. These plans offer a more managed system of care delivery—for example, through preferred provider organizations (PPOs), health maintenance organizations (HMOs), capitated health networks, and other delivery models. Medicare pays the insurer a set amount per patient, and it is the insurer’s responsibility to pay any claims.
What distinguishes these Medicare Advantage plans both from traditional fee-for-service medicine and from one another is the degree to which they make use of three organizational mechanisms that are meant to encourage the delivery of cost-effective quality care: a selective network of providers, financial incentives that are aligned with clinical best practices, and active care management that emphasizes prevention in an effort to minimize expensive acute care.
Research has begun to suggest that these health plans are successful at cutting costs compared with fee-for-service medicine. One recent study, for example, found that utilization rates in some major categories, including emergency departments and ambulatory surgery or procedures, generally were 20 to 30 percent lower for patients enrolled in Medicare Advantage HMOs than for those with Medicare fee-for-service
But what has been the impact of such plans on health care quality? In the past, there were widespread concerns, especially on the part of the general public, that cost savings came at the expense of quality of care. In the 1990s, for example, HMOs came in for major criticism for denying medically necessary services to patients, ostensibly in order to control costs. And even today, the assumption that higher cost is synonymous with better quality remains
To better understand this issue, The Boston Consulting Group recently analyzed claims data for some 3 million Medicare patients. We found that on three internationally accepted dimensions of health care quality—single-year mortality, recovery from acute episodes of care requiring hospitalization, and the sustainability of health over time—patients enrolled in Medicare Advantage plans had better outcomes than those participating in Medicare on a traditional fee-for-service basis. The Medicare Advantage patients had lower single-year mortality rates, shorter average hospital stays, and fewer readmissions. They also received higher levels of recommended preventive care and had fewer disease-specific complications.
Our findings demonstrate that the more managed plans do not compromise quality. Just the opposite: they deliver higher-quality care than fee-for-service medicine and thus do a better job of improving health care value. Payers, providers, and policymakers worldwide can learn a lot from the differences between fee-for-service and the alternative care-delivery models used in Medicare Advantage plans.
Breaking the Compromise Between Cost and Quality
In recent years, health care professionals and policymakers have come to understand that the relationship between cost and quality is rarely simple or straightforward. Spending more money does not necessarily deliver better care. The U.S. spends about 18 percent of GDP on health care every year (roughly $2.8 trillion), compared with about half that amount in other developed countries. And yet, in nearly every disease group tracked by the 34 countries constituting the Organisation for Economic Co-operation and Development, U.S. health outcomes are below the OECD
The Medicare Advantage plans that we studied represent a fundamentally different health-care-delivery model from traditional fee-for-service medicine. To varying degrees, they use three organizational mechanisms in an effort to lower costs while improving outcomes.
- Selective Provider Networks. Providers are part of a selective network created by the insurer, and patients are either encouraged or required to see only those providers who are part of that network. This selectivity allows the plans to recruit the most efficient and effective providers and to exclude those whose practices are high in cost and low in quality outcomes.
- Financial Incentives Aligned with Clinical Best Practices. In fee-for-service medicine, physicians are paid directly for the volume of services they provide—whether or not those services actually contribute to better outcomes. In Medicare Advantage plans, by contrast, covered services and the rates at which they are compensated are negotiated in advance and aimed at efficient, effective care delivery. Some providers are eligible for bonuses if they achieve certain quality and preventive-medicine targets that enable the payers to receive reimbursement premiums from Medicare. The most comprehensive versions of these models often include a risk-sharing contract known as global capitation, in which providers are paid a set risk-adjusted annual fee per patient and are financially liable for any excessive spending but also able to benefit when they provide care at a lower cost.
- Active Care Management. Finally, and perhaps most important, there is a strong focus on active care management that invests resources in prevention in order to keep patients healthy, stable, and out of the hospital, thus avoiding as much as possible the higher costs of hospitalization required by acute episodes of care. Care management practices often include extensive services such as detailed analytics that preemptively identify at-risk patients (for instance, the chronically ill or recently discharged); remote vital-sign monitoring and regular communication with patients; disease management websites; and home visits from a multidisciplinary team of providers including registered nurses, physical therapists, and social workers. Such services are particularly important for chronically ill patients, who are a fast-growing segment of the population and increasingly expensive to treat if their health starts to decline.
To assess the impact on health quality of delivery models that use these mechanisms, BCG compared claims data and demographic information from 2011 for some 3 million Medicare patients. Approximately 1.3 million of the patients in our sample used providers on a traditional fee-for-service basis. The remaining 1.7 million patients were enrolled in private Medicare Advantage plans.
About 1.1 million of the private-insurance patients were enrolled in a PPO. Of the insurance plans we studied, PPOs are the closest to traditional fee-for-service medicine. Although patients have an economic incentive to choose providers affiliated with the plan, they can go outside the plan’s network if they choose to by paying a higher copayment or coinsurance. Providers are still paid for each service they provide, but negotiated contracts define what services will be reimbursed and at what levels, and there are modest incentives in place to encourage preventive services. Finally, the highest-risk members are placed in telephone- or home-based care-management programs to better manage their illnesses.
Another 355,000 patients were enrolled in a noncapitated HMO. HMOs are typically more restrictive than PPOs. The patient’s cost to join is less, but patients usually see specialists only when they have received a referral from their primary care physician, and they go only to doctors and hospitals in the HMO network. The financial penalty for going outside the network is more severe. And while providers are often still paid for each service they provide, more substantial incentives are available for those who deliver cost-effective quality care. In addition, providers’ comparative performance is tracked.
Finally, some 290,000 patients were enrolled in an HMO plan that also included global capitation. In other words, participating primary-care physicians were paid a contracted rate (adjusted for age, gender, illness, and regional differences) for each member regardless of the number or nature of services provided. In the capitated model, it is the provider, not the payer, who takes on the risk of the cost of care. Should that cost exceed the contracted rate, the provider could actually lose money on a given patient. By the same token, to the degree that providers can successfully manage that risk and achieve their quality targets at less cost, they also benefit from what can be a substantial financial upside. This provides a strong incentive to invest in active disease management and to work closely with patients to help them navigate the health care system. Indeed, detailed financial models suggest that primary care providers who know how to manage global capitation have the potential to earn more income than their fee-for-service counterparts for the equivalent population of patients—a phenomenon that we have witnessed in our client
Because the demographic composition of our four samples was not identical, we used regressions to risk-adjust our data for two key factors that shape an individual’s health status: age and the number of comorbidities. In other words, we compared the age composition and presence of comorbidities in each sample with the total sample average, and then adjusted each sample’s mortality and other results accordingly.
To further check the validity of our findings, we took another step. We created a sample of approximately 170,000 patients in each of the four health-care plans who matched one another in terms of age, gender, minority status, number of comorbidities, and disease type. This matching exercise confirmed the findings of our larger sample with minimal variations. In addition to presenting the findings from our full sample, we report on some of the findings from this matched sample in our discussion below.
We acknowledge a number of limitations in our data set—in particular, the fact that although we have tried to limit the impact of selection bias on our findings, we have not eliminated it entirely. The magnitude of selection bias in Medicare Advantage is a
The Impact of Alternative Models on Health Care Quality
To measure health care quality across our four delivery models, we focused on three categories of health outcomes defined by Michael E. Porter and utilized by the International Consortium for Health Outcomes Measurement
- Health Status. The first category is the overall health status of the patient. Here the chief metric was single-year mortality—whether a patient lived or died during the year under study.
- Recovery from Acute Incidents of Care. The second category addresses outcomes associated with acute episodes of care requiring hospitalization. Because we had access only to administrative claims data and not actual clinical-chart data, we had to rely on process metrics as a proxy for genuine health outcomes: hospital admission rates, the average length of stay, and the percentage of admissions that were readmissions within 30 days of a previous discharge. At first glance, a measure such as how long a patient stays in the hospital may not appear to be an indication of health care quality. (After all, shorter stays may be the result of rules that prematurely force patients out of the hospital.) However, when length of stay is combined with 30-day readmission rates, the two metrics provide a sense of how well a care delivery model is managing acute episodes of care.
- The Sustainability of Health over Time. The third dimension addresses outcomes associated with the long-term management of care, especially in chronic diseases. Here we relied on a mix of genuine outcome metrics such as the degree to which the plans minimize disease-specific complications (for example, foot amputations among diabetics) and proxy metrics such as the use of specific clinical practices that represent the highest standard of care.
In addition to tracking these metrics for our sample as a whole, we did so for four major chronic diseases—coronary artery disease, chronic obstructive pulmonary disease, chronic kidney disease, and diabetes.
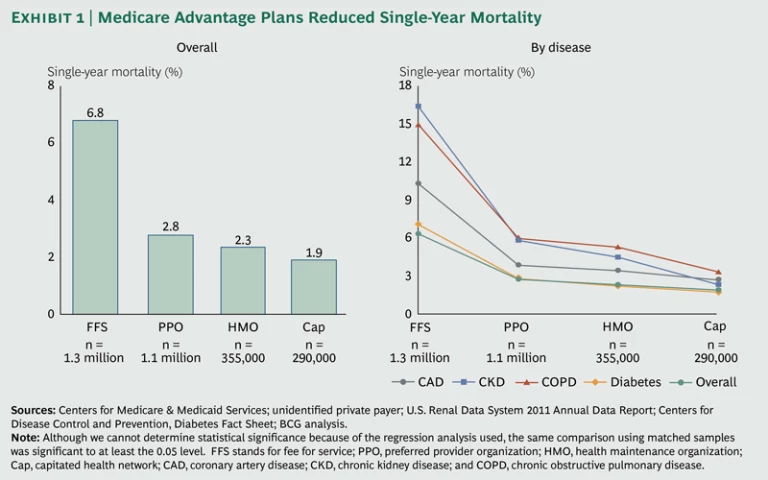
Single-Year Mortality. Perhaps the most dramatic finding of our research is that as we move across the spectrum from the traditional fee-for-service sample to the progressively more managed delivery models, the single-year mortality rate decreases from 6.8 percent to 1.9 percent. (See Exhibit 1.) Most of that difference occurs between the fee-for-service and PPO samples, with smaller but consistent declines in the HMO and capitated samples. These differences in the single-year mortality rate are consistent across the four diseases we studied, with the improvements for chronic kidney disease especially dramatic.
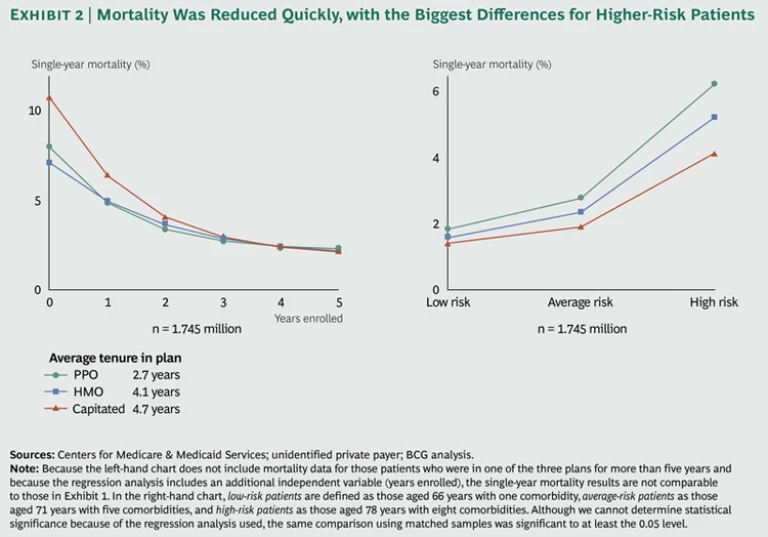
There are also indications that patients in the three more-managed models achieve these lower levels of single-year mortality quickly—within the first year of enrollment. We compared mortality rates across the three alternative-delivery models on the basis of how many years an individual patient had been a member of one of the three types of plans. The single-year mortality rate fell sharply for patients who had completed their first year in a managed plan and then declined steadily in subsequent years. (See Exhibit 2.) The overall slope of improvement is greatest in the capitated model, which shows the lowest mortality rates for patients who had been in the plan for four years or more. These findings are particularly meaningful given that the members of the various plans had an average length of enrollment of between about two and a half and four and a half years depending on the model—which suggests that the plans are actually able to see the financial benefits of investments in more managed care delivery during a member’s enrollment period.
Finally, the differences in single-year mortality in the Medicare Advantage samples were also greater for older and higher-risk patients as we move across the spectrum toward more managed delivery models. We compared the mortality results for three subgroups within our sample: “low risk” patients (defined as those aged 66 years with one comorbidity), “average risk” patients (those aged 71 years with five comorbidities), and “high risk” patients (those aged 78 years with eight comorbidities). For the low-risk group, the difference in single-year mortality between the PPO and the capitated samples was only 0.4 percentage points (1.8 percent versus 1.4 percent). For the high-risk group, by contrast, the difference was 2.1 percentage points (6.2 percent versus 4.1 percent). Similar results can be seen across the four diseases we studied.
Hospital Utilization Rates. Previous research has shown that more managed care-delivery models correlate with lower hospital-utilization rates. Our data confirm this general
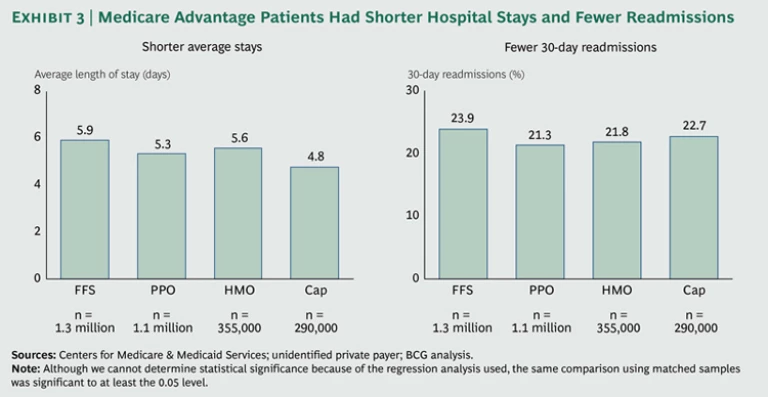
There is a relatively negligible difference of about 4 percent in the share of patients admitted to hospitals across the four models. But there is a substantial reduction in the length of time that patients in the capitated Medicare Advantage plan spend in the hospital—about a 19 percent lower average length of stay compared with the fee-for-service sample. (See Exhibit 3.) This finding is at the low end of the research showing that Medicare Advantage plans have utilization rates 20 to 30 percent lower than Medicare fee-for-service. What’s more, the more managed plans also have a somewhat lower percentage of readmissions, which suggests that the shorter hospital stays represent genuine improvements in the management of acute episodes of care.
That said, there does appear to be some tradeoff between length of stay and readmissions. For example, the small average length of stay of the capitated sample (4.8 days) seems to come at the price of a higher level of readmissions. But even this elevated readmission rate, compared with the other alternative plans, is lower than the level for the fee-for-service sample.
Sustaining Health over Time. One of the advantages claimed by proponents of more managed delivery models is that they make it easier for providers to engage in active care management and to practice preventive medicine—thus avoiding acute episodes and invasive procedures that are both more costly and more disruptive to the patient. The data produced by our sample-matching technique described on page 6 suggest that this advantage does, in fact, exist.
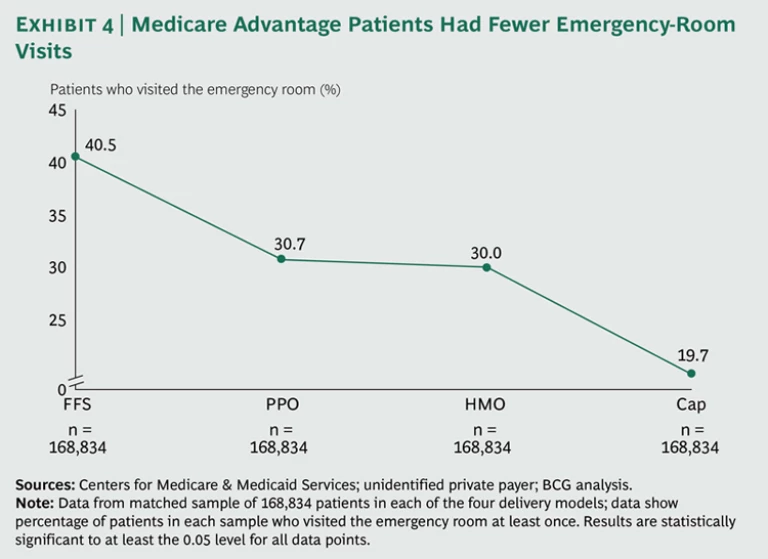
Take the example of emergency room visits. About 4 in 10 of the patients in our fee-for-service matched sample visited the emergency room at least once in 2011. But for our three progressively more managed delivery models, the figure drops—to about 3 in 10 for the PPO and HMO samples and to below 2 in 10 for the capitated sample. (See Exhibit 4.) This decline in emergency room visits could reflect better management between acute episodes, better follow-up and scheduling of specialist visits, or better adherence on the part of patients to their treatment regimens.
When we looked more closely at the disease-specific data, we found that patients in the more managed plans were indeed more likely to receive recommended preventive care. The Healthcare Effectiveness Data and Information Set (HEDIS) established by the nonprofit National Committee for Quality Assurance, tracks 75 measures across eight domains of care that are broadly accepted as reflective of high-quality health
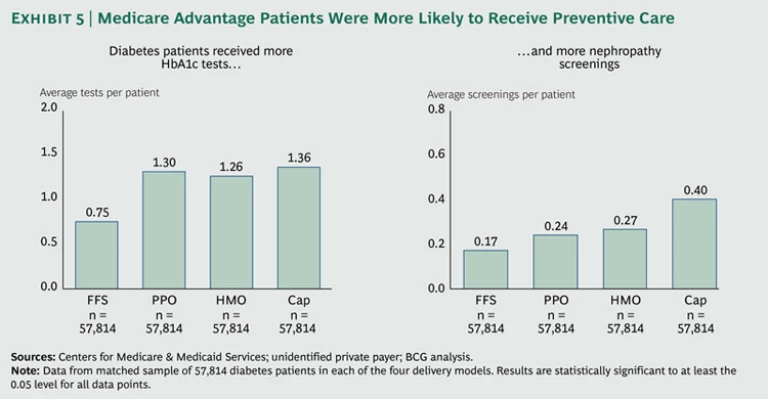
Two key HEDIS standards for patients suffering from diabetes are frequent (at a minimum, once a year) testing for glycated hemoglobin (HbA1c), high levels of which have been correlated with cardiovascular disease and other conditions, and regular nephropathy screenings to monitor kidney function. Our matched-sample data show that the average number of HbA1c tests per patient increases from 0.75 in the fee-for-service matched sample to 1.36 in the capitated matched sample. And the average number of nephropathy screenings per patient more than doubles, from 0.17 to 0.40. (See Exhibit 5.)
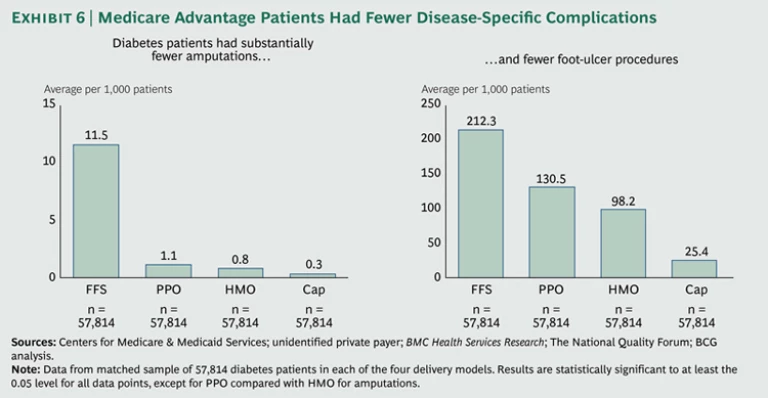
As one might expect, there were also many fewer disease-specific complications in the diabetes patients in the more managed plans. Whereas the fee-for-service matched diabetic sample had an average of 11.5 amputations per 1,000 patients, the capitated matched diabetic sample had only 0.3. And whereas the fee-for-service sample had an average of 212.3 foot-ulcer procedures per 1,000 patients, the capitated sample had only 25.4. (See Exhibit 6.)
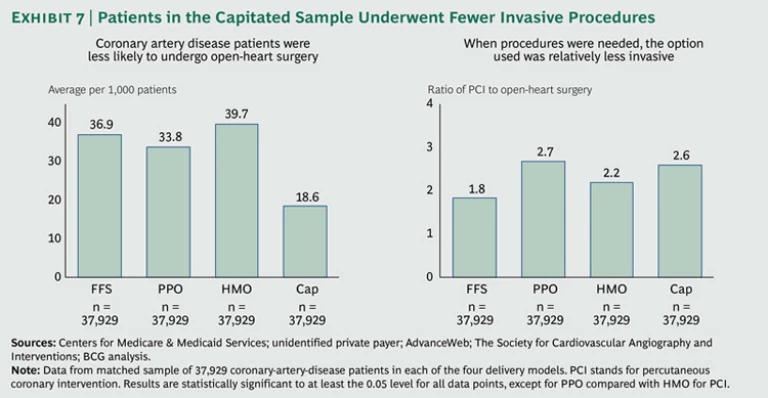
In coronary artery disease, we found that patients in the capitated matched sample underwent half as many open-heart surgeries (which are not only expensive but also highly disruptive for the patient) as patients in the fee-for-service matched sample. (See Exhibit 7.) And when invasive interventions were necessary, the tendency was to choose the less invasive option of percutaneous coronary intervention (PCI)—such as coronary stents, angioplasty, and atherectomy—as shown by the relatively high ratio of PCI to open-heart surgery in the more managed plans. Given that the single-year mortality of the patients with coronary artery disease in our sample was lower for those in the more managed plans, as shown in Exhibit 1, this pattern of clinical practice would seem to suggest that the more managed plans were simultaneously reducing costs and improving health care quality.
The accumulation of results suggests that one reason for the improved outcomes of the private insurance plans is their ability to more effectively and systematically manage both chronic and acute illness. Although our findings are suggestive rather than definitive, their strong directionality indicates that the more managed care-delivery models improve health care value compared with the traditional fee-for-service model. What’s more, this conclusion is confirmed by a growing body of research suggesting that the introduction of organizational mechanisms like those characterizing the Medicare Advantage plans we studied has the effect of simultaneously lowering costs and improving
Implications for Health Care Decision Makers
Our research suggests that successful U.S. Medicare Advantage plans offer a powerful model for improving health care quality. These plans have found a way to engage the right set of clinicians around the objective of delivering improved health-care value. They have also effectively realigned financial incentives to help realize improved outcomes.
This conclusion has important implications for the debate about the future of health care. First, the claim—still heard frequently in debates about health care costs—that more managed care-delivery models achieve cost savings only by eroding the quality of care appears untrue. The more managed plans that we studied delivered better care than traditional fee-for-service medicine.
Second, our findings also put into question the commonly held notion that allowing patients to have an unrestrained choice of providers will lead to quality outcomes. Even as the fee-for-service model is coming under growing criticism in the U.S., many publicly financed health-care systems (for example, in certain regions of Sweden) are encouraging private providers to offer care covered by fee-for-service reimbursement as a means to expand consumer choice and bring market forces into play. But unless such delivery models utilize the organizational mechanisms we describe, they are unlikely to contribute to improved value. In fact, they may end up
Third, the critical issue is whether a given delivery or reimbursement model has put in place the right organizational mechanisms and incentives to effectively change provider behavior, to increase innovation and experimentation, and to encourage those clinical practices that deliver cost-effective quality care.
Given their track record, we believe that U.S. private insurers have a major role to play in the ongoing national efforts to improve health care value. They have accumulated considerable experience toward achieving this goal, and all stakeholders should learn about and take advantage of their efforts. Typically, private health insurers in the U.S. are seen as “middlemen” who help manage the system’s risk but with little direct impact on the actual quality of care. Our research suggests otherwise: that private insurers have created an operating model that can deliver better care at a lower cost. In this respect, they represent important catalysts of innovation in clinical practice. Their role as a third party, along with their correspondingly greater scale, broad access to data, and lack of fixed infrastructure (and the corresponding fixed costs that such an infrastructure represents), put them in a position to bring about changes in clinical practice in partnership with the clinical community.
But we also believe that the alternative delivery and reimbursement models represented by these Medicare Advantage plans have the potential for broad applicability, whatever the mix of private and public health insurance in a nation’s health care system. Health care systems around the world can adopt components of what has made these alternative care-delivery models successful. In order to do so, however, payers, providers, and policymakers must know precisely what it takes to implement these organizational mechanisms effectively and how to replicate them across different types of health care systems. We will explore these issues further in subsequent research.
Appendix: Research Methodology and Limitations
To arrive at our four samples, we started with claims data and demographic information from 2011 for some 4.3 million Medicare beneficiaries. About 2.6 million of these patients were a representative sample of the traditional fee-for-service model. These data were purchased from the federal government’s Centers for Medicare & Medicaid Services (CMS). The remaining 1.7 million patients in our initial set were enrolled in one of three types of private Medicare Advantage plans. These data were provided by a leading private insurer and have been audited by the U.S. government.
Next we filtered the fee-for-service patient data to make them comparable to the data for the Medicare Advantage patients. Some 860,000 fee-for-service patients were excluded owing to missing demographic or claims information. We excluded another 400,000 patients to ensure that we looked at fee-for-service patients only in states where the private insurer had a meaningful presence. This left us with a fee-for-service data set of about 1.3 million patients out of about 3 million overall.
Although our data set is extremely broad and comprehensive, there are a number of limitations in the data that influence the conclusions that can be drawn.
Our data represent a snapshot in time: health outcomes for the single year of 2011. We do not have longitudinal data that would let us know whether our findings are consistent over time. What’s more, because our study focuses exclusively on Medicare patients, our findings are limited to a sample of older and relatively sicker patients and may not apply to a younger or less sick population. This older population generates the lion’s share of health care costs and will generate even more as the baby boomers reach Medicare eligibility. Although people eligible for Medicare represent only 12 percent of the U.S. population, they are responsible for 34 percent of overall U.S. health-care spending.
The data in our three Medicare Advantage samples come from a single private insurer. Therefore, the better outcomes in these samples may reflect the strong performance of this particular insurer, rather than that of more managed delivery systems in general. Nevertheless, the results of even a single payer demonstrate the potential of a more managed care-delivery model.
Our database did not contain any cost data. So while we can compare the nature of health outcomes across our four models, we cannot determine what those specific outcomes cost. However, there is a growing literature demonstrating that health care costs drop with the use of the organizational mechanisms deployed by the plan types we studied, and it is reasonable to assume that that relationship also applies here.
We had access to demographic and claims data only at the individual state level. Therefore, we could not account for any sample differences at the county level or for varying rates of readmission across individual hospitals. And because the CMS data cap the number of diagnoses at 12, we were able to collect only a limited number of diagnoses for each patient. The lack of CPT II codes in our data also meant that we were unable to capture any detail about the specific severity of comorbidities.
Our regression analysis may also be distorted by differences between Medicare fee-for-service and Medicare Advantage plans in the documentation of patient comorbidities. Medicare Advantage payers have a strong financial incentive to capture the complete range of comorbidities for a given patient; as a result, they put in place analytics and programs to assist providers in documenting these comorbidities more accurately, and their patients tend to have a higher number of comorbidities on
Another limitation of our regression analysis is that it makes it impossible to meaningfully calculate statistical significance. However, when we replicated our analyses in our matched sample, we found that all the results (with two minor exceptions) were statistically significant to at least the 0.05 level and often to the 0.001
Perhaps most important, our data do not account for all possible selection bias among the four models studied. Despite having controlled for age and number of comorbidities, we cannot determine other indicators of health status. Our data sample does not include socioeconomic or educational status or, for instance, whether patients are smokers—all factors that influence health status. However, while the nationwide Medicare fee-for-service population is slightly older than the Medicare Advantage population, the latter has a larger proportion of minorities and lower-income and less well educated
One final limitation concerns the 1.1 million patients in our PPO sample. Roughly a quarter of these patients were in fact in a private fee-for-service plan, but we were unable to identify these patients from the data available. If our hypothesis about the benefits of more managed care delivery is correct, the inclusion of these patients would negatively impact the outcomes and performance of this PPO group. Had we been able to exclude these patients, the outcomes for the PPO sample might therefore have been even better than what we have reported.
Acknowledgments
The research described in this report was sponsored by BCG’s Health Care practice. The authors would like to thank their BCG colleagues Melody Chan, Jennifer Clawson, Daniel Gorlin, Peter Lawyer, Regan Murphy, Karthik Prasad, Martin B. Silverstein, and Frances Taplett for their contributions to the research; Robert Howard for assisting with the conceptualization and writing; and Katherine Andrews, Gary Callahan, Kim Friedman, Sharon Slodki, and Sara Strassenreiter for contributing to the editing, design, and production of this report.
