This is the second in a series of articles published in advance of The Boston Consulting Group’s 2013 Value Creators report. In February 2013, we reported on the strong performance of global equity markets in 2012 and found some intriguing signs of a sustainable global economic recovery. In the fall of 2013, we published the full report , including detailed rankings of the top performers worldwide and in 20 industries for the five-year period from 2008 through 2012.
The strong performance of global equity markets in 2012 has so far continued into 2013. In the first quarter of this year, the MSCI All Country World Investable Market Index grew by about 17 percent. And some market indices, such as the S&P 500, have finally returned to the levels they enjoyed before the 2008 financial crisis.
What has been the impact of the latest market expansion on investor attitudes and priorities? During the first quarter of 2013, BCG invited approximately 650 portfolio managers and buy-side and sell-side analysts to participate in an online survey. The survey is the fifth in an annual series that BCG has conducted since 2009, probing investors’ views on the global economic environment and priorities for business value creation. We received 125 responses to our 2013 survey (a response rate of about 19 percent) from individuals at companies that, collectively, are responsible for approximately $1 trillion in assets under management and cover a wide range of industries and locations.
This year, instead of focusing mainly on our latest findings, we want to cast a wider net and explore the patterns that emerge over all five years of the survey. Four key findings stand out:
- Wide Swings in Investor Sentiment. The strong market performance of the past year has led the investors we surveyed to become more bullish. But what is even more striking over time are the wide swings in investor sentiment from optimism to pessimism and back again.
- Long-Term Perspective. These shifts in investor sentiment may seem to suggest that the investors we surveyed have a short-term focus—their confidence levels closely tracking the latest shifts in what has been a highly volatile market environment. In fact, we think the opposite is the case. The volatility of the market appears to have caused these investors to increasingly adopt a long-term perspective on company performance. They want companies to keep their eyes on the prize of long-term value creation, despite—or, rather, because of—the recent short-term market swings.
- Value Creation over Growth. Although the majority of investors in our study continue to see organic investment as the top priority for the use of cash, they do not want companies to seek growth at any price. Put simply, they are seeking value creation over growth. They are looking to invest in companies with credible management and strong track records. They appear to have accepted that, on average, growth in many sectors and regions of the world will be modest in the years to come, and they do not see it as a big differentiator among companies. And, as we have reported in the past, the size of a company’s dividend yield is becoming an increasingly important criterion for investment.
- New Challenges for Core Management Processes. Given the impact of the ongoing volatility in equity markets on investor expectations, it is critical for senior executives to develop and communicate a clear and compelling investment thesis—one in which an organization’s business, financial, and investor strategies are carefully aligned and mutually reinforcing. Although our annual surveys show that investors are seeing consistent improvement in this alignment, there is still much more that needs to be done. In addition, because management credibility and track record is a key investment criterion, investors are looking for new levels of professionalism in core management processes—especially in the areas of strategic planning and risk management.
Swings in Investor Sentiment
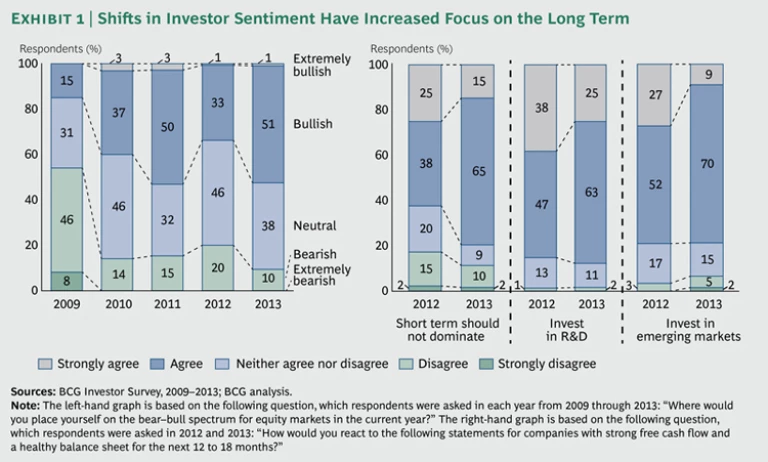
Every year, we ask our survey respondents where they place themselves on the bear–bull spectrum for the current year. More than half the respondents to our 2013 survey (52 percent) described themselves as either bullish or extremely bullish, up from only 34 percent in 2012. (See Exhibit 1.)
That’s a big gain, but when seen in the context of all five years of the survey, what is even more striking are the shifts in investor sentiment over time. After all, roughly the same percentage of respondents (53 percent) described themselves as bullish or extremely bullish in 2011, which was also a big gain compared with their responses in 2010. And yet, that 2011 gain did not sustain itself in 2012, when the percentage of bullish or extremely bullish respondents was even smaller than in 2010.
What explains these changes in investor sentiment? We think that the responses to this question are a lagging indicator mirroring the volatility of the market itself. Respondents are not so much describing their views of the year ahead as reacting to the performance of the equity markets in the previous year. So the post-financial-crisis market rebound in 2010 (in which the MSCI All Country index was up 30 percent) led to the high degree of bullishness reported in our 2011 survey; the poor market performance in 2011 (in which the MSCI All Country index was down by approximately 6 percent) contributed to the low levels of bullishness among the respondents to our 2012 survey; and last year’s performance, the strongest since 2009, led to the high levels of bullishness this year.
Long-Term Perspective
At first glance, these rapid and reactive shifts in investor sentiment might seem to suggest that the investors we are surveying have an extremely short-term focus. In fact, we think the opposite is the case. Every year, we ask our respondents to react to a series of priorities for the strategic agenda of a hypothetical company “with strong free cash flow and a healthy balance sheet.” Their preferred priorities consistently reflect a strong focus on the long term.
The graph on the right side of Exhibit 1, for example, compares the top three priorities chosen in 2013 with the results for those same priorities in 2012. A full 80 percent of respondents to the 2013 survey agreed that healthy companies should not let short-term performance dominate their strategic and value-creation agenda, up from 63 percent in 2012. Confirming this long-term perspective, 88 percent and 79 percent, respectively, of our 2013 respondents agreed that such companies should be making long-term investments in R&D and in emerging markets.
These results are in line with the findings of our earlier surveys. For example, even in 2009—in the immediate aftermath to the global financial crisis—nearly three-quarters (72 percent) of respondents said they favored companies making long-term investments that strengthen their competitive position, even if it required lowering EPS guidance over the next few quarters.
This commitment to the long term is not as paradoxical as it sounds. We believe that the volatility of global equity markets over the past five years, which has caused investor sentiment to swing between pessimism and optimism, has also led investors to focus increasingly on long-term performance as a more meaningful indicator of a company’s value-creation potential. This focus on the long term confirms what BCG has been hearing in the many interviews with investors that we do for our clients.
Value Creation over Growth
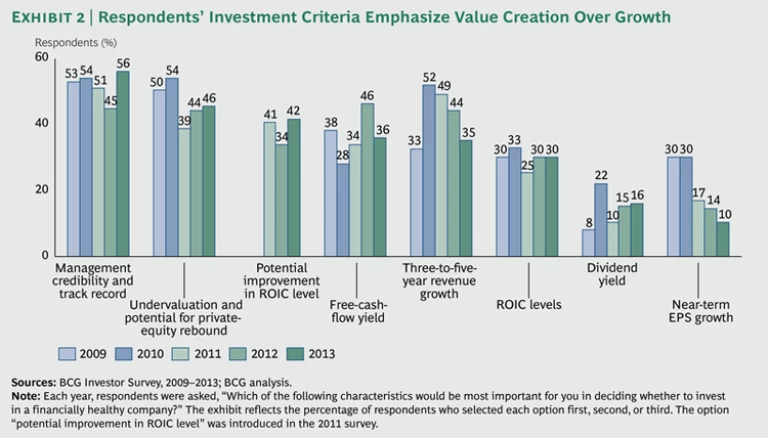
In parallel to this long-term perspective, the investors we surveyed have embraced a set of investment criteria consistent with that of a value-oriented investor—or, perhaps more accurately, a “growth at a reasonable price” (GARP) investor. Every year, we ask survey participants: “Which characteristics would be most important for you in deciding whether to invest in a financially healthy company?” Exhibit 2 compares the responses to this question over the five years of the survey.
One striking pattern in these results is the declining portion of respondents who see growth as a top investment priority. For example, near-term EPS growth, chosen by 30 percent of respondents in the early years of the survey, has declined quite rapidly since, and was chosen by a mere 10 percent in 2013. We believe this is a clear signal of the growing commitment of investors to long-term company performance.
More difficult to interpret is the decline in the portion of respondents who see three-to-five-year revenue growth as a top priority. After reaching a high of 52 percent in 2010, the percentage of respondents choosing this option declined to 35 percent in 2013. This may reflect an acceptance of the fact that, in the post-Great Recession economy, GDP growth will continue to be below the long-term average and it will be difficult for many companies to deliver strong organic growth—and, therefore, such growth is unlikely to be a strong differentiator among companies.
This view is reinforced by investors’ conservatism about the likely market-average TSR in 2013. This year, the majority of respondents (53 percent) estimated that average market TSR would be in the neighborhood of 6 to 8 percent. That is a much larger percentage than last year, when only 40 percent thought that market-average TSR would be in this range. But the important thing to emphasize is that this level of TSR reflects expectations that are considerably below the long-term historical average of approximately 10 percent. Indeed, only 2 percent of the respondents to our survey believed that market-average TSR would reach this threshold. What’s more, these investors expect earnings growth to be quite modest, with fully half believing that growth in earnings will be only between 2 and 4 percent.
In the absence of strong growth opportunities, the challenge for companies is how to deliver value with modest or minimal growth. A number of investors’ responses to our survey support this point of view. Note that, first and foremost, these investors are looking to invest in companies with strong management teams and a track record of superior performance. As Exhibit 2 shows, management credibility and track record has been the top investment criterion in each of the five years of our survey and was chosen by 56 percent of respondents in 2013, the highest percentage ever. We think this result is, at least in part, a response to the uncertainty and complexity of the current business environment. Another high priority is a company’s potential for improving its return on invested capital, selected by 42 percent in 2013.
A third sign of this value orientation is the consistent growth in the number of respondents who chose dividend yield as a top investment criterion. The absolute numbers are low, but (leaving aside the 2010 survey’s anomalous result) the percentage of respondents who see a company’s dividend yield as a top priority has doubled—from 8 percent in 2009 to 16 percent in 2013. Forty-nine percent of this year’s respondents think that dividends will account for between 2.5 and 3 percentage points of TSR. And an additional 27 percent believe the TSR coming from dividends will be even higher. This trend confirms our conviction that in a low-growth environment, dividend yield is becoming an increasingly important component of a company’s TSR.
Finally, it is interesting to observe that a significant portion of investors continue to see potential for undervalued companies to create value through a rebound in their valuation multiple—despite the current market highs and despite the fact that a strong majority (67 percent) of respondents believe that the S&P 500 is fairly valued. Is this another example of investors’ increasing value orientation when it comes to considering the prospects for individual companies? Or, much like the responses to our bear–bull question, is it something of a lagging indicator, a reaction to past, as opposed to future, market performance?
A Delicate Balance
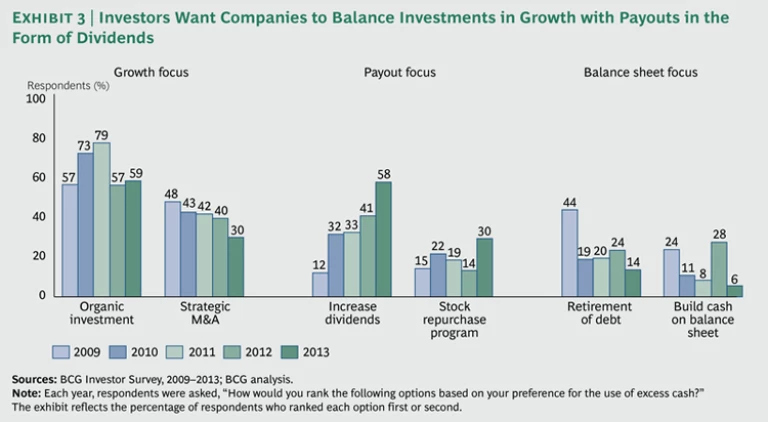
Of course, emphasizing value creation over growth does not mean that investors are completely uninterested in growth. Every year, we ask respondents to rank their preferences for a company’s use of excess cash. As Exhibit 3 shows, investment in organic growth has been the consistent number-one priority over the five years that we have conducted the survey and was chosen by 59 percent of respondents in 2013. At the same time, there has been a consistent decline in strategic M&A as a preferred use of cash, which may reflect concerns about the riskiness of M&A typical among more value- and GARP-oriented investors.
Perhaps the most striking finding is the extraordinary growth in the importance of using excess cash to increase dividends. The percentage of respondents who selected dividend increases as a top priority has grown nearly fivefold, from 12 percent in 2009 to 58 percent in 2013, only 1 percentage point less than the portion that chose organic investment as one of their two top priorities.
Taken together, these two priorities—organic investment and dividend increases—provide strong confirmation of a theme that we have emphasized in previous years: investors want management teams to be disciplined stewards of capital, striking a delicate balance between investing in profitable organic growth and returning excess free cash flow to shareholders.
Challenges for Core Management Processes
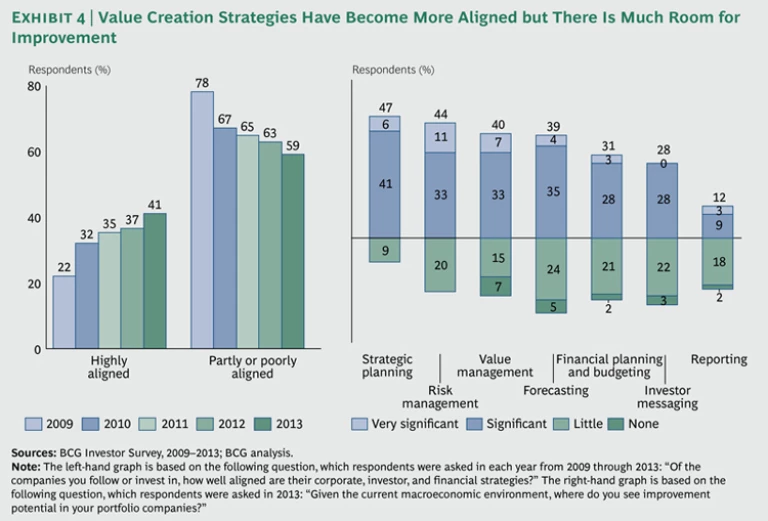
A positive effect of the financial crisis appears to be that hard times have forced companies to better align their business, financial, and investor strategies. The respondents to our surveys have seen steady improvement in the degree to which the companies they follow or invest in are “highly aligned” along these three dimensions—nearly doubling from only 22 percent in 2009 to 41 percent in 2013. (See Exhibit 4.) That said, there is still a long way to go. A full 59 percent of this year’s respondents said that the companies they follow or invest in are only partly or even poorly aligned.
What’s more, in an environment characterized by high volatility, low growth, and an increasing investor focus on the long term, investors are looking for major improvements in core management processes. Nearly half (47 percent) said that there were either significant or very significant opportunities for improvement in strategic planning at their portfolio companies, and 44 percent said the same for risk management.
As companies look toward the future, we believe four steps are especially important in defining a company’s value-creation strategy in today’s investment environment:
- Define a long-term growth strategy. Precisely because achieving profitable growth will be more difficult, companies need to work harder at identifying the most promising growth opportunities. In addition to pinpointing the most likely sources of organic and acquisitive growth, an effective long-term growth strategy at many companies will require substantial retooling of the business portfolio. For instance, 80 percent of the respondents in this year’s survey believe that companies need to be more aggressive about divesting those businesses in the portfolio with little or no growth potential.
- Know what drives the multiple. Multiple expansion could be an important source of TSR in the coming years. Therefore, every company should understand what has driven differences in valuation multiples in its peer group. In our experience, roughly 80 percent of the factors that drive differences in multiples among similar companies can be identified and managed.
- Develop a disciplined approach to cash payout. A company’s dividend and share-buyback policies are too important to be merely an afterthought. Especially in today’s lower-growth and yield-scarce environment, they make a significant contribution to overall TSR. Companies need to develop a comprehensive financial strategy that defines their preferred capital structure, dividend policy, and approach to share buybacks. And that financial strategy should be aligned with business and investor strategies.
- Upgrade core management processes. On the one hand, companies need to do more to align their business, financial, and investor strategies. On the other, they need to revisit core management processes such as target setting, planning, budgeting, resource allocation, and risk management to make sure that they reflect the company’s value-creation agenda.
BCG expanded its consideration of these and related topics in our annual Value Creators report , which was published in the fall of 2013.


