This is the first in a series of online articles published as part of The Boston Consulting Group’s 2013 Value Creators Report. The full report will be published in September.
2013 Value Creators
- Investors Look to the Long Term
- Signs of Sustainable Value Creation
In 2012, global equity markets appeared to take a giant step forward. The MSCI All Country World Investable Market Index of total shareholder return (TSR) was 16.5 percent last year. This is the best performance since 2009, when equity markets rebounded from the extraordinary losses that occurred because of the 2008 global financial crisis.
Of course, single-year TSR performance can be hard to interpret and is not necessarily a good predictor of long-term performance. The 2009 increase, for example, was more a sign of a rebound than a genuine economic recovery. This time, however, there are some intriguing clues suggesting that the global economy may be at the beginning of a more sustainable pathway to longer-term value creation.
The Boston Consulting Group recently analyzed the 2012 TSR of more than 5,000 companies across 40 countries and 37 industry sectors. There were three key findings:
- Once again, emerging-market countries had the best-performing equity markets in the world. But one of the most interesting findings of our analysis is the strong performance of markets in some European countries despite the ongoing Eurozone debt crisis.
- While average TSR for 2012 was 18 percent, the top ten in our sample of 112 large-cap companies generated TSR of 50 to 110 percent. Although some of these top companies benefited from broad—and perhaps temporary—market trends, many have found a way to thrive by leveraging global growth to fight the strong economic headwinds in their local markets.
- The strong performance of traditional economic powerhouses—such as automobiles and parts, household goods and home construction, construction and materials, and general industrials—is an encouraging sign that a broader, longer-lasting recovery is under way.
Emerging Markets and . . . Europe
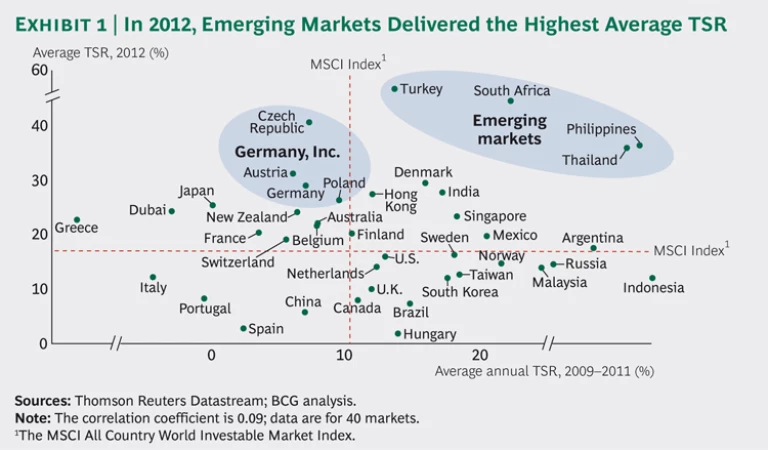
To get a sense of the trends that shaped value creation last year, we compared the performance of equity markets around the world. Exhibit 1 plots the average TSR performance of 40 local stock markets for 2012 (on the y-axis) and the average annual TSR for the three-year period from 2009 through 2011 (on the x-axis). The analysis confirms some general trends that we have identified in previous years but with a few interesting new twists.
As one might expect, second-generation emerging markets continued to deliver among the highest average TSR; the big winners in 2012 were Turkey, South Africa, the Philippines, and Thailand. This performance is in sharp contrast to that of three of the four BRIC countries (Brazil, Russia, India, and China). With the marked exception of India, equity markets in these countries delivered below-average TSR in 2012, with China’s market outpacing only Spain and Hungary.
As in previous years, European equity markets were strongly split between high performers in northern Europe and weak performers in the south. And while the Nordic countries were the highfliers in previous years, 2012 laurels go mainly to Central Europe—in particular, the Czech Republic, Austria, Germany, and Poland. Is this perhaps a sign that “Germany, Inc.” is exploiting a new wave of export-driven growth—despite the fact that domestic German growth has fallen to a near standstill?
What is perhaps even more striking is just how well the best-performing European markets did in 2012. The Czech Republic, Austria, Denmark, and Germany are among the top-ten equity markets in the world in average 2012 TSR—with 41 percent, 31 percent, 29 percent, and 29 percent, respectively. And 11 European countries, including Greece, Belgium, and France, generated TSR that was equal to or better than that of the U.S. S&P 500.
Countering Economic Headwinds
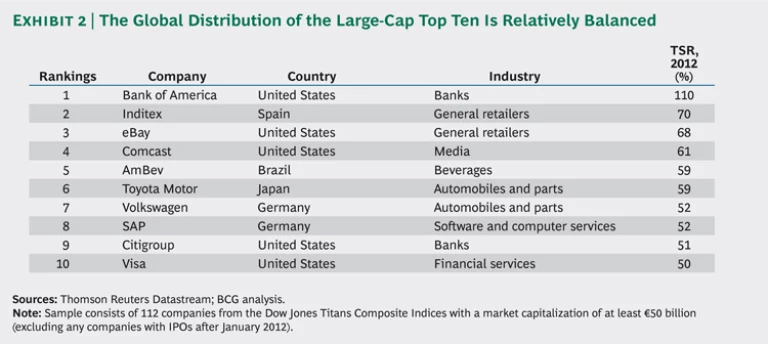
For signs that at least some global companies are finding ways to deliver sustainable TSR despite the volatility of global equity markets in recent years, consider the list of the top-ten large-cap value creators for 2012. (See Exhibit 2.) In contrast to 2011, when nine out of the top-ten companies were from the U.S., the regional representation of this year’s top ten is relatively balanced. The U.S. still takes the lead with five companies, but Europe is well represented with three. And Japan and Brazil have one each.
Broad market trends have given some companies on the top-ten list a boost. Take, for example, the two banks on the list—number one Bank of America and number nine Citigroup. These companies had negative TSR of 58 percent and 43 percent respectively in 2011 and are clearly rebounding from that especially poor performance. But their 2012 performance is hardly a sign that these companies or the sector as a whole are now on the road to sustainable and attractive value creation.
Many other companies on the list, however, have clearly found a way to thrive in the current economic environment—often by leveraging global growth to fight the strong economic headwinds in their local markets. Take the example of the number two company on our list, Spanish retailer Inditex, the world’s top fashion retailer and owner of the Zara fashion brand. Between February 1 and October 31, 2012, Inditex’s sales increased 17 percent to €11.36 billion, and profits rose 28 percent to €1.66 billion. This growth was fueled by rapid global expansion: the company opened 360 new stores in 54 countries and began a global rollout of new online stores in 21 countries, including the all-important Chinese market. By increasing its exposure to economic growth in faster-growing emerging markets, Inditex has been able to create sustainable value (an average annual TSR since 2008 of 23 percent)—despite the fact that it isn’t growing in its Spanish home market, where the Eurozone debt crisis has caused high unemployment and steep cutbacks in consumer spending.
Similarly, number five Ambev continues to deliver top-ten TSR, despite the poor showing of the Brazilian equity market. Toyota, at number six, is the only Japanese company to make the TSR top-ten list each year since we began publishing it in 2010—in large part due to a recent turnaround that has allowed it to regain its position as the top global auto company in terms of sales. And number seven Volkswagen has leveraged its strong presence in the Asian market to counteract sluggish growth in its European base. The presence of such companies on our top-ten list suggests that at least some global companies are finding sustainable pathways to create value through growth.
A Broader Recovery?
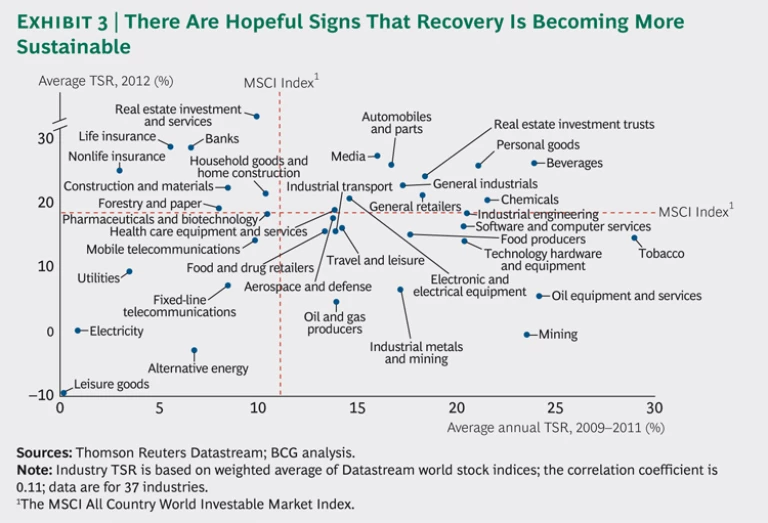
When it comes to the comparative performance of the 37 industrial sectors that we studied, there are also some hopeful signs that global economic recovery is becoming more sustainable. (See Exhibit 3.) Sectors that include low-cost consumer-products companies (such as producers of personal goods and beverages) continued to do well in 2012, and hard-hit financial sectors such as insurance and banks enjoyed a rebound. But the relatively strong performance of traditional economic engines such as automobiles and parts, household goods and home construction, construction and materials, and general industrials suggests that a broader recovery may be under way.
Many of the underperforming companies in 2012 hailed from sectors such as utilities, electricity, and fixed-line telecommunications, which experienced value creation challenges in recent years, or from commodity-based sectors, including mining, oil and gas producers, and industrial metals and mining, which were unable to sustain their outsize returns.
Charting One’s Own Course
Again, it is important to be careful about drawing unequivocal conclusions from single-year TSR performance, which by itself is a poor indicator of sustainable long-term value creation. There is no guarantee that the countries, companies, or sectors at the top of this year’s list will be there next year. Among the questions that we will be tracking throughout the coming year are the following:
- What does it take for a company to chart its own course to superior value creation, despite the specific circumstances of its industry or home market?
- Is the success of companies such as Inditex a sign that global companies are finding a sustainable model for growth in the current economic environment?
- What can we learn from those companies that have been the top value creators in the five-year period from 2008 through 2012—a period that started with the global downturn and ended with still-considerable economic uncertainty?
We will be exploring these and other questions in our 2013 Value Creators Report in September.


