A Changed World
Those were the days, my friend, We thought they’d never end.
— Gene Raskin
The further the early years of this millennium recede into the past, the more they seem like a vanished era of unlimited possibility for the engineering, construction, and services (ECS) industry. Today, six years after financial crisis rocked the global economy and forced a recalibration of business strategies, the ECS industry operates in a far different world in which constraints abound. These include tightening margins, intensifying competition, rising labor costs, and continued pressure from the capital markets to create value. The next five years, however, look brighter. The ECS industry can expect a return to growth, especially in mature markets that have encountered strong headwinds since 2008.
We should explain here what we mean by ECS industry. We believe that this designation best captures the full spread of industry activities, which cover every phase of nonresidential construction and a range of service business models, including design and engineering, process engineering and construction, infrastructure, and concessionaire. We have excluded original equipment manufacturers (OEMs), because their business models are focused on manufacturing industrial equipment (for example, turbines).
This is The Boston Consulting Group’s second annual report on the ECS industry as seen through the lens of shareholders. In this year’s report, we present a company sample expanded to 60 in order to better reflect the full scope of global companies participating in the ECS space. Furthermore, we have narrowed the period of evaluation from ten to five years. This report is a companion piece to the sixteenth annual report in BCG’s Value Creators series. (See Turnaround: Transforming Value Creation , BCG report, July 2014.) The series provides detailed empirical rankings of the world’s top value creators and distills managerial lessons from their success. It also highlights significant trends in the global economy and world capital markets and describes how those trends are likely to shape future priorities for value creation. Finally, the series provides details on BCG’s latest analytical tools and client experiences in order to help companies improve their management of value creation.
A Combative Environment
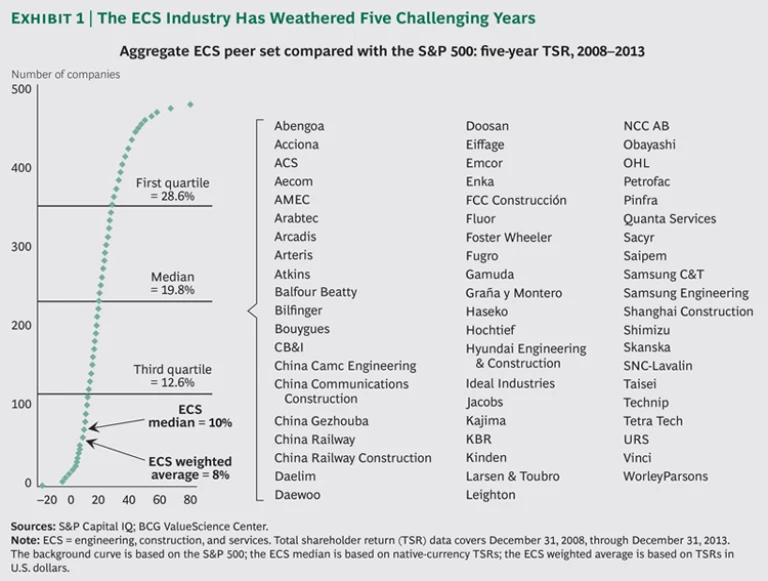
The pressures on ECS can be seen in the market performance of our 60 peer companies over the past five years from the end of 2008 through the end of 2013. (See Exhibit 1.) The sector’s weighted-average annual total shareholder return (TSR) during that period was only 8 percent, well below the TSR of roughly 18 percent posted by the S&P 500. In other words, the ECS companies in our sample were, in the aggregate, fourth-quartile performers.
The relative underperformance of large companies during this five-year period pulled down the performance of the peer set as a whole. Some large companies delivered no shareholder returns or even negative returns over this period. In fact, the lower the quartile, the higher the average starting market capitalization of the ECS companies in it. First-quartile performers started with an average market capitalization of $1.4 billion; second-quartile performers, $4.1 billion; third-quartile performers, $4.5 billion; and fourth-quartile performers, $7.3 billion. Clearly, some of the best ECS performers of the previous five-year period have faced some of the biggest challenges to sustained success.
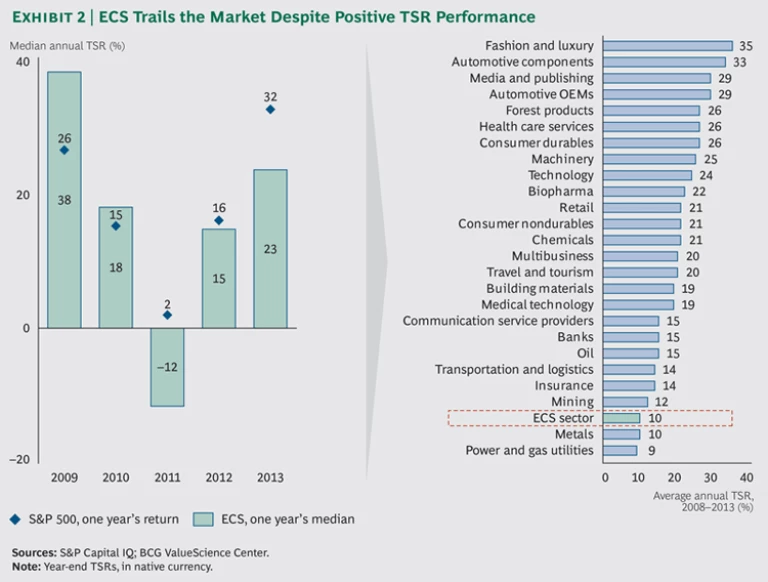
This dynamic meant that the median performance of the ECS companies in the sample was well above the weighted-average performance. However, at 10 percent, the median still fell below the S&P 500 median to the fourth quartile of the 26 sectors tracked in the annual reports of The Boston Consulting Group’s Value Creators series. (See Exhibit 2.) The gap between the S&P 500 and the ECS industry was especially pronounced in 2013, when our sample delivered a median annual TSR of 23 percent—well below the 2013 TSR of the S&P 500. Compare this record with 2009, when the ECS sector—still enjoying strong growth and buoyed by market expectations of continued increases in global infrastructure spending—delivered a TSR of 38 percent, far better than the S&P’s 26 percent.
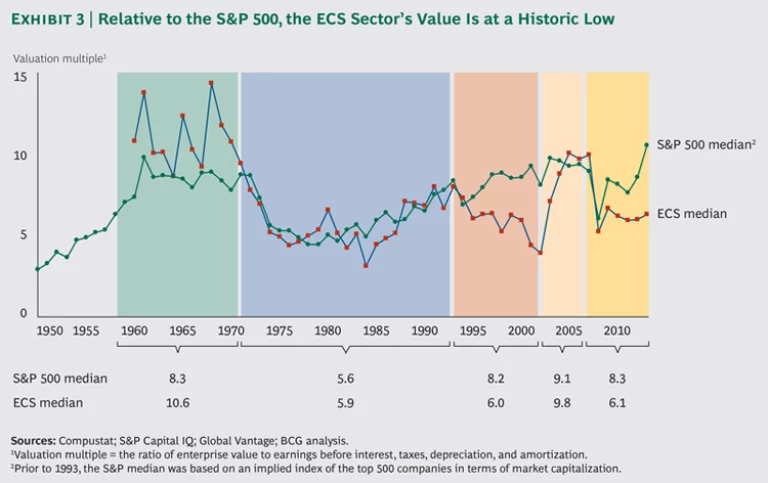
The sector’s decline can also be seen in relative valuation multiples, measured as the ratio of enterprise value to earnings before interest, taxes, depreciation, and amortization. (See Exhibit 3.) Although S&P multiples have risen steeply over the past five years, reflecting the market’s renewed confidence that companies can sustain profit increases in the wake of the financial crisis, ECS multiples have stayed relatively flat. By our calculations, only once in history, in 2001, has the gap between S&P and ECS multiples been so wide. At that time, ECS was ahead of the broader market, which was reacting to a sharp decline in capital spending in response to both a recession and a major security event.
Today’s valuation disparity is much more about continued investor uncertainty in the face of expectations of relatively anemic economic growth in some major regions of the world, sector rotation associated with a decline in some commodity prices, and unprecedented global competition.
The aggregate figures, however, mask wide variations in performance, especially in sales growth rates. Sales growth has declined substantially since the early years of this century, when double-digit organic and inorganic growth was common. Sales growth for most companies operating primarily in mature markets was close to zero or even negative. The developing-market-focused ECS com-panies in our sample, however, still grew at double-digit rates.
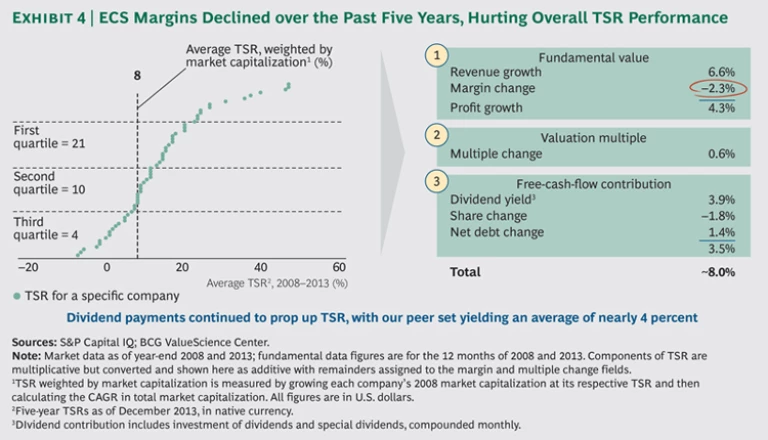
What hurt ECS companies most was the decline in margins that many—though not all—suffered over the past five years. (See Exhibit 4.) Average margins—eroded by rising labor costs that outstripped modest revenue growth—declined by about 2 percent annually, intensifying global competition for the addressable market and supply-demand imbalances that held price increases in check. As a result, compressed margins offset much of the benefit of sales growth in TSR terms. (To calculate the total contribution of profit growth to TSR, add the revenue growth rate to the margin change rate.) Fortunately, slight multiple increases and strong dividend yields of nearly 4 percent propped up TSRs somewhat. (See “How We Measure Value Creation: The Components of TSR.”)
HOW WE MEASURE VALUE CREATION: THE COMPONENTS OF TSR
These factors all interact—sometimes in unexpected ways. A company may increase its earnings per share through an acquisition but create no TSR if the new acquisition has the effect of eroding the company’s gross margins. And some forms of cash contribution (for example, dividends) have a more positive impact on a company’s valuation multiple than others (for example, share buybacks).
TSR is a useful measure of value creation, but it is inherently backward looking. As such, it is not a reliable predictor of future returns. To solve this problem, BCG has developed proprietary valuation techniques for forecasting TSR on the basis of a company’s strategic plan (and various alternatives it may be contemplating). This approach allows senior management to prioritize initiatives using shareholder value creation as the focal point rather than the host of competing metrics (for instance, growth, free cash flow, earnings per share, earnings before interest and taxes, and earnings before interest, taxes, depreciation, and amortization) that companies typically use as proxies for value creation and to guide the creation of their corporate strategic plan.
Characteristics of Top Performers
Not all companies underperformed, of course. A number, following several different business models, delivered quite enviable returns from the end of 2008 through 2013. (This report classifies ECS companies by their prevailing business model—design and engineering (D&E), process, infrastructure, and concessionaire. Each model is described in greater detail below.) The first quartile returned 33 percent annually to shareholders, nearly doubling shareholders’ investment every two years. This quartile included several acquisitive process engineering and construction (E&C) companies. One, CB&I, completed the $3 billion acquisition of The Shaw Group in 2013—the industry’s largest deal of the year—and executed a successful postmerger integration to achieve outstanding cost synergies. (See “CB&I: Advancing Strategy Through M&A.”)
CB&I - ADVANCING STRATEGY THROUGH M&A
M&A has long played a key role in CB&I’s development. In the early years of this century, CB&I embarked on a series of acquisitions that diversified its business offerings and improved its competitiveness. With the array of talent and expertise that it has assembled, the company has the flexibility to work on a project at any stage—technology selection, front-end engineering design, design, fabrication, construction, operations and maintenance, or decommissioning—or throughout the project’s life cycle.
CB&I’s 2013 acquisition of The Shaw Group for $3 billion illustrates how the company uses M&A to advance its strategy. With the acquisition of the Louisiana-based company, a leader in infrastructure for oil and gas exploration, CB&I positioned itself to ride the North American energy boom and anticipate the expansion of the North American LNG market.
Outside analysts give the company high marks for its ability to integrate its acquisition targets and capture synergies from the combination. The acquisition of Shaw, which roughly doubled CB&I’s headcount to 55,000, is again a case in point. “Their success in integrating Shaw is very impressive,” said John Rogers, an analyst at D.A. Davidson & Co. “When two big engineering and construction firms combine, you’re acquiring people. Trying to integrate two different cultures, with different processes and procedures, requires adept management. CB&I has shown they have that.”
The Shaw deal gives CB&I the scale it needs to diversify across the energy industry and extend its presence into additional end markets. It’s now positioned to do business in markets spanning liquefaction, refining, petrochemicals, and power generation (both nuclear and fossil fuel), as well as environmental protection and remediation services for government and commercial customers. Clearly, as long as the ECS market continues to evolve, so will CB&I, using timely M&A to enhance its business portfolio and address new markets.
We also saw several local champions in developing markets come of age. In many cases, the company acted as a concessionaire or more traditional infrastructure business model; other companies capitalized on their positions as access points for global E&C companies looking to enter new regions. For example, Pinfra, an infrastructure leader in Mexico, restructured in 2003 and built a high-growth business model around concessions that now deliver reliable cash flows as well. Finally, some companies—such as NCC AB (the second-largest construction company in Scandinavia)—that operate in mature markets benefited from a rebound from the depths of 2008 valuations.
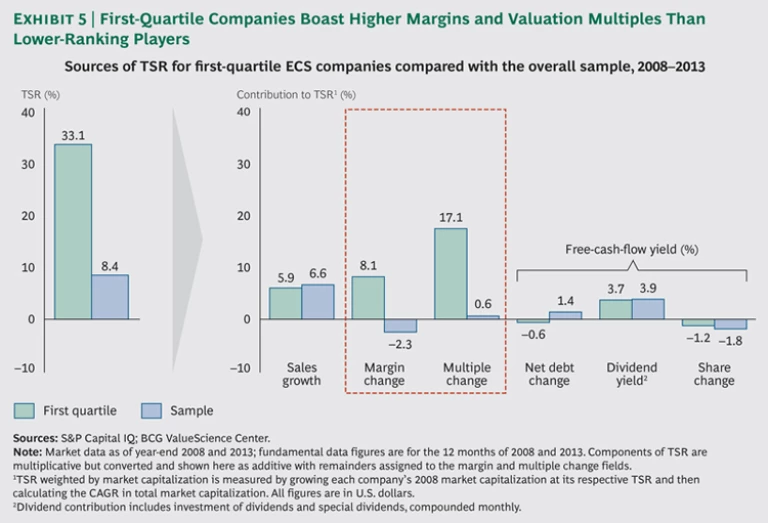
It is telling that most of the first-quartile performers posted improved margins and associated improvements in valuation multiples in contrast to the overall sample, whose margins slipped from 2008 to 2013. (See Exhibit 5.) The market rewarded the top performers for strengthening their competitive positions and business models. Ordinarily, valuation multiples and margins have an inverse relationship, but they improved in tandem at several first-quartile companies.
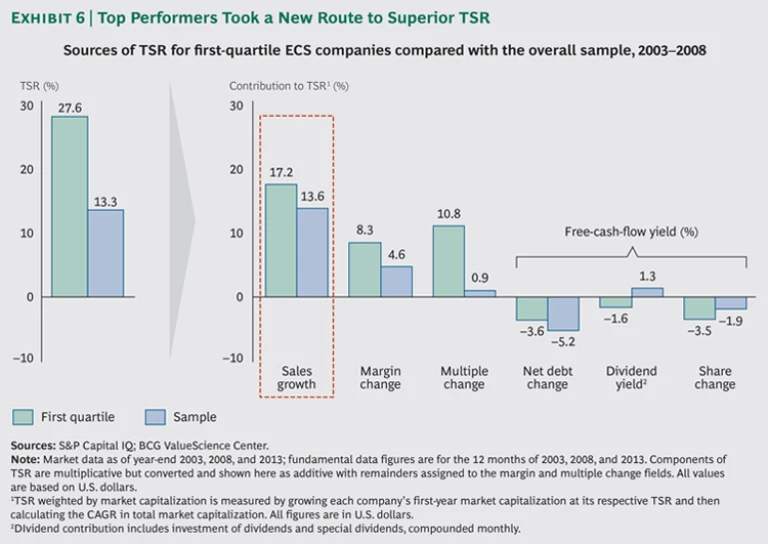
Underscoring just how dramatically this dynamic diverged from the previous five years’ performance, first-quartile performers delivered lower growth than the overall sample (about 6 percent, compared with 7 percent annually). By contrast, from 2003 through 2008, first-quartile sales outgrew the sample: about 17 percent, compared with 14 percent. (See Exhibit 6.) Those results demonstrate just how frothy those years were: the companies in our sample enjoyed double-digit growth and strong gains in margins and valuation multiples.
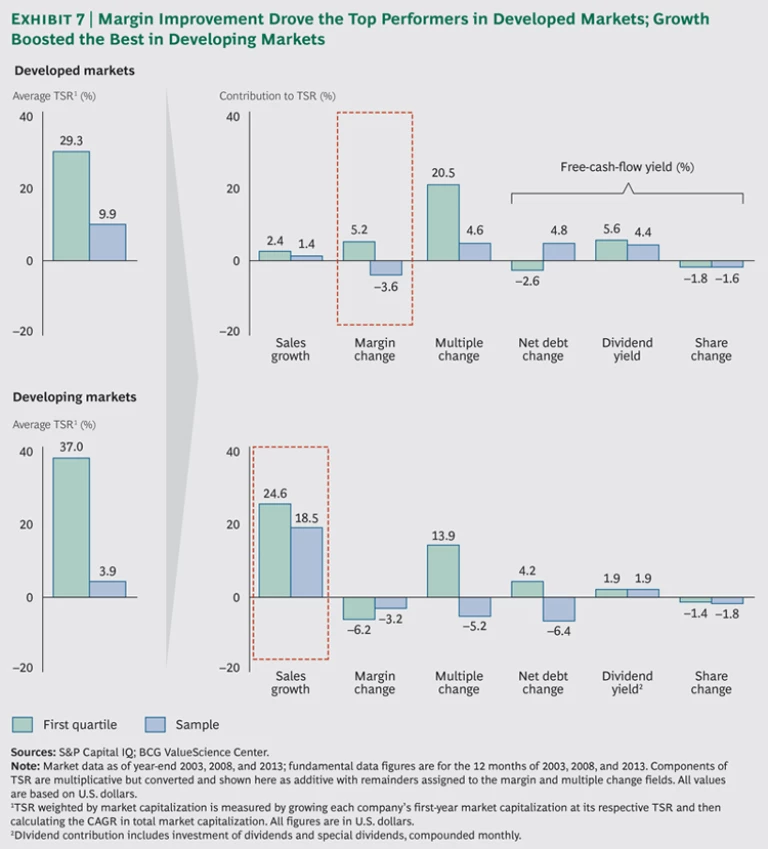
It is interesting to note that the margin story is a tale of two very different worlds. Top performers that focus on mature markets—for example, CB&I and NCC AB—increased profits on the strength of improved margins. The overall mature-market sample, on the other hand, experienced margin declines. (See Exhibit 7.) Meanwhile, top performers such as Pinfra that focused on the developing world saw their margins decline over the past five years at a steeper rate than the overall developing-world sample. However, fast sales growth averaging about 25 percent more than offset the fall in margins.
It is clear that for most of our developed-world E&C companies—which are the largest in our sample and have, in many cases, dominated the landscape in recent decades—the focus on margins and operational excellence is absolutely critical in the near term. Cost discipline has risen to the top of many of our clients’ radars, in some instances in direct response to activist pressure . These companies have prioritized right-sizing the organization, especially at the center and in the back office. Many have scaled up and centralized direct and indirect procurement, applied lean construction techniques, and improved project staffing, management, and cost controls across the portfolio.
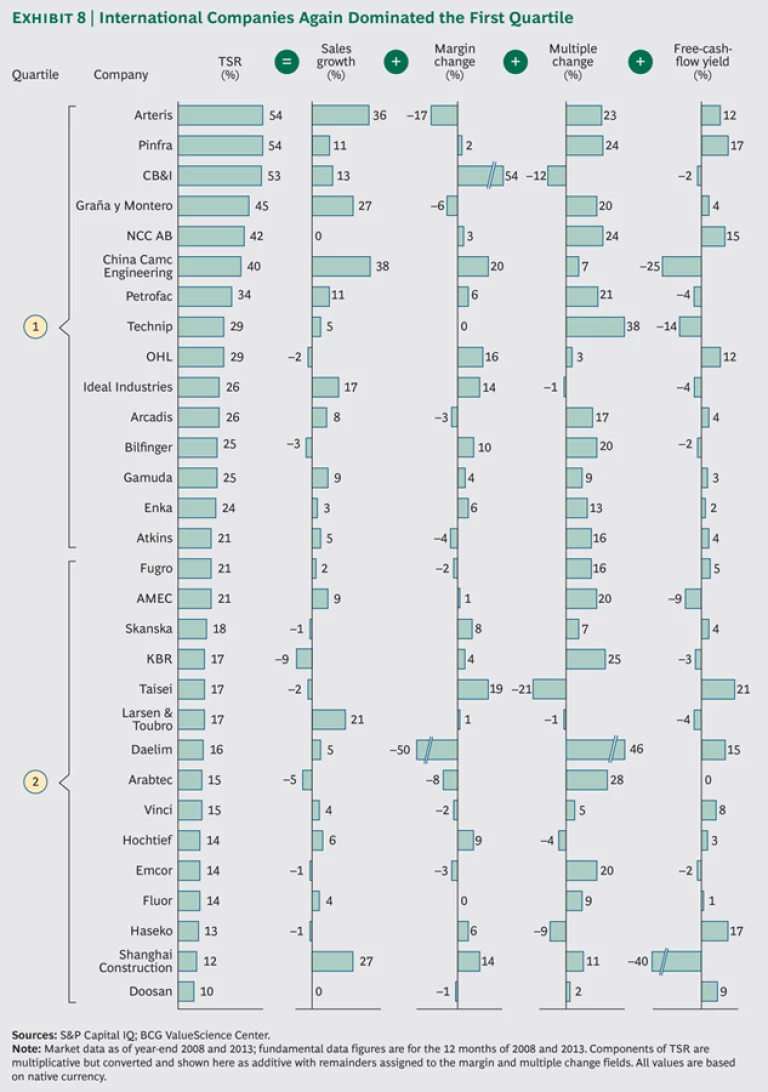
Companies focused on developing markets, particularly with concessionaire business models that promise steady cash flows well into future years, are still evaluated primarily on the basis of their growth potential. But the days of big E&C companies simply hiring and outgrowing their cost issues appear to be over. The absence of large, established developed-world companies such as KBR and Fluor from the first quartile underscores that point. (See Exhibit 8.)
Results Vary by Business Model
As we did in our inaugural report last year, we have grouped the ECS companies, each according to its dominant business model—D&E, process E&C, infrastructure, and concessionaire—in order to achieve a clear understanding of how the various business models fared over the past five years in the rally from the financial crisis. We used our best outside-in assessment to determine the dominant model for each company that follows more than one.
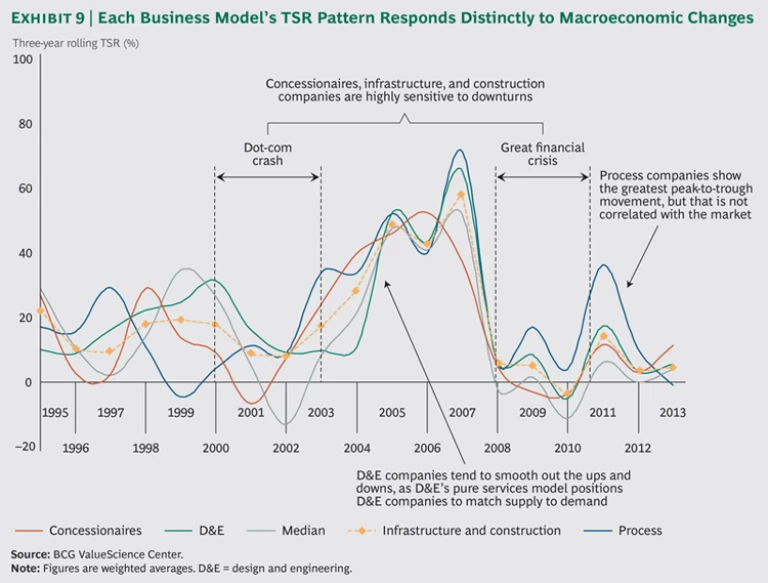
The business models respond differently to changes in the macroeconomic environment. (See Exhibit 9.) Concessionaires are highly sensitive to GDP growth trends because they often take traffic and volume risks associated with user demand for assets. D&E companies are less capital-intensive and, in many cases, have consultancy businesses that are less sensitive to economic swings than other models. Therefore, their performance tends to be less volatile over time. Infrastructure construction companies are highly capital-intensive and thus have heightened sensi-tivity to both government infrastructure spending and payment slowdowns during economic contractions, which impair their working capital. Process E&C companies tend to be the most volatile, because their business fluctuates with commodity prices and the mineral capital-expenditure cycle, which has more pronounced peaks and valleys than GDP.
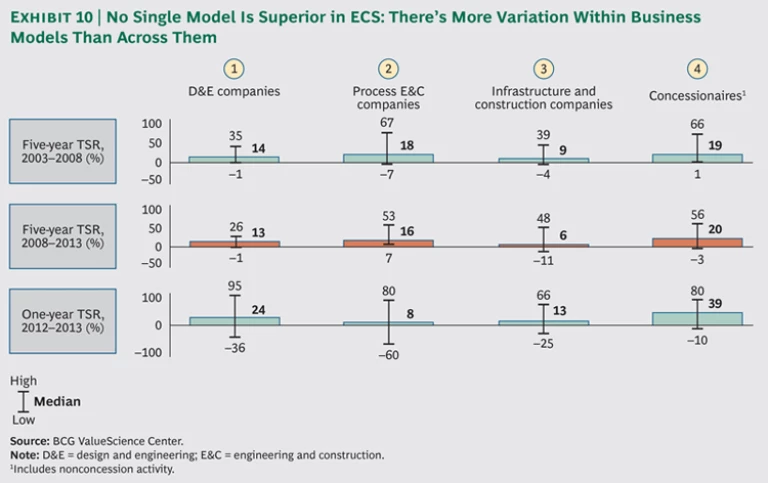
Grouping companies by business model, we found distinct differences in their performance during the past five years. (See Exhibits 10 and 11.) The concessionaire category includes companies that turned in some of the best five-year average TSRs as well as some of the worst, yet overall, concessionaires generated the strongest five-year TSR performance—a marked change from 2003 through 2008, when process companies routinely turned in the highest TSRs. D&E companies tended to cluster in the middle of the TSR range and, as a group, turned in the least volatile performance from 2008 through 2013. Process companies have enjoyed a strong five-year run thanks to the boom in commodities (that is, raw materials extracted from the ground), but their returns moderated somewhat in 2013 as commodity prices began to ease. TSRs of infrastructure and construction companies were generally near the bottom of the range, reflecting the sharp slowdown in government and commercial contracting that followed the financial crisis.
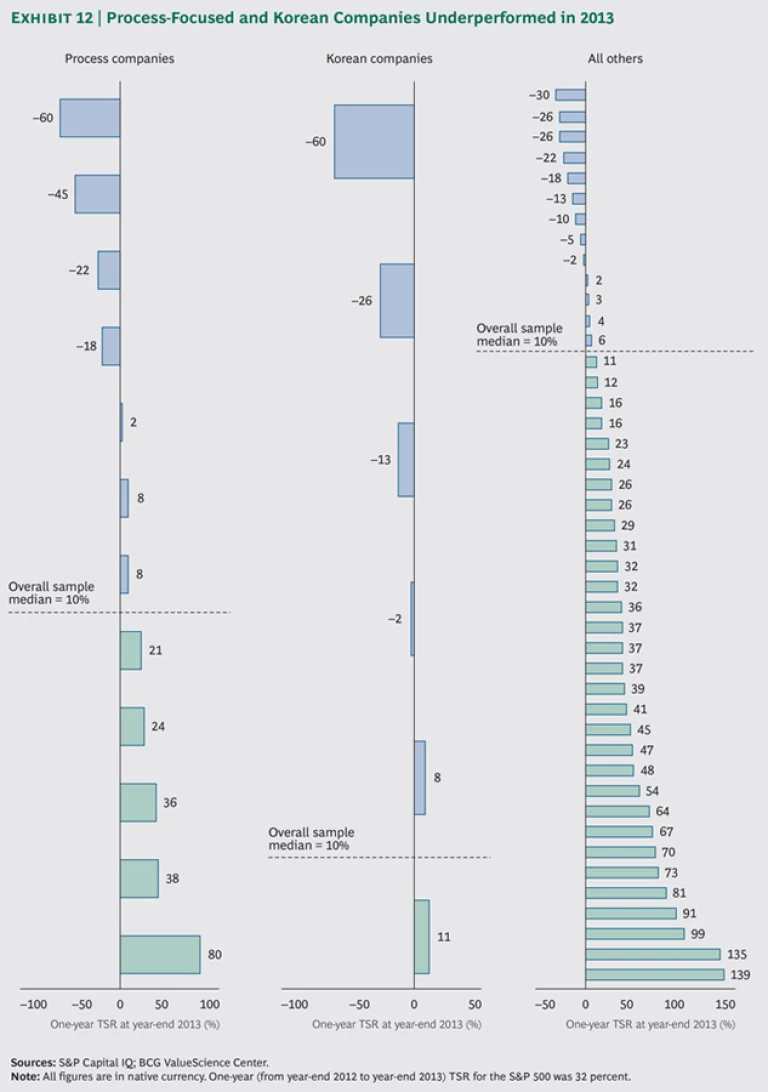
Observations of 2013 results suggest that in the coming years, the ECS industry may undergo another reshuffling of the ranks. Many strong performers during the past five years experienced significant TSR declines in 2013, especially process-focused companies and companies based in South Korea. (See Exhibit 12.) Median TSRs of process companies fell to 8 percent in 2013, half their five-year returns. However, the median encompasses a wide range of individual company performance. Concessionaires, on the other hand, enjoyed a strong TSR resurgence in 2013 after a long period of comparative underperformance.
Although results did vary by business model, differences in TSRs within categories were greater than differences across them. As that finding suggests, success in the ECS business is not merely a matter of choosing the business model that’s hot at any given moment in time. In the right hands and with the right focus and management, any of the four models is capable of generating above-average TSRs. That is to say that no business model can alone produce superior performance. Soundness of strategy and strength of execution are the real keys.
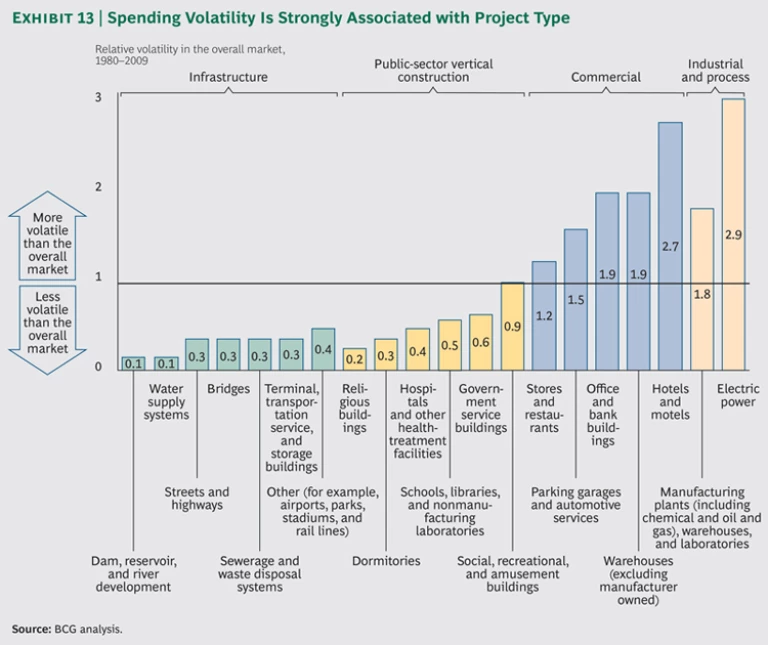
In addition, the imperfect correlation of returns across business models suggests that the best-run businesses will seek to optimize the shape and balance of the business models and regions in their overall portfolios in order to optimize growth and human capital development in all economic cycles. Whereas infrastructure and public-sector spending are generally stable across cycles, commercial spending—especially for industrial and process projects—is much more volatile. (See Exhibit 13.) The ability to harness this dynamic—tapping into strong returns from volatile sectors while mitigating the risk of being “all in” on any of them—can be a source of superior returns over time. Furthermore, idle capacity is particularly negative in human-capital-intensive businesses in which engineers need to work on projects in order to develop professionally and build their résumés. The ability to flex resources across business models and markets as cycles change is a critical success factor for many market-leading companies.
The Six Imperatives of Top Performance
What can ECS companies expect in the next five years? We have identified six imperatives that companies must follow for the foreseeable future if they aspire to achieve top TSR performance.
- Focus on execution excellence and bottom-line margins.
- Build resilience to withstand increasing global competition.
- Achieve scale—but not at any price.
- Focus on the regions and sectors that promise above-average five-year growth.
- Be prepared to win through M&A.
- Maintain a disciplined approach to dividends and the balance sheet.
Execution Excellence and Bottom-Line Margins
Healthy profits aren’t simply a matter of being in the right place at the right time. For leading ECS companies, excellence in bidding and pricing is a high priority. They are strategic about procurement and highly effective in their operations. They are also highly productive, streamlining and right-sizing their organizations to achieve maximum effectiveness with minimal waste.
We have observed that leading companies use comprehensive margin- and operational-excellence frameworks across their portfolios to manage the overall business and enhance profitability. Those frameworks enable the companies to systematically search for opportunities to reduce costs and increase efficiencies at their business units and thus improve returns to shareholders.
Specifically, we have seen significant improvements in overall organization design. Top companies focus intently on establishing optimal spans of control, reducing organizational layers, and, across business units, maintaining overhead ratios that are proportional to their revenues. In addition, leading companies are setting up shared-services organizations to handle back-office work and shifting high-value engineering and design work to regions where hourly costs are lower. Companies that systematically assess their ability to control TSR levers can position themselves to seize opportunities and outperform not just in the current economic environment but also during any other phase of the business cycle.
On the direct-cost side, we have observed a renewed focus on project excellence and cost controls. In particular, companies are using lean construction tools to deliver projects at lower cost and eliminate waste and queuing. These efforts, which are often combined with a focus on using scale to control procurement costs across projects, can optimize competitiveness in bidding.
Finally, commercial excellence is a hot topic for many leading companies. They have assigned high priority to establishing management processes that ensure optimal project pricing and business-development client coverage (the so-called zipper model) and that orient business development priorities toward company-critical projects.
Resilience
Established companies in mature markets face rising competition from the likes of Korea, India, and China, and it’s critical to develop the capabilities and cost structures needed to take them on. That means that mature-market companies should approach commodity projects with caution, bidding on them only if they have a clear cost advantage.
In general, they can’t match the low cost bases of the Asian newcomers, so they need to focus instead on accentuating their differentiators, including, their more extensive and polished skill sets, rosters of experienced and distinguished talent, intellectual property, and superior processes. Bids aren’t won or lost on cost alone, after all.
Similarly, companies from developing markets such as Brazil are increasingly looking for opportunities to boost growth and market share in developed markets. Like their developed-world counterparts, those companies will have to develop cost structures and delivery models that enable them to hold their own in markets with significantly more competition than they confront at home.
The Importance of Scale
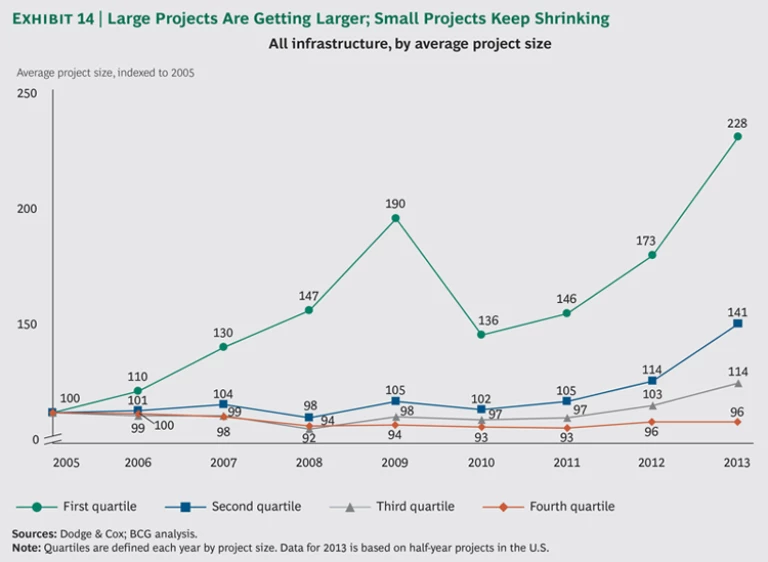
In mature markets, at least, size still matters. Big projects continue to get bigger, and only large-scale companies are credible bidders for such ambitious undertakings. (See Exhibit 14.)
Recent history shows that scale is self-reinforcing: market share leaders use their scale to increase their leads over their rivals. Economies of scale can provide a pricing edge, and with scale, come depth and breadth of expertise and the ability to mobilize resources quickly when a new megaproject beckons. The hefty balance sheets of the largest ECS companies also enable them to take on projects that pose greater risk because of their size or their fixed-price terms, and the largest companies have the wherewithal to provide equity financing when necessary. Scale also implies a depth of experience that is reflected in improved execution. What’s more, scale might be the best bankruptcy insurance available: companies with diverse projects in multiple markets are the least likely to capsize in unforeseen turbulence.
Focus on High-Growth Sectors and Regions
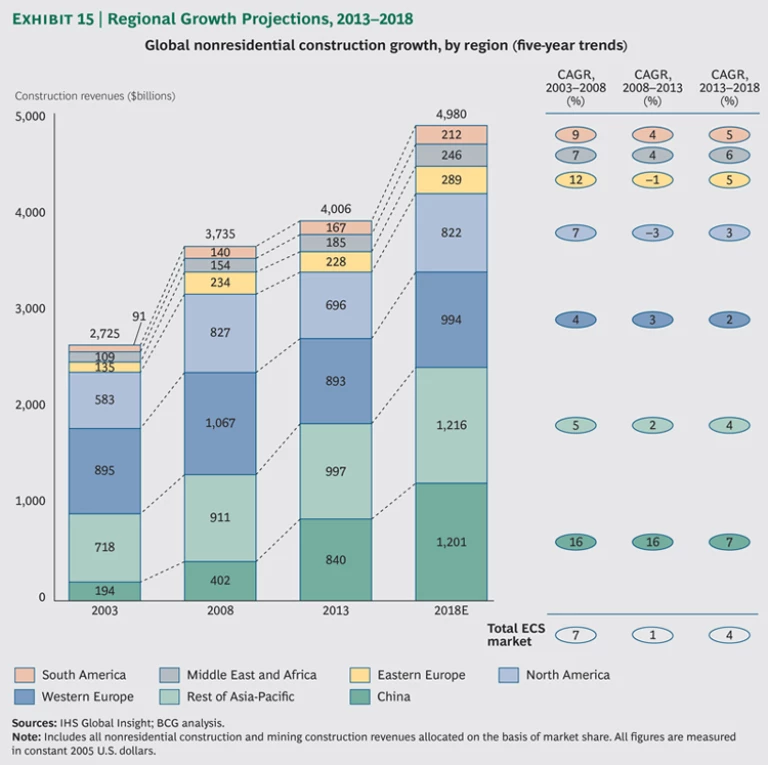
The global infrastructure market grew at a CAGR of only 1 percent in the most recent five-year observation period. We expect the overall market to return to more normal levels of historical growth of 4 percent through 2018. (See Exhibit 15.) Yet even in an improving environment, ECS companies will have to select their growth and profit pools carefully if they are to achieve significant value creation during the next five years.
Although overall growth will return to normal, growth trends in individual regions and countries will differ markedly from those of the previous five years. The largest individual change is China’s forecast growth, which we expect to decline from a CAGR of 16 percent for the past ten years to 7 percent going forward. Although China remains one of the fastest-growing markets globally, this slowdown will have large ripple effects not only in China but also throughout the infrastructure subsector. In the past decade, China’s rapid infrastructure build-out has put considerable upward pressure on commodity prices, particularly for materials such as the coal and iron ore used to make steel. Declining construction activity in China thus presages a growth slowdown for important commodity markets as well over the next five years.
Furthermore, we expect growth rates in mature markets to accelerate to the low single digits during the next five years after a prolonged stretch of negative growth. ECS companies that in the past five years prioritized investment in developing markets should regard this 5- to 6-percentage-point upward swing as a spur to refocus on growth in mature markets. We believe that the U.S. and the UK will offer some of the largest growth opportunities among mature markets. We therefore expect renewed M&A activity in mature markets in the next five years, as well as concerted moves into those markets by international companies.
An increase in growth in the Middle East and Africa also presents important opportunities for the next few years. In particular, growth rates and infrastructure development in markets such as Saudi Arabia, Qatar, and Turkey will remain high. These markets have historically been very strong markets for large global E&C companies and will remain very attractive for the foreseeable future.
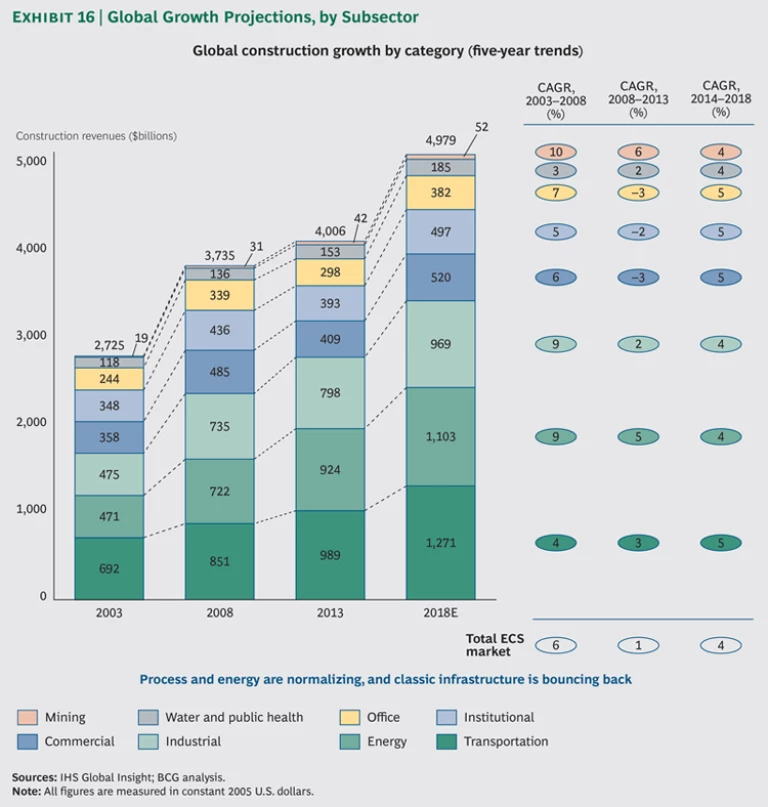
We also expect a cyclical rotation among sectors in the coming five years. (See Exhibit 16.) For the past ten years, process-related E&C has outperformed more traditional infrastructure E&C, propelled by rising commodity prices and aggressive mineral extraction. Over the next five years, we expect growth in traditional infrastructure to exceed process-related construction. In particular, transportation infrastructure, which is the biggest sector globally, is expected to climb from a CAGR of 3 percent to 5 percent from 2014 through 2018. In addition, we expect to see a significant global rebound in traditional vertical construction of industrial, office, and government buildings, as has historically been the case when GDP growth picks up.
This realignment puts pressure on most infrastructure companies—which have spent the past ten years building the process and mineral components of their business portfolios—to enhance their classic civil-works capability. More generally, winning companies will be characterized by their ability to identify and capitalize on shifting cyclical tailwinds and reshape and rebalance their portfolios for both the short and long terms. This is a crucial capability not just in the current economic environment but also at any other phase in the business cycle, and companies looking to vault into the top ranks should cultivate it.
Winning Through M&A
ECS companies have been active in the M&A market—for good reason. M&A enables ECS companies to gain scale, which, in turn, helps them compete for the largest contracts. M&A is also an important lever for acquiring talent, especially in high-growth regions such as North America, as evidenced by the mergers of CB&I and Shaw and AMEC and FosterWheeler.
In terms of value creation, M&A offers significant revenue synergies. Companies with regional scale can acquire new capabilities to sell into their extant markets, while companies with proven capabilities can access new customer sets by acquiring companies in new regions. The importance of revenue synergies sets ECS apart from most other industries in which cost synergies are the primary sources of value creation. Investors in those industries expect acquirers to generate efficiencies by, for example, eliminating overlapping functions and gaining scale efficiencies in support functions or procurement.
In recent years, the search for cost synergies has also motivated some ECS mergers, reflecting the sector’s broader shift toward margin enhancement. For example, top performer CB&I delivered significant value to investors through disciplined planning and execution of cost synergies in the Shaw postmerger integration.
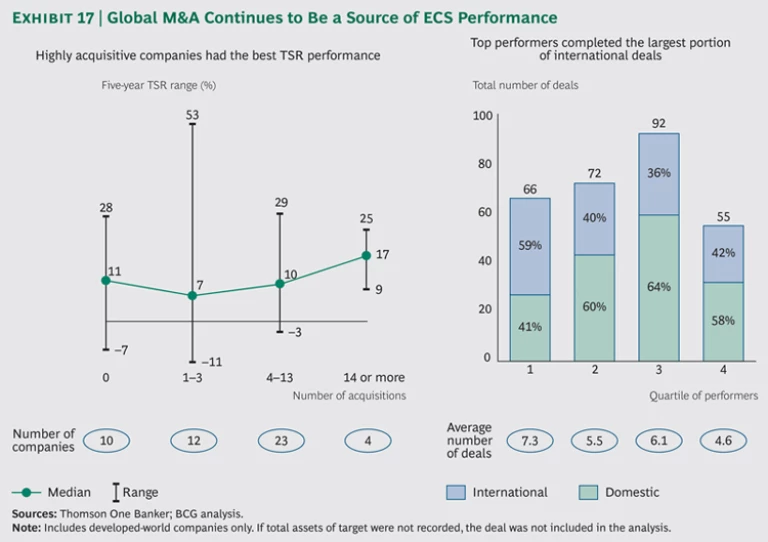
ECS M&A data from the past five years shows that serial acquirers (those that completed at least 14 deals over the five-year period) delivered the highest TSR: the median was 17 percent, but it ranged from 9 to 25 percent. (See Exhibit 17.) Bilfinger, Fugro, and Vinci were among the most active dealmakers, and each landed among the first or second quartile in terms of TSR performance. Meantime, first-quartile performers completed the greatest number of international deals: nearly 60 percent of targets were based in countries other than the home of the first-quartile company. Among first-quartile performers, AMEC, Arcadis, and Bilfinger were the most active dealmakers, each conducting about ten such transactions, according to data from Thomson One Banker.
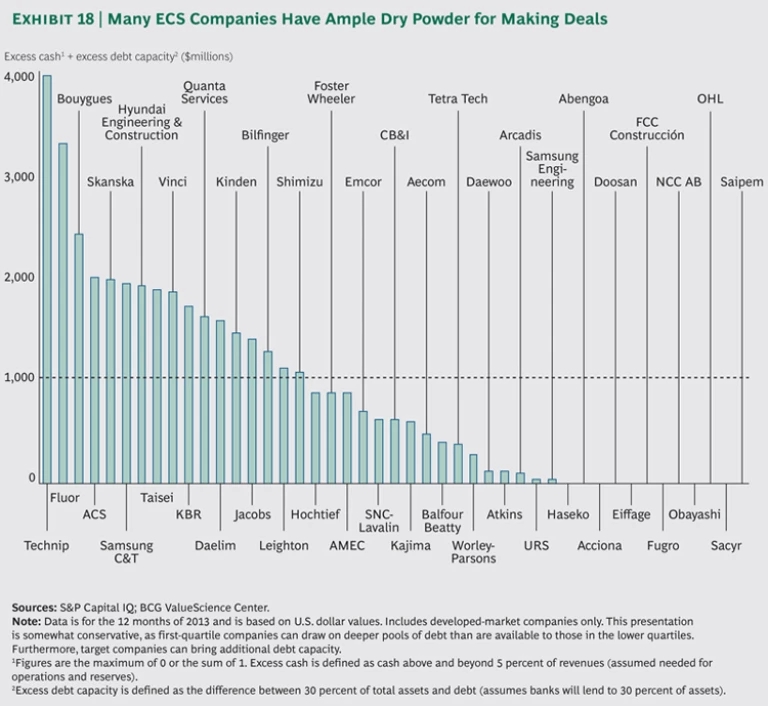
The largest companies in developed markets still have ample financial resources—in terms of both retained cash and borrowing power—to commit to acquisitions. (See Exhibit 18.) We identified 19 companies with at least $1 billion in “dry powder” on hand as of the end of 2013. That’s quite a reservoir, considering that most deals in the ECS space are relatively small “tuck-ins” focused on adding capabilities or footholds in new markets. In addition, by tapping the target’s borrowing capacity and using creative deal structures, acquirers can, in many cases, go well beyond their stated dry-powder figures for the right deal. It’s therefore likely that the ECS industry will remain very active in M&A, and inorganic growth will remain a critical pathway to sustained TSR performance.
Our observations of M&A in the ECS space indicate that experience, strong processes, and discipline are critical. The companies that proactively commit themselves to M&A as one pathway to growth tend to find targets that are more strategically sound, negotiate better prices, and achieve more synergies upon integration. This is no coincidence. Committing to M&A means being immersed in the deal flow. Active acquirers evaluate dozens of potential targets and closely analyze several potential targets for every deal they actually consummate. Executives who proactively source several targets don’t need an investment banker’s help to distinguish an appropriate target from an unsuitable one. Such executives are able to move quickly on targets that can strengthen the company’s value proposition and TSR potential, and they are able to quickly walk away from deals that are potential distractions. Furthermore, we have found that it takes two to three years of commitment and resources before experience and processes begin paying significant dividends.
Capital Discipline
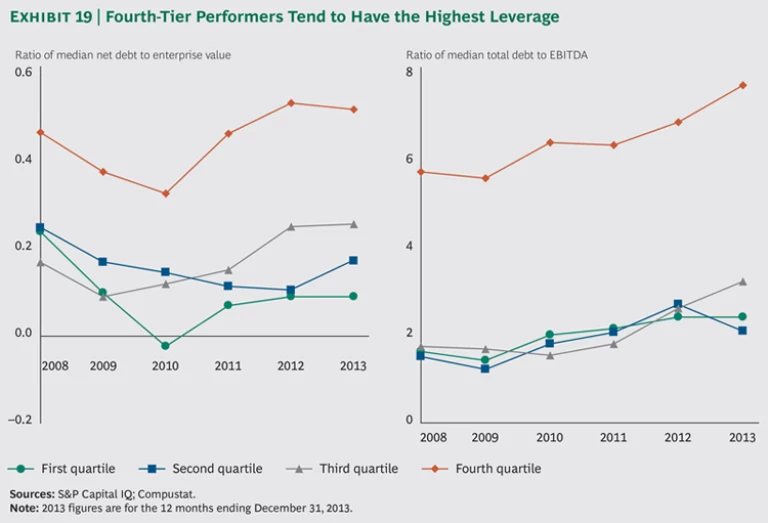
ECS executives know better than most that business fortunes can reverse virtually overnight. The best protection against unforeseen market shocks is a solid balance sheet with modest debt levels and a strong credit rating. By the same token, high debt ratios and weak balance sheets are the mark of the lowest-performing and most vulnerable ECS companies. (See Exhibit 19.)
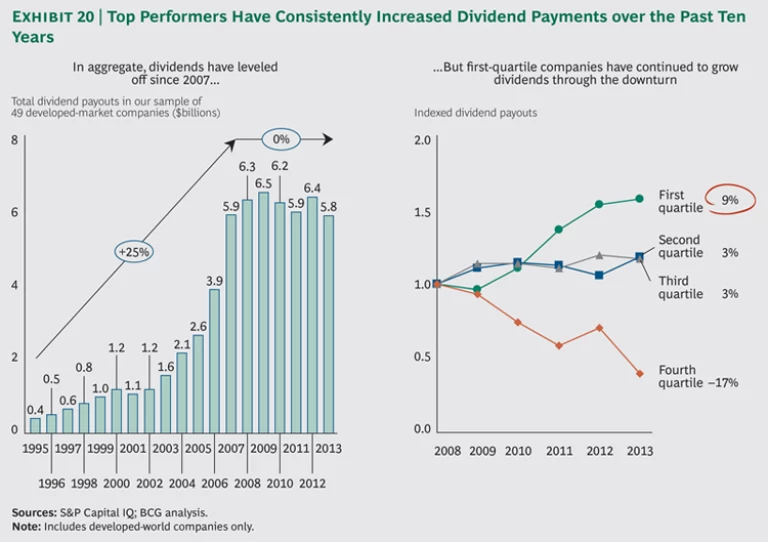
In today’s more cautious environment, the financial markets view dividends as the price of entry to the top corporate ranks. As tempting as it might be to reinvest all free cash flow into continued growth, investors consider dividends a leading indicator of corporate health, and they will not support large mature-market companies that hoard cash instead of returning it to shareholders. (See Exhibit 20.)
Closing Thoughts
No one should expect the next five years in ECS to mirror the past five. However, on the basis of our experiences in the sector, analysis, and on-the-ground observations, we think that some aspects of the past should be taken as reasonably certain elements of the future. So we’d like to leave our readers with three pieces of advice for the rest of 2014 and early 2015.
Maintain focus on margins. Risk exposure in the ECS sector is relatively high at the moment, with many critical companies engaged in a larger-than-usual share of lump-sum contracts and megaprojects. Resource constraints could tip the balance back to reimbursable contracts, but for now, any upward swing in costs will expose financial weaknesses and squeeze cash flows.
Expect more consolidation and M&A. A growing share of deals will cut across business models as companies seek diversification across locations to balance exposure to low- and high-growth regions. Some sellers will be motivated by financial distress, but, whatever the motivation, it is important for ECS leaders to understand the strategic imperatives and bidding environment.
Companies from developing markets could step up. Global competition can only intensify, as some developing-world companies come of age and achieve the scale and competence necessary to land business in developed markets that are growing. Their home turf tends to be relatively protected by barriers such as local-content requirements and foreign-exchange and payment risks. Deal making could accelerate as developing-world companies look to diversify and top companies from the developed world look for credible entry points to high-growth markets.
Acknowledgments
The authors would like to acknowledge the contributions of Santiago Castagnino, Win Chia, Philippe Dehillotte, Hady Farag, Kerstin Hobelsberger, Andrew Loh, Bridget Moede, Katharina Rick, Rafael Rilo, and David Taube.
