“Petabytes allow us to say: ‘Correlation is enough.’”
- Chris Anderson, Wired Magazine, June 23, 2008
The sentiment expressed by Chris Anderson in 2008 is a popular meme in the big data community. “Causality is dead,” say the priests of analytics and machine learning. They argue that given enough statistical evidence, it’s no longer necessary to understand why things happen—we need only know what things happen together.
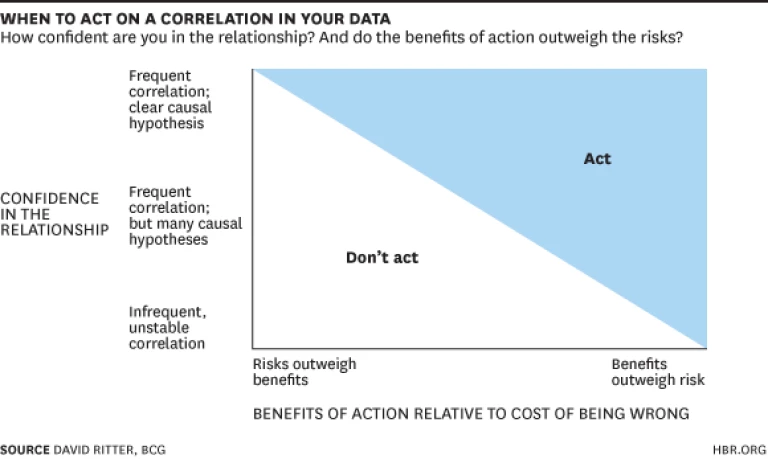
But inquiring whether correlation is enough is asking the wrong question. For consumers of big data, the key question is “Can I take action on the basis of a correlation finding?” The answer to that question is “It depends”—primarily on two factors:
- Confidence That the Correlation Will Reliably Recur in the Future. The higher that confidence level, the more reasonable it is to take action in response.
- The Tradeoff Between the Risk and Reward of Acting. If the risk of acting and being wrong is extremely high, for example, acting on even a strong correlation may be a mistake.
The first factor—the confidence that the correlation will recur—is in turn a function of two things: the frequency with which the correlation has historically occurred (the more often events occur together in real life, the more likely it is that they are connected) and the understanding around what is causing that statistical finding. This second element—what we call “clarity of causality”—stems from the fact that the fewer possible explanations there are for a correlation, the higher the likelihood that the two events are in fact linked. Considering frequency and clarity together yields a more reliable gauge of the overall confidence in the finding than evaluating only one or the other in isolation.
Understanding the interplay between the confidence level and the risk/reward tradeoff enables sound decisions on what action—if any—makes sense in light of a particular statistical finding. The bottom line: Causality can matter tremendously. And efforts to gain better insight on the cause of a correlation can drive up the confidence level of taking action.
These concepts allowed BCG to develop a prism through which any potential action can be evaluated. If the value of acting is high and the cost of acting when wrong is low, it can make sense to act based on even a weak correlation. We choose to look both ways before crossing the street because the cost of looking is low and the potential loss from not looking is high (in statistical jargon, what is known as “asymmetric loss function”). Alternatively, if the confidence in the finding is low due to the fact you don’t have a handle on why two events are linked, you should be less willing to take actions that have significant potential downside.
Consider the case of New York City’s sewer sensors. These sensors detect the amount of grease flowing into the sewer system at various locations throughout the city. If the data collected shows a concentration of grease at an unexpected location—perhaps due to an unlicensed restaurant—officials will send a car out to determine the source. The confidence in the meaning of the data from the sensors is on the low side–there may be many other explanations for the excess influx of grease. But there’s little cost if the inspection turns up nothing amiss.
Recent decisions around routine PSA screening tests for prostate cancer involved a very different risk/reward tradeoff. Confidence that PSA blood tests are a good predictor of cancer is low because the correlation itself is weak—elevated PSA levels are found often in men without prostate cancer. There is also no clear causal explanation for how PSA is related to the development of cancer. In addition, preventative surgery prompted by the test did not increase long-term survival rates. And the risk associated with screening was high, with false positives leading to unnecessary, debilitating treatment. The result: the American Medical Association reversed its previous recommendation that men over 50 have routine PSA blood tests.
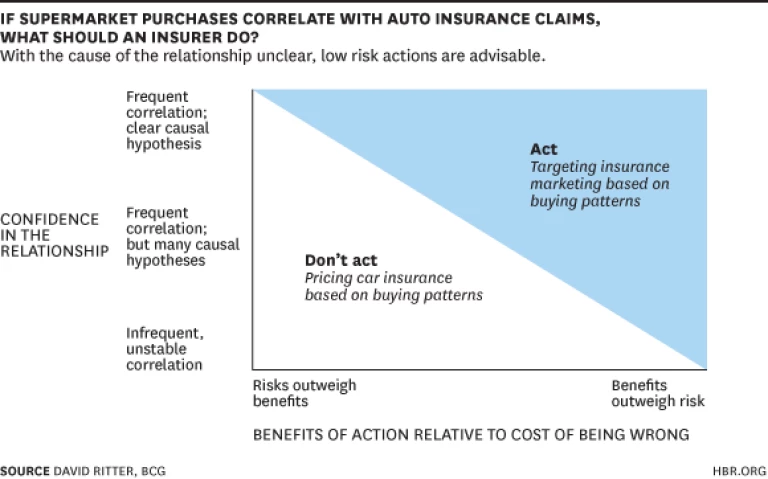
Of course, there is usually not just one, but a range of possible actions in response to a statistical finding. This came into play recently in a partnership between an Australian supermarket and an auto insurance company. Combining data from the supermarket’s loyalty card program with auto claims information revealed interesting correlations. The data showed that people who buy red meat and milk are good car insurance risks while people who buy pasta and spirits and who fuel their cars at night are poor risks. Though this statistical relationship could be an indicator of risky behaviors (driving under the influence of spirits, for example), there are a number of other possible reasons for the finding.
Among the potential responses to the finding:
- Targeting insurance marketing to loyalty card holders in the low-risk group
- Pricing car insurance based on these buying patterns
The latter approach, however, could lead to a brand-damaging backlash should the practice be exposed. Looking at the two options via our framework makes clear that without additional confidence in the finding, the former approach is preferable.
However, if we are able to find a clear causal explanation for this correlation, we may be able to increase confidence sufficiently to take the riskier, higher-value action of increasing rates. For example, the buying patterns associated with higher risks could be leading indicators of an impending life transition such as loss of employment or a divorce. This possible explanation could be tested by adding additional data to the analysis.
In this case, causality is critical. New factors can potentially be identified that create a better understanding of the dynamics at work. The goal is to rule out some possible causes and shed light on what is really driving that correlation. That understanding will increase the overall level of confidence that the correlation will continue in the future—essentially shifting possible actions into the upper portion of the framework. The result may be that previously ruled-out responses are now appropriate. In addition, insight on the cause of a correlation can allow you to look for changes that cause the linkage to weaken or disappear. And that knowledge makes it possible to monitor and respond to events that might make a previously sound response outdated.
There is no shortage of examples where the selection of the right response hinges on this “clarity of cause.” The U.S. army, for example, has developed image processing software that uses flashes of light to locate the possible position of a sniper. But similar flashes also come from a camera. With two potential reasons for the imaging pattern, the confidence in the finding is lower than it would be if there were just one. And that, of course, will determine how to respond—and what level of downside risk is acceptable.
When working with big data, sometimes correlation is enough. But other times, understanding the cause is vital. The key is to know when correlation is enough—and what to do when it is not.
This blog originally appeared on HBR.org .


