This is the first in a series of articles published as part of The Boston Consulting Group’s 2014 Value Creators report. The full report will be published in May.
In 2013, global equity markets outpaced their already strong 2012 performance. The MSCI All Country World Investable Market Index of total shareholder return (TSR) was approximately 26 per-cent last year—roughly 10 percentage points better than in 2012 and the highest return since 2009, when equity markets rebounded from the extraordinary losses due to the global financial crisis in 2008.
Of course, single-year TSR performance can be hard to interpret and is not necessarily a good predictor of long-term performance. Nevertheless, last year’s performance, coming immediately after the strong performance of 2012, suggests that we were correct last year in detecting signs of sustainable value creation in global equity markets.
The Boston Consulting Group recently analyzed the 2013 TSR of more than 6,000 companies across 44 countries. There were four key findings:
- Although emerging-market countries once again had the highest-performing stock markets in the world, the strong gains in 2013 were driven largely by developed countries. In fact, most emerging markets did poorly in 2013.
- In both cases, the big winners were “unusual suspects.” Dubai was the top value creator for emerging markets and Japan for developed markets.
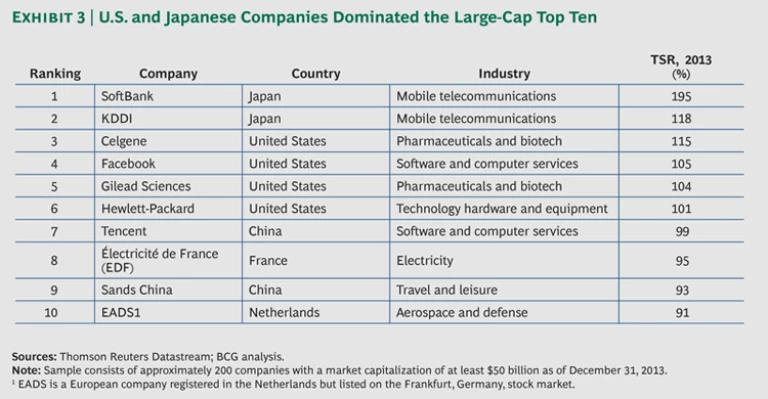
- Although average TSR in 2013 was 26 percent, the top single-year value creators delivered truly extraordinary returns. The top ten companies in our sample of approximately 200 large-cap companies (those companies with year-end market valuations of at least $50 billion, or about €36 billion), generated TSR from 91 to 195 percent.
- The monetary policies of the world’s central banks played a major role in driving high TSR. But continuing economic growth in the U.S. and Japan, the world’s largest and third-largest economies, respectively, was also a significant contributor.
The Poor Performance of Emerging Markets
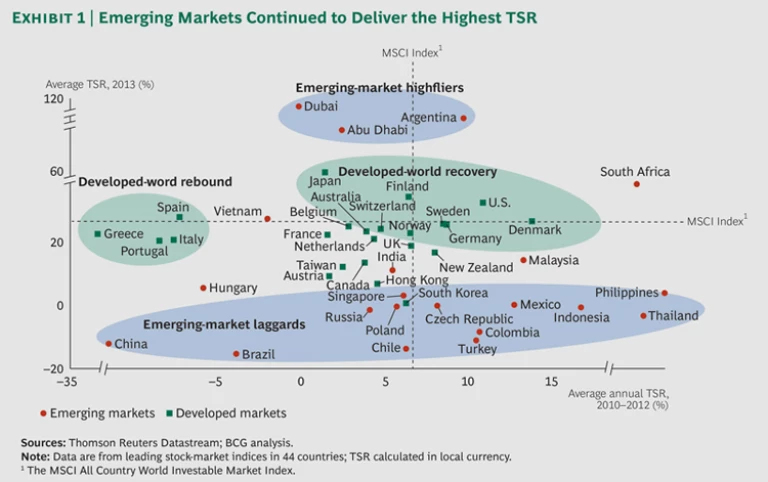
To get a sense of the trends that shaped value creation last year, we compared the performance of equity markets around the world. Exhibit 1 plots the average TSR performance of 44 local stock markets for 2013 (on the y-axis) and the average annual TSR for the three-year period from 2010 through 2012 (on the x-axis).
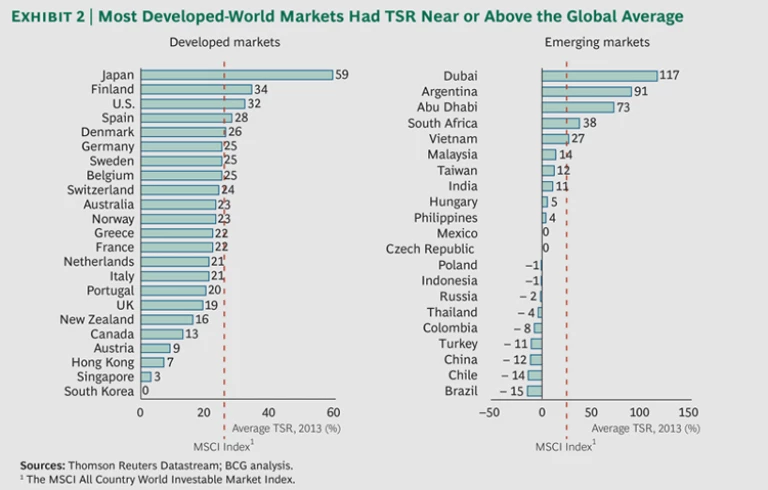
As one might expect, emerging markets continued to deliver the highest average TSR. However, the big emerging-market winners in 2013—Dubai (117 percent), Argentina (91 percent), and Abu Dhabi (73 percent)—were significantly different from those of the recent past. In fact, with the exception of South Africa and Vietnam, the rest of the emerging markets in our sample performed extremely poorly in 2013. Sixteen emerging-market countries delivered TSR below the global average—and nine actually lost value. In particular, the BRIC countries—Brazil, Russia, India, and China—continued to perform poorly. All but India generated negative returns, with Brazil (at -15 percent TSR) the worst-performing country in our sample. (See Exhibit 2.)
In marked contrast, the developed-world economies generated solid returns, with most countries delivering TSR near or above the global average, and only one, South Korea, creating no value. The leading developed-economy stock market was that of Japan, which had a TSR of 59 percent, the country’s highest since 1972, followed by Finland (34 percent), the U.S. (32 percent), and, surprisingly, Spain (28 percent).
The Impact of Global Monetary Policy
What explains these results? First, it’s important to emphasize that global monetary policy continues to be a major driver of high market returns. As central banks keep interest rates low, more and more money has shifted to equities in search of attractive returns, pushing multiples and overall TSR ever higher. Global price-to-earnings ratios have been on the rise since 2011 and in 2013 approached their pre-downturn peak.
Next, among the developed economies, it’s important to distinguish between those countries that are benefiting from a rebound from a previously low base and those that are benefiting from an uptick in economic growth. Take the four countries that, three years ago, we dubbed “the poor men of southern Europe”: Portugal, Italy, Greece, and Spain. Stock markets in these countries did reasonably well in 2013, but their performance has to be assessed against the massive losses in these markets in previous years. As Exhibit 1 illustrates, these four countries were among the worst performers during the three-year period from 2010 through 2012.
In contrast, there is the performance of the U.S. and—perhaps—Japan. Despite the U.S. government shutdown in October 2013, the U.S. economy has shown consistent signs of at least modest growth (the IMF currently estimates that U.S. GDP grew 1.6 percent in 2013), suggesting improving fundamentals. Increasingly, it is looking like a relatively safe haven for equities in what remains a volatile world—and especially compared with traditional emerging markets like the BRICs, where growth has been slowing.
Meanwhile, the combination of loose monetary policy, fiscal stimulus, and structural reforms known as “Abenomics” has rebooted GDP growth in Japan, the world’s third-largest economy, after more than a decade of deflation. The country’s 2013 GDP growth of 2 percent was reinforced by the yen’s 25 percent depreciation against the dollar, which had the effect of jump-starting a new round of Japanese consumption. It remains to be seen, of course, whether Japan can sustain this trajectory (after relatively rapid growth early in the year, the country experienced a slowdown toward the end of 2013). Nevertheless, if the world’s third-largest economy is able to keep growing, this could have a major positive impact on global equity markets.
The relative strength of the U.S. and Japanese economies is reflected in our list of the top ten value creators in 2013. (See Exhibit 3.) The top six spots are held by companies from these two nations, followed by two Chinese and two European companies. It’s also striking that most of the top ten are clustered in a relatively few high-performing sectors: mobile telecommunications, pharmaceuticals and biotech, and software and computer services.
Prospects for Transformation
As always, one must be extremely careful about drawing unequivocal conclusions from single-year TSR performance, which by itself is a poor indicator of long-term value creation. There is no guarantee that the countries, companies, or sectors at the top of this year’s list will be there next year. And the combination of slower growth in China and other emerging markets and the beginning of the unwinding of the U.S. Federal Reserve’s quantitative easing policy has already sent equity markets lower in 2014. Among the questions that we will be tracking throughout the coming year are the following:
- What type of value creation strategies make sense in a market environment that, in some respects, appears to be returning to a modest growth path in the developed world?
- What can we learn from those companies that have been not just one-year winners but top value creators over the entire five-year period from 2009 through 2013?
- Finally, and perhaps most important, which companies are delivering superior value, not merely because they are benefiting from positive macroeconomic trends but because they are transforming their own internal value-creation capabilities?
We will be exploring these and other questions in our 2014 Value Creators report in May.


