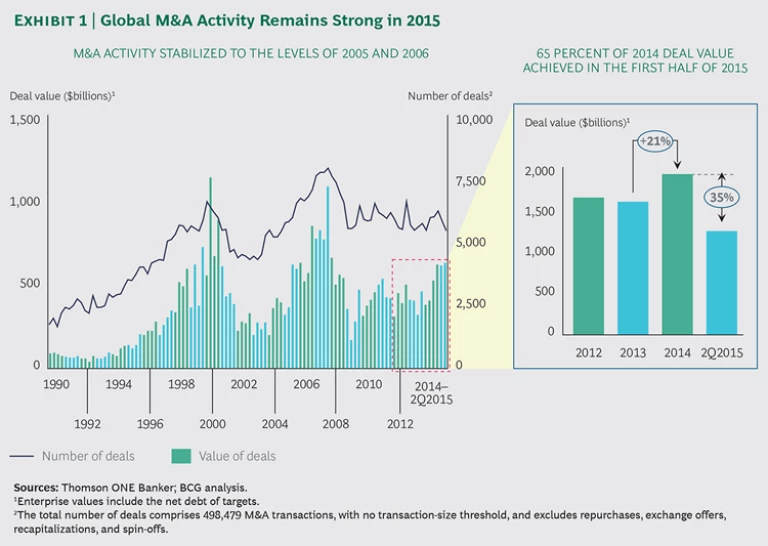
The indications of recovery early in 2014 proved prescient. The full year saw the global number of M&A deals and total deal value return almost to 2005 and 2006 levels, which were surpassed only by the heights achieved prior to the dot-com collapse in 2000 and the financial crisis in 2008. M&A activity has been broad based geographically—with double-digit increases in all the major regions of the world—and has taken place across a wide range of industries. The deals in each industry, however, are rooted in that sector’s or segment’s particular dynamics. The long-awaited recovery appears to have legs—deal volume and deal value have continued to show strength in the first two quarters of 2015—although it bears remembering that M&A cycles are getting shorter over time, and the drop in deal value from the past two market peaks was severe—more than 80 percent within 18 months of the high points in 2000 and 2007.
Related Content
In The Boston Consulting Group's 2014 M&A report, we discussed how the market was being fueled in part by a continuing rise in divestitures, which represent a powerful strategy for unlocking value and improving performance by focusing on core operations. (See “ Creating Shareholder Value with Divestitures ,” BCG article, September 2014.) Divestitures continue to be a vital source of M&A activity . But as economies around the world improve, corporate cash reserves grow, and financing remains cheap, the question in the boardroom becomes, “How do we spend the money?”
For CEOs in high-growth sectors, such as technology, there are plenty of opportunities to invest in organic expansion through new products, markets, and locations. For companies in more mature industries—energy, health care, consumer goods, and financial services, to name a few—the outlook for internal growth is often less robust. One answer to the spending question lies in channeling cash reserves and inexpensive financing into growth through acquisition. But even as M&A volumes soar, big questions linger around the ability of companies to generate value by buying their way to growth. (See “ Should Companies Buy Growth? ,” BCG article, October 2015.)
Acquiring revenue is certainly one way to grow the top line, but economists, M&A professionals, and other experts frequently debate how successful acquisitions are at delivering bottom-line growth—and especially growth in value for shareholders. Our own research, based on BCG’s proprietary global database of more than 40,000 M&A transactions since 1990, shows that the results vary widely and depend on a range of factors, including industry, market dynamics, metrics measured, time frame, and an individual company’s own history and experience with making and integrating acquisitions. (See “ From Acquiring Growth to Growing Value ,” BCG article, October 2015.)
The M&A Recovery Picks Up Pace
After all the hopeful signs evidenced in 2013, last year delivered: 2014 was a banner year for M&A. Total transaction value jumped more than 20 percent to almost $2 trillion, the recovery took in a wide range of industries and players, and the rising number of deals in each successive quarter established a fast-paced momentum that has continued in 2015. (See Exhibit 1.) Total deal value in just the first half of this year reached 65 percent of total deal value in all of 2014, and there have been multiple huge and high-impact deals announced in such industries as energy, media, health care, consumer products, and financial services.
M&A activity has been broad based geographically, with all the major regions of the world showing double-digit increases in 2014 over 2013. Megadeals (deals with values of more than $10 billion), which we highlighted in last year’s report as a reemerging trend, played a big role in the 2014 results. There were 14 such deals completed in 2014, with an aggregate value of $262.3 billion or 14 percent of the total deal value for the year.
North America was the most active M&A market, racking up nearly $1 trillion in total deal value—an 18 percent increase over 2013. Low interest rates, which helped propel rising valuations, as well as ample corporate and private-equity cash reserves, all fueled deal volume. Private-equity players were both big buyers and big sellers as markets were receptive to both trade sales and IPOs. Psychology also played a role as some companies feared losing opportunities if they did not move—a dangerous development, in our judgment, as similar dynamics helped inflate the 2000 and 2007 M&A bubbles prior to their bursting. Other companies continued to prune nonstrategic operations in order to capture rising asset values.
Asia-Pacific recorded the biggest increase in deal value in 2014 over 2013—a 50 percent jump to almost $330 billion. Megadeals contributed substantially; five megadeals accounted for more than a quarter of the overall value of all Asia-Pacific deals. China was especially active, accounting for 46 percent of total deal value and 30 percent of total deal volume in the Asia-Pacific region in 2014.
Europe and the rest of the world also showed strong growth as improving economies provided corporate and private-equity buyers with the confidence to pursue large transactions on a level not seen in recent years. As elsewhere, the number of megadeals and deal values soared. Strategic priorities included geographic expansion (especially for buyers from outside Europe eyeing prime European assets), the search for scale and growth, and industry consolidation. Activity might have been even higher but geopolitical tensions surrounding Ukraine cooled activity in Eastern Europe.
Three Global Trends
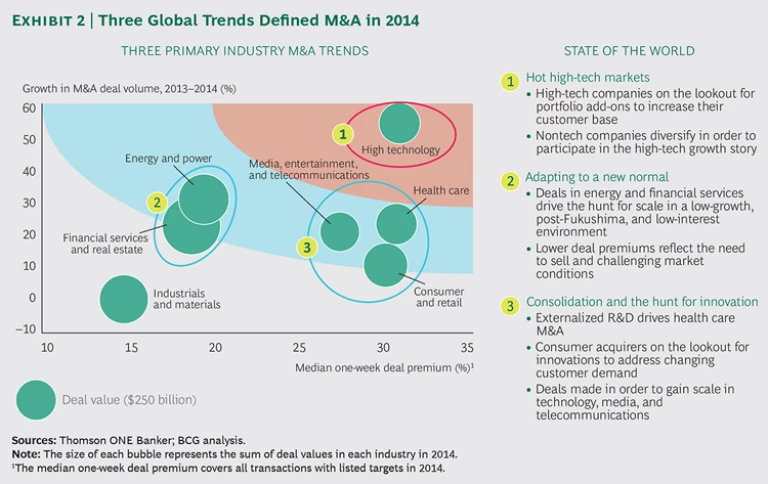
While the increase in deal making was broad based across sectors and industries, three global trends propelled much of the activity: hot high-tech markets, companies seeking to adapt to a “new normal” in their sector or industry, and consolidation along with the hunt for innovation. (See Exhibit 2.)
Hot High-Tech Markets. The superheated high-tech sector saw the largest increase in deal value and the biggest deal premiums. Technology companies are on the lookout for portfolio add-ons to expand their capabilities and customer base, and some nontech companies are seeking diversification in order to participate in the high-tech growth story. Google, for example, completed more than 30 deals in 2014 involving a wide range of technologies—including Nest Labs (which makes in-home HVAC controls) and Skybox Imaging (a satellite-imaging company). Daimler expanded its technology capabilities with the purchase of Intelligent Apps (parent company of mytaxi) and RideScout, which compete with Uber in the fast-growing—and sometimes controversial—ride-sharing business. Takeover premiums as high as 31 percent—on top of already healthy share-price valuations—clearly showed high tech to be the hottest M&A market in 2014, with growth as its common theme.
Adapting to a New Normal. In the energy and financial services sectors, companies are using M&A to adapt to changed environments. The large and sudden fall in oil prices—driven by big increases in world supply and the battle between Persian Gulf producers and nimble new North American shale and fracking companies—has caused a sea change in the industry. Energy companies need to reposition themselves in a new marketplace, defined by oil in the $40- to $70-a-barrel price range, rather than $100 to $120 a barrel. The November 2014 Halliburton–Baker Hughes deal is one example in oil field services. Repsol’s acquisition of Talisman Energy and Encana’s acquisition of Athlon Energy are examples of upstream oil companies expanding their production base.
At the same time, many power companies continue to struggle, post-Fukushima, to find alternatives for their highly profitable nuclear-power business. Two acquisitions valued at more than $1 billion each in Asia point to the rising importance of renewable energy sources. In India, JSW Energy acquired two hydroelectric projects in a $1.6 billion deal. While in China, Wuhan Kaidi Electric Power acquired 87 biomass power stations, five wind-power projects, and three hydroelectric installations for $1.1 billion.
As oil prices have dropped, private-equity firms—which have long been enthusiastic about the energy sector—seem undeterred by mixed results from their energy investments and are becoming increasingly active. We expect deal activity to continue to be strong but premiums to remain muted as they were in 2014. M&A is as much a tool for survival as expansion in the current environment.
A similar shift to changed circumstances is taking place in financial services, thanks to the extended period of low interest rates following the 2008 financial crisis. Banks and other financial-services institutions are using M&A to strategically expand their footprints where they see opportunity. For example, Swedbank acquired Sparbanken Öresund to form Sweden’s largest savings bank. Multiple acquirers in the U.S. snapped up regional banks over the course of 2014. At the same time, big players such as General Electric decided to divest their financial-services operations. While these types of deals fueled the M&A pipeline with volume growth of 31 percent in 2014 over 2013, average acquisition premiums dropped by 19 percent.
Consolidation and the Hunt for Innovation. In health care, consumer goods, and media, entertainment, and telecommunications, many companies are on a hunt for innovation through acquisition, while others seek scale and enhanced market position. Within the pharmaceutical industry, M&A has become a form of what might be called externalized R&D—companies acquiring smaller enterprises with a promising new product or process early in the development stage. At the same time, large-cap players looking to generate sales synergies are acquiring market-ready innovations that are in an advanced state. In August 2014, for example, Roche agreed to acquire InterMune, a biotech company that develops drug treatments for pulmonary and fibrotic diseases, for $8.3 billion. AbbVie’s $21 billion agreement to buy Pharmacyclics, Pfizer’s $17 billion acquisition of Hospira, and Valeant’s $11 billion deal to acquire Salix propelled these trends into 2015 with a full head of steam behind them.
Deals such as these are often big, costly, and complex. But large players need products to feed their global sales networks, and their networks can better market established drugs than the sales networks of the smaller companies that develop the drugs. There is significant upside for the acquirer, despite high prices and premiums.
In the mature and competitive consumer and retail sector, acquirers such as Suntory (which acquired Beam), Tyson Foods (which acquired Hillshire Brands), Anheuser-Busch InBev (which acquired Oriental Brewery) and Dollar Tree (which acquired Family Dollar Stores) clearly believe that buying established brands is both less expensive and more certain than trying to build them, both at home and internationally. Similarly, media and telecom companies such as Charter Communications and Numericable sought scale and market share with bids for Time Warner Cable and Bouygues Telecom, respectively.
The Year That Could Have Been Much Bigger
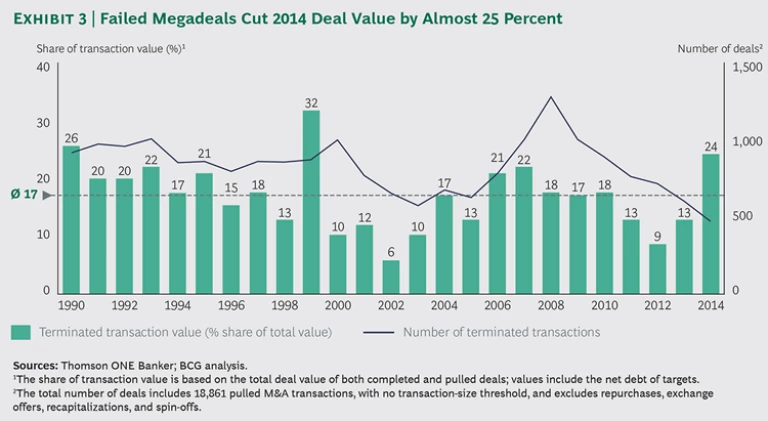
The year 2014 might be remembered as much for the deals that didn’t happen as for those that did. Unsuccessful or terminated takeover attempts reached their highest level since 1999. (See Exhibit 3.) Almost a quarter of announced deal value failed to reach consummation, owing primarily to unsuccessful megadeals, such as 21st Century Fox’s bid for Time Warner Inc. and Pfizer’s offer to acquire AstraZeneca. In fact, three offers aggregating almost $300 billion—some 15 percent of the year’s total deal value—were withdrawn or terminated.
The high failure rate may be rooted in the fact that megadeals are inherently more complex and difficult to complete than smaller transactions. Their size means they often reshape industry landscapes, which can engender both strong opposition from the target’s management and greater scrutiny from regulatory authorities. The managements and boards of both Time Warner Inc. and AstraZeneca refused to be led to the altar. Antitrust concerns were raised by Time Warner Cable’s management in the face of the Charter bid. And the public and political outcry over inversion deals played a big role in the demise of two failed pharmaceutical-industry bids (Pfizer for AstraZeneca and AbbVie for Shire). Meanwhile, many smaller deals moved forward to completion without opposition or objection.
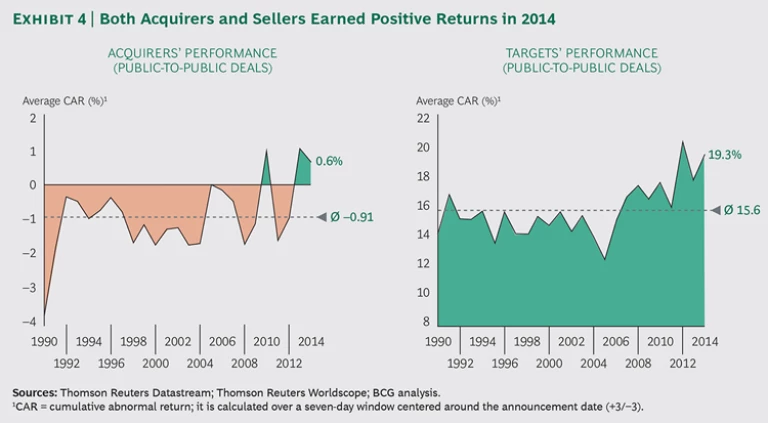
The irony is that, in 2014 at least, investors might well have missed opportunities to profit on both ends of these transactions. With average excess returns of 0.6 percent for acquirers and returns of 19 percent (at announcement) for targets, 2014 was one of those rare years in which M&A resulted in net gains for shareholders of both acquirers and targets. Long-term historical averages show the benefits of M&A accruing heavily to the target company’s shareholders, while the acquirer’s shareholders, more often than not, lose money. (See Exhibit 4.) Last year, we reported that 60 percent of respondents to BCG’s 2014 Investor Survey favored a more aggressive approach to M&A, and investors’ responses to deals since then have borne out their enthusiasm.
Will Deal Volume and Value Continue to Rise?
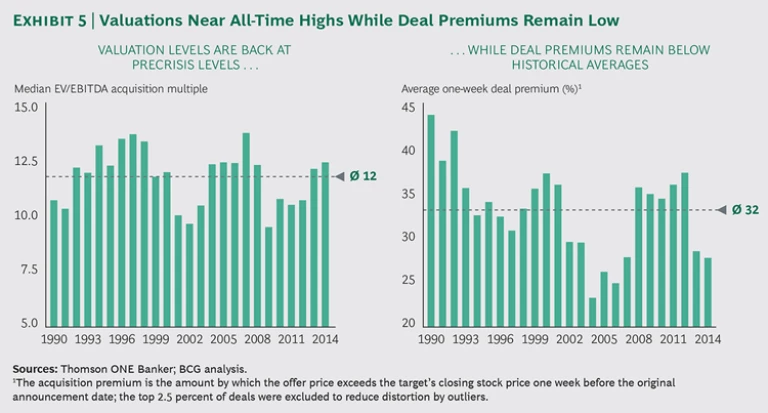
Median enterprise-value-to-EBITDA multiples have been on the increase since 2009. They stood at 12.3 in 2014, above the 25-year average of 12.0, and are closing in on 2007 record territory of 13.7. Acquirers are buying at lofty price levels. At the same time, average takeover premiums of 27.7 percent in 2014 are still about 4 percentage points below their longtime average of 32 percent and well below the mid- to upper-30 percent premiums that have been paid in recent years. This suggests that the current M&A bull market might have additional room to run, although one has to question whether the pace of activity in the first half of 2015 is sustainable. (See Exhibit 5.)
Other factors point to continued strength. Interest rates remain low, credit is readily available, and buyers are willing to borrow. The debt-to-equity levels of the leveraged buyout deals today are similar to those before the financial crisis; the average leveraged buyout in 2014 included 36.9 percent equity, slightly above the 35.6 percent equity in 2013. “Covenant lite” loan activity in 2014 also continued at record levels. The incidence of these loans, which generally do not involve any maintenance covenants, indicates growing investor appetite in the leveraged-loan market, making borrowing even more attractive for private-equity deals.
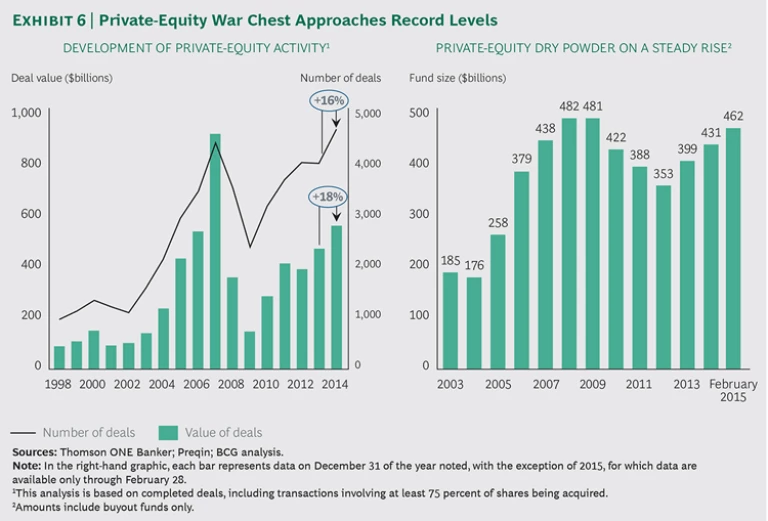
In addition, many market participants have substantial and growing resources that they need to put to work. The number of private-equity deals rose 16 percent in 2014 to a record 4,590, while the value of these transactions jumped 18 percent to almost $550 billion—both big increases compared with the past few years. Private-equity transactions represented almost 20 percent of the total number of M&A deals in 2014, up from 17.5 percent in 2013. Cash available in private-equity funds reached $462 billion in February 2015, an increase of 7 percent over year-end 2013 and approaching record levels. (See Exhibit 6.)
As always, a big challenge for private-equity investors is finding attractive acquisition opportunities. Rising asset valuations cut into potential returns, and corporate owners have become much better in recent years at applying private-equity-like discipline and practices across their operations, leaving less room for new owners to make improvements. That said, as we pointed out last year, divestitures have been on the rise as a means of creating value on both sides of M&A transactions. In industries undergoing transition, such as energy and financial services, the divestitures represented 57 percent and 46 percent, respectively, of all deals in 2014. Private-equity firms are frequent buyers of such assets.
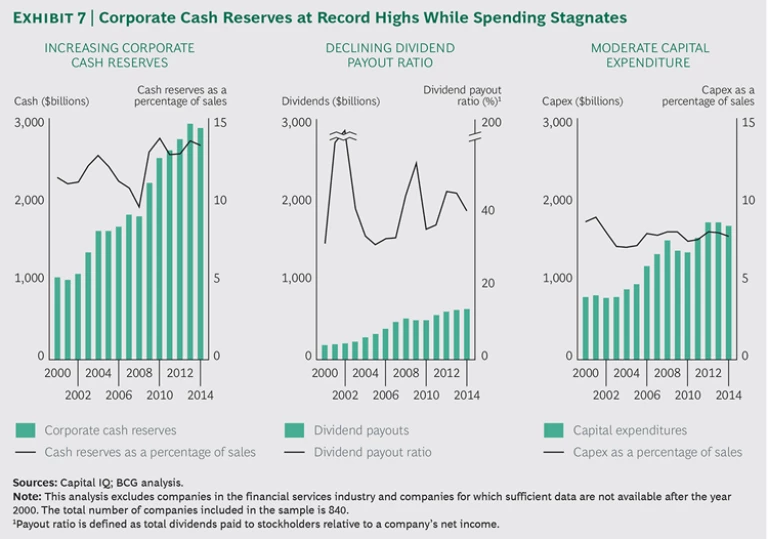
For corporate acquirers, several key indicators would also point to further deal activity. Cash reserves remain at record highs, and public-company investors, like their private-equity counterparts, become impatient when money is not put to productive use. Companies are not raising dividends—both gross payouts and payout ratios have been flat or declining in recent years. Corporate capital expenditures, in both dollar terms and as a percentage of sales, have also plateaued. (See Exhibit 7.) M&A is one of a few remaining strategic alternatives, especially for companies seeking growth.
The search for growth—the subject we explore elsewhere in this year’s report—may be the pivotal imperative. Organic growth is hard to come by when the rates of projected economic expansion are low in most markets and many sectors. This will cause some, perhaps many, managements to cast their eyes externally—toward others in their industries or to adjacent business sectors. This can be a smart strategy. But as we show in the companion articles, acquiring one’s way to growth is a complex undertaking that is by no means assured of achieving its goals. Careful planning, precise execution, and a hard-nosed assessment of the capital markets are all prerequisites for success.
The authors are grateful to Stefanie Siegmund, Alexander Frank, and Eugene Khoo for their insights and their support on the research and content development of this report.
