The expansion of the Panama Canal will be the headline event in shipping in 2016. The $5 billion project promises to reorient the landscape of the logistics industry and alter the decision-making calculus of the shippers that the canal serves.
According to research conducted jointly by The Boston Consulting Group and C.H. Robinson, as much as 10 percent of container traffic between East Asia and the U.S. could shift from West Coast ports to East Coast ports by the year
Small percentages translate into big numbers in container traffic on high-volume lanes between East Asia and the U.S. This trade represents more than 40 percent of containers flowing into the U.S. Rerouting 10 percent of that volume, therefore, is equivalent to building a new port roughly double the size of the ports in Savannah and Charleston.
This shift will have profound effects. The larger ports on the West Coast will experience lower growth rates, altering the competitive balance between West Coast ports and East Coast ports. (With global container flows rising, West Coast ports will still handle more containers than they do today.) It will also shape the investment and routing decisions of rail and truck carriers, magnify the trade-offs that shippers make between the cost and the speed of transportation, and potentially alter the location of distribution centers.
West Coast ports currently receive two-thirds of container flows from East Asia, with much of that cargo moving by rail and truck as far east as the Ohio River Valley, about three-quarters of the way across the U.S. But once the big, efficient
For shipping to many destinations, using West Coast ports will still be the fastest option—but it won’t necessarily be the cheapest. For price-sensitive cargo that is relatively expensive to move, routing shipments through East Coast ports to inland destinations will become more cost competitive and increasingly attractive. (See the sidebar “Unlocking the Logic of the Panama Canal Expansion.”)
Unlocking the Logic of the Panama Canal Expansion
The expansion of the Panama Canal will address two issues of capacity that are hampering the canal’s competitiveness in its second century of operation. First, the volume of cargo that passes through the canal sometimes exceeds the amount for which it was designed, causing traffic jams at peak times.
Second, the canal is too small for the so-called post-Panamax vessels, which carry two to three times as much cargo as the ships that now squeeze through the canal. These new vessels, the length of four U.S. football fields, make up about 16 percent of the global container fleet but carry 45 percent of container cargo. Within 15 years, these vessels will carry nearly two-thirds of global container traffic. They currently travel from Asia to the U.S. West Coast and to Europe through the roomy Suez Canal. Few East Coast ports can currently accept these leviathans.
The Panama Canal expansion will address both capacity issues with a new set of locks and wider, deeper channels, allowing more vessels and larger vessels to travel through the canal. The capacity of the canal will double, and the operating costs of shipping between East Asia and the East Coast could fall by up to 30 percent because the labor and fuel costs per container are lower on these larger vessels. (We assume that carriers will pass along these cost reductions to shippers, since the industry is highly competitive and capacity is abundant.)
To accept the larger vessels, East Coast ports are widening and deepening their channels and installing larger off-loading cranes. At the New York–New Jersey port, a bridge even needs to be raised so these 160-foot-high vessels can reach the docks.
Two maritime battles are under way: one between West Coast and East Coast ports, and the other between the Panama and Suez canals. Two-thirds of container traffic from East Asia currently arrives at West Coast ports, one-fifth travels through the Panama Canal for eastern destinations, and 14 percent reaches the East through the Suez Canal. The East Coast has steadily been gaining ground in container traffic from East Asia; in fact, its share rose from 32 percent in 2010 to 35 percent in 2014.
In the battle between the two canals, the Suez is picking up market share. From 2010 to 2014, the Suez’s share of East Coast container traffic rose from 32 percent to 38 percent. After the Panama Canal expansion, the two canals will be in fierce competition for traffic between East Asia and the East Coast. Passage through the Panama Canal will be faster. But the Suez is also undergoing modernization to allow for faster transit and two-way traffic, even of larger vessels.
In this report, we explain how shippers, carriers, and infrastructure operators (such as ports) need to respond to this shifting logistics environment. Our review, we believe, is the most analytical public study of how the expansion of the Panama Canal will alter the logistics landscape of the
Scenes from the Future
There is no single answer to the question of how much traffic the expanded Panama Canal will divert to East Coast ports. In order to understand the range of possible swings in the share of container traffic from West to East, we conducted extensive “what if” analyses based on differing levels of demand, capacity, and costs.
To establish a baseline, we created two “momentum” scenarios, which assume that economic and shipping trends remain steady through 2020. To isolate the impact of the expansion, one scenario assumes that the canal expands, and the other scenario assumes that it does not.
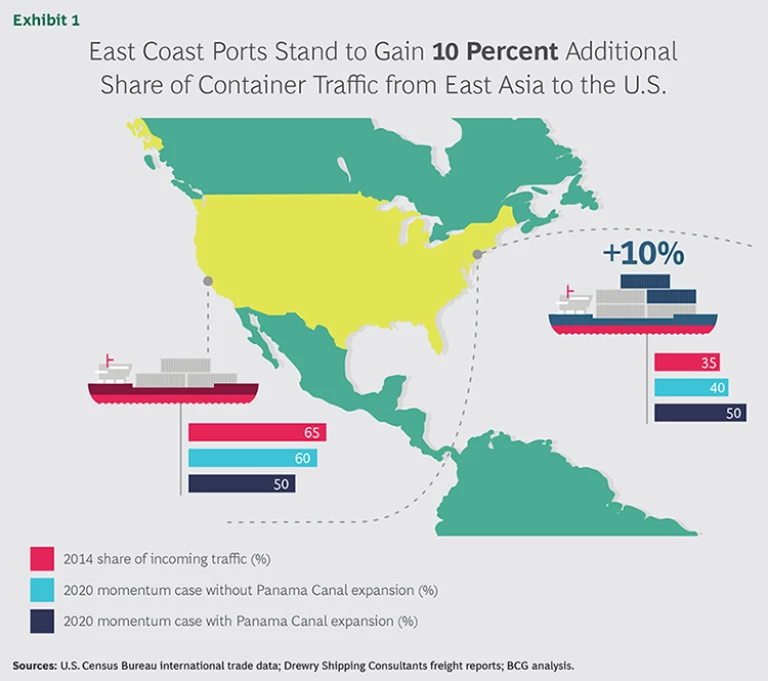
In 2014, about 35 percent of East Asia container traffic docked on the East Coast. Without the canal’s expansion, the current trends of higher growth rates for East Coast ports would push that share to 40 percent. In other words, 40 percent is the 2020 baseline if current economic, energy, and shipping trends remain constant. With the expansion in place, however, the East Coast’s share could reach 50 percent. (See Exhibit 1.)
This 10 percent shift in market share does not result in less container traffic for the West Coast. Under any probable scenario, the West Coast will still receive more traffic from East Asia in 2020 than it does today because in-bound container volume is rising. (See the sidebar “The Method of Our Model.”)
The method of Our Model
The primary purpose of this report is to bring rigorous analysis to the guessing game of how the Panama Canal expansion will alter global cargo flows. From the current baseline of container flows, we forecast the regional demand expected in 2020, considering several scenarios for U.S. economic growth and factoring in origin and destination. We developed estimates of capacity limits for U.S. ports, including their expansion plans, and the rail network. Using linear optimization, we then identified the least expensive way, across the system, to move goods into the U.S. and on to their ultimate destinations, taking into account both capacity constraints and transit times.
The model aggregates origins, destinations, and the major points through which cargo travels, such as ports and major rail routes. It optimizes the lowest cost for all incoming traffic by assigning cargo in big chunks to the primary routes between major origin and destination points. In other words, there could be less expensive ways to ship cargo between point A and point B than suggested by the model, but the overall cost of transportation for all container imports would be higher. Still, the model assumes that container flows will ultimately travel through the least expensive routes in the network.
The model takes into account the underlying energy costs and canal tolls as well as the overall demand assumed in each of the scenarios. Because the model is based on the overall movement of goods into the U.S., it does not predict volumes for individual carriers. It also assumes that current costs evolve in a way that is consistent with historical trends; it does not account for competitive shifts that carriers might make in response to future developments.
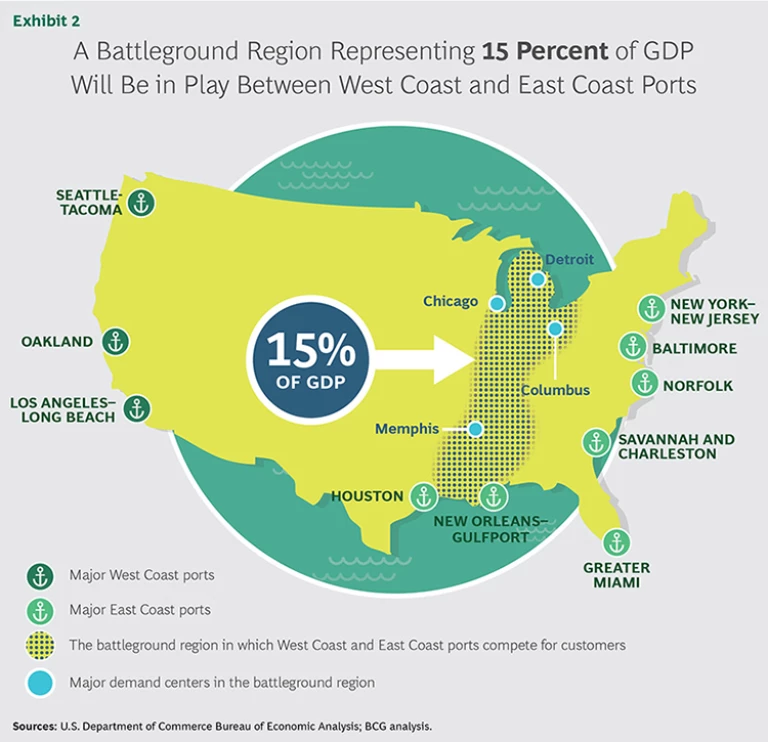
Even so, this shift of up to 10 percent will fundamentally alter supply chains. Notably, the battleground on which U.S. ports compete with one another for customers will likely expand and move several hundred miles west, toward Chicago and Memphis. It will take in other metropolitan areas, such as Detroit and Columbus, and encompass a newly contested region that accounts for more than 15 percent of U.S. GDP. (See Exhibit 2.) In this area, shippers will often be able to route containers through East Coast ports to inland destinations at costs that are either lower or comparable to the costs that they would incur by using West Coast ports.
The momentum cases assume that the future extends in a straight line from the present. To see how much container traffic might swing from West Coast ports to East Coast ports under other conditions, we created four additional scenarios that are plausible yet deliberately provocative. These scenarios are built around alternative projections involving energy prices, economic trends, infrastructure investments, and canal tolls. High energy prices, for example, encourage fuel-efficient water travel and favor East Coast ports. The following summarize the assumptions of each scenario.
U.S. Rebound. The U.S. economy continues to grow at the robust rate exhibited at the end of 2014. Strong import demand drives up wages in China, shifting some manufacturing to Southeast Asia (through the Suez Canal). East Coast ports make sizable investments to accept post-Panamax vessels, while railroads increase their capacity at historical growth rates. Energy costs remain low, discouraging some shippers from routing through the Panama Canal. This scenario results in a 5 percent shift in market share.
Weak Recovery. The U.S. economy returns to the sluggish rate of growth that persisted in the wake of the global financial crisis, upended in part by a sudden surge in energy prices that nonetheless encourages Panama Canal transit. A weak dollar and falling wages strengthen U.S. manufacturing. This scenario also results in a 5 percent shift in market share.
Manufacturing Shift. Rising costs in China shift manufacturing to Southeast Asia and to the U.S., notably the southeastern region. Rail and port investments continue at historical or announced rates. Canal toll increases are modest. Growth in imports from Southeast Asia sends more traffic through the Suez Canal, while an increase in manufacturing in the southeastern region of the U.S. increases demand there (as a result of job growth and the need for manufacturing inputs), moving more container traffic through the Panama Canal. This scenario results in a 10 percent shift in market share.
Overbuilding. In anticipation of the Panama Canal expansion, ports and railroads invest heavily in extra capacity. But a weak economy reduces demand for imports, and moderate energy prices and high canal tolls limit the diversion of traffic from the West Coast to the East. This results in no shift in market share whatsoever.
Ports of Call
Ports up and down the East and West coasts are jockeying for position in a post-expansion world. The three major West Coast port clusters—Los Angeles–Long Beach, Oakland, and Seattle-Tacoma—already have the deep channels and jumbo cranes needed to handle post-Panamax vessels. But these ports, especially the Los Angeles–Long Beach complex, are also at the greatest risk of losing market share to East Coast ports. East Coast ports, on the other hand, are largely competing with one another to prepare their ports to win new post-Panamax business.
We modeled projected container traffic—arriving from all over the world, not just East Asia—at major ports along both coasts, factoring in port expansion plans, distances from major consumption centers, and the cost of land transportation routes to those centers. All ports will gain traffic, but market share will bounce around. Most notably, the Los Angeles–Long Beach complex will likely experience growth at an average rate of 5 to 10 percent per year through 2020, compared with double-digit growth rates at some East Coast ports. The question for East Coast ports is whether they will gain sufficient traffic to justify their investments. For example, the port of Savannah is investing more than $1.4 billion, and the port of Miami is investing $2 billion, in infrastructure improvements.
As the saying goes, the three most important things in real estate are “location, location, location.” The same is true of ports. The model anticipates that the ports best suited to win new traffic will be those that are closest to the battleground region and that have the best and least-congested rail and trucking routes for getting there. The model suggests the emergence of three classifications of ports.
Advantaged. The New York–New Jersey port and the southeastern ports of Norfolk, Savannah, and Charleston all stand to gain share by virtue of their relative proximity to the battleground region and the attractive rail routes to major markets. As the East Coast’s largest ports, they are in a strong position to be on the routes of the post-Panamax vessels, which tend to make fewer and longer stops than smaller vessels.
Houston and the New Orleans–Gulfport complex, while not major container ports today, should also grow as they benefit from upgrades and from being able to serve the fast-growing greater Gulf Coast region.
Neutral or Unclear. The remaining major East Coast ports, notably Baltimore and Miami, will likely experience traffic levels similar to those that would occur without the expansion. In most cases, these ports serve regional markets and will be unlikely to receive large volumes of cargo headed to the battleground region.
We expect the Baltimore and Norfolk ports to compete actively for mid-Atlantic regional traffic. Miami serves a region that is otherwise costly to reach from other ports. All three ports may need to broaden their appeal to a wider set of shippers, outside the region, for their investments to pay off.
On the West Coast, Oakland and the Seattle-Tacoma cluster will likely hold their own in most scenarios. The Oakland port has a strong local market in the Bay Area, and Seattle-Tacoma is generally the best complex to serve the Pacific Northwest, playing a unique role in providing access to the upper Midwest via rail.
Disadvantaged. The Los Angeles–Long Beach complex continues to be well positioned to handle traffic to major population centers and will always be the fastest option for reaching a large share of the U.S. But the port will face new competition in the region east of Chicago once the Panama Canal is able to handle post-Panamax vessels.
The recent labor dispute at this complex also may motivate shippers to reduce their dependence on the West Coast. It remains to be seen whether shippers will fundamentally change their routing decisions to minimize disruptions when the next labor contract is set to expire.
A few caveats are in order. First, these projections are based only on the cost of shipping. How efficiently a port is able to unload and move cargo can make a big difference in a shipper’s decision. Overall shipping time (including land transportation), flexibility, and reliability matter, too.
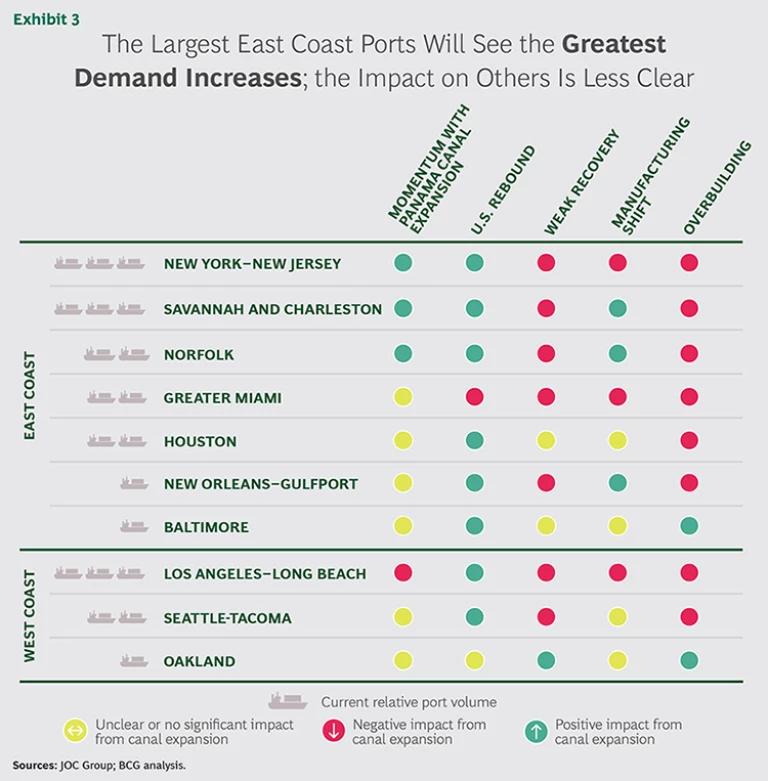
Second, port traffic also depends on which of the four scenarios proves to be most accurate. The New York–New Jersey port does best under the momentum and U.S. rebound scenarios but not as well under the weak-recovery, manufacturing-shift, and overbuilding scenarios. The Los Angeles–Long Beach complex also does best under the U.S. rebound scenario. (See Exhibit 3.)
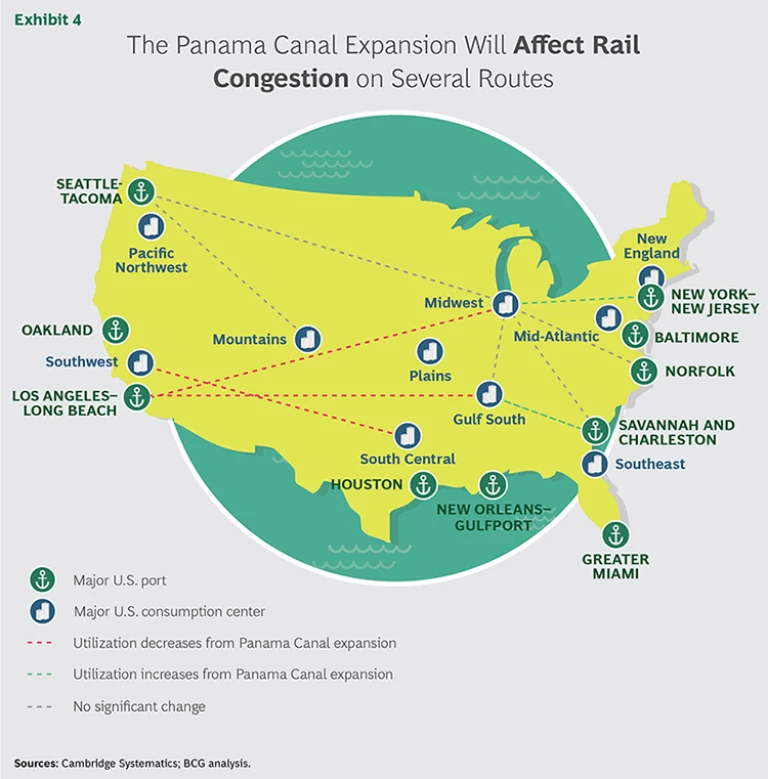
Third, these projections assume that railroads and trucking companies change prices only in line with historical trends, or at least do not dramatically change the relative costs among shipping lanes. In reality, some railroads and trucking companies may use price to attract volume on their most important lanes. Further, some truck and rail corridors may be unable to handle future traffic, while others may have extra capacity—factors that could affect transit times and shippers’ decisions. (See Exhibit 4.)
The Cost, Time, and Flexibility Trade-Offs
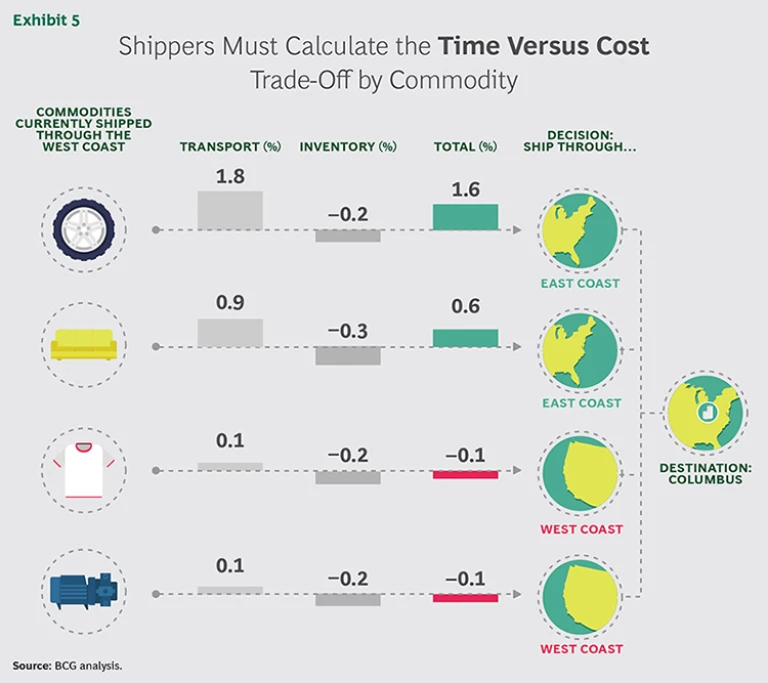
So far, we have treated all cargo as though it were equal, but it is not. Shippers will make different choices based on the value of their cargo, transportation costs, transit time, and flexibility. To understand these trade-offs, we analyzed four products—tires, couches, tee shirts, and industrial pumps—that would be shipped from East Asia to the battleground market of Columbus. We picked those products because they are broadly representative of the range of goods in the four top
If cost were all that mattered, shippers would route all these products through an expanded Panama Canal to reach Columbus via rail from the New York–New Jersey port. At current market rates, that route would be about 4 percent cheaper than one going through Oakland. But it also would take 11 days longer.
That time difference affects shippers in two ways. First, the amount of inventory in transit will increase. Second, to avoid running out of in-demand products, the shipper will need to stock more inventory as a buffer to account for unpredictable demand during those 11 days.
For some shippers, the 4 percent savings is pivotal. But for others, the extra time matters more.
When you do the math for these four products, the savings gained by transporting tires and couches to the battleground region through the Panama Canal are large enough to more than make up for the extra inventory that shippers will need to
carry. (See the sidebar “Do the Math.”)
Do the Math
Pumps and tee-shirts have very little in common other than the fact that they will most likely continue to move through U.S. West Coast ports to reach the battleground states, in which U.S. ports compete with one another for customers, after the expansion of the Panama Canal. For both products, transportation constitutes up to 3 percent of revenues at most, so shippers often do not believe that there will be significant savings or that the savings from alternative routes will outweigh the increases in transit time and managerial complexity. By routing a shipment of tee shirts through the East Coast to Columbus, Ohio, for example, a retailer’s savings would total just 0.13 percent, and it would be half that for pumps. Not surprisingly, the cost of the extra inventory that retailers or distributors would need to carry exceeds these savings.
Shippers of both products also do not want inventory in transit any longer than necessary—though for very different reasons. Since tee shirts often feature trendy colors or the logos of winning sports teams, retailers want shorter lead times and low inventory levels in order to keep up with changes in fashion and avoid obsolescence. Pump makers, on the other hand, accept higher inventory levels because having inventory in warehouses, not on ships, allows them to take advantage of every opportunity to make sales. For both products, careful planning of inventory levels is required.
Tires and couches, however, are much more expensive to ship to the U.S. from East Asia, so the calculations work out differently. Transportation makes up 44 percent of the cost of goods sold for tires and 23 percent for couches. Even though the cost of holding extra inventory is higher for these products than for pumps and tee shirts, the savings of routing through the East Coast to the battleground region more than makes up the difference. In fact, by transporting tires to Columbus by way of the East Coast, shippers can expect to save about 1.5 percent—a big number for a low-margin product.
But the analysis works out the opposite way for tee shirts and pumps. The time advantage of shipping through the West Coast trumps the cost savings of East Coast travel. (See Exhibit 5.)
All shippers will need to conduct similar exercises for their product portfolios, assessing the relative importance of minimizing shipping costs, maximizing time to market, and properly gauging inventory levels.
The Full Picture
Our projections of cargo flows are the product of an economic model that simplifies reality, as all models do. Several other factors could alter traffic through an expanded Panama Canal. Three developments, in particular, would likely magnify the shift in volume through the Panama Canal to U.S. East Coast ports.
- A proposed canal through Nicaragua could eventually be built, if financing and other issues are resolved, providing an additional route for shippers to reach the East Coast.
- Carriers could increase their use of transshipment and make a stop in the Caribbean to off-load containers, a move that could favor smaller U.S. and South American ports.
- The use of liquefied natural gas as bunker fuel for ocean vessels could substantially reduce transportation costs.
The impact of most of the other potential developments, however, is unclear.
- Ocean and rail carriers could alter their schedules, creating changes in both the transit time and the costs of using specific shipping lanes.
- Labor relations could affect the cost and reliability of water routes terminating at ports on either coast.
- A shortage of drivers could affect the cost and reliability of trucking routes.
- Foreign exchange movements and macroeconomic policy could alter the costs of carrying inventory and the choice of manufacturing locations.
- The evolution of e-commerce—such as the rise in demand for same-day delivery—could alter the strategies of a wide variety of logistics providers.
Several of the potential influences, such as the proposed Nicaraguan canal and the use of liquefied natural gas for bunker fuel, take place over the long term. Some, such as currency movements, are unpredictable. Others, such as the shortage of truck drivers, are correctable, while still others are episodic: labor unrest occurs about every six years in the West Coast ports during contract negotiations.
We are not discounting these influences, but we do not think that they will severely tilt the playing field in the next few years.
Time to Act
The uncertainty surrounding the expansion of the Panama Canal has caused many shippers and carriers to take a wait-and-see approach, operating under the misguided notion that taking action now would be premature because the outcome is unpredictable. But the uncertainty surrounds only the size of the shift in ocean traffic from west to east. There almost certainly will be a shift in the mix of West Coast versus East Coast traffic as well, and shippers and carriers should start preparing for that shift now.
Shippers. With the expansion of the Panama Canal, shippers will enjoy greater options but also face greater complexity. Companies accustomed to shipping to the West Coast and relying on relatively fast rail service to reach much of the U.S. are likely to then take a much more segmented and dynamic approach. When time is of the essence, as it is for some products, that routing may continue to make sense. But for other products, the cost savings of shipping through the Panama Canal will likely outweigh the extra time in transit.
Shippers need to do the analysis. There is no shortcut. The exercise might show that it makes sense to open or expand East Coast distribution centers. It almost certainly will show the need to partner with a new or expanded set of ocean and land carriers and logistics service providers (LSPs).
Carriers. Carriers have a series of interrelated decisions to make in preparation for the expansion of the Panama Canal. These decisions will revolve around investments, pricing, routing, and customer development. If they haven’t already done so, many ocean and rail carriers will need to make investments in terminals at the East Coast ports that are most likely to gain traffic. Ocean carriers will likely need to consider longer-term moves, such as revising their schedules and experimenting with scheduling innovations—for example, more “south first” services versus those that have New York–New Jersey as the default first stop on the East Coast.
Railroads may need to alter their investment plans to accommodate greater traffic, but only in particular locations. They will need to develop relationships with new customers to serve the inland markets that the expansion will open.
On the West Coast, carriers might need to offer selective discounts to hold on to traffic. But they will need to do so wisely: a large chunk of time-sensitive cargo will probably continue to move through the West Coast with or without discounts.
Similar to East Coast railroads, trucking companies will have opportunities to win new customers and serve new markets. But they will need to ensure that they have business development activities in place and an adequate supply of drivers for new routes. In light of the shortage of long-haul drivers, becoming an employer of choice is critical. Fortunately, some of the expected growth in volume will occur on routes that are more attractive than others to drivers.
LSPs. These companies can help both carriers and shippers sort through their options. Some LSPs operate assets, such as warehouses, and will want to invest in locations that are well positioned to meet growing demand. Those that are not asset-based will still need to make investments in customer development, supplier relationships, and analytical tools. With energy costs, canal tolls, and other influences in flux, LSPs have an opportunity to serve customers that want to reduce logistics costs or even outsource routing decisions.
The widening of the Panama Canal underscores the growing complexity of the world of logistics. Shippers and carriers need to confront that complexity in their strategies and operations. For most players, “analyze and act” makes a lot more sense than “wait and see.”
