This is the second in a series of articles published in advance of The Boston Consulting Group’s 2015 Value Creators report. In March 2015, we reported on the slowing but still strong performance of global equity markets in 2014. In June 2015, we will publish the full report, including detailed rankings of the top performers worldwide and in 26 industries for the five-year period from 2010 through 2014.
Global equity markets continued to deliver positive returns in 2014, but investors appear to be preparing for a soft landing, with below-average total shareholder return[--Total shareholder return measures the combination of share price gains and dividend yield for a company’s stock over a given period of time. It is the most comprehensive metric for measuring a company’s shareholder-value-creation performance
In early 2015, BCG—in collaboration with Thomson Reuters, the world’s leading provider of business and financial information— surveyed more than 700 portfolio managers and buy-side and sell-side analysts. The survey is the seventh that BCG has conducted annually since 2009 to understand investors’ views on the global economic environment and priorities for business value creation. Our new partnership with Thomson Reuters has allowed us to expand the number of respondents to our survey by more than fourfold and to attract a more global sample, with respondents covering a broad cross-section of global equity markets. In particular, the percentage of respondents who primarily follow Asian markets has more than doubled—from 6 in 2014 to 14 in 2015.
Five main themes stand out in this year’s findings:
-
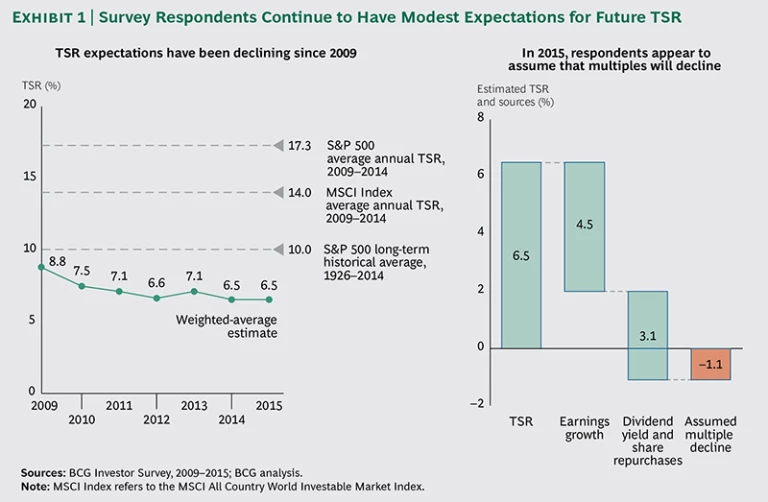
Consistently Modest Investor Expectations for Future TSR. Respondents to our survey have quite modest expectations for future TSR: 6.5 percent, on average, which is considerably below the long-term historical average of 10 percent. This has been a consistent trend in our survey, even though actual TSR performance has been above average in recent years.
-
Continuing Concerns That Equity Markets May Be Overvalued. One possible reason for these modest expectations is that about one-third of respondents believe that valuations have outpaced fundamentals. And, on the basis of their estimates for future earnings growth, dividend yields, share repurchases, and average TSR, survey respondents appear to be assuming a decline in average valuation multiples.
-
A Belief That Markets May Achieve a “Soft Landing.” What at first glance may seem to be a pessimistic outlook, however, is balanced by a small but noticeable increase in bullishness on the part of these investors—an indication, perhaps, that they see global equity markets achieving a “soft landing” and entering a new period of stability after the intense volatility of the years immediately following the 2008 global financial crisis.
-
A Renewed Focus on Fundamentals. These investors also want companies to go back to the basics: focusing on fundamentals in order to spur growth in a relatively low-growth economic environment, managing free cash flow carefully, and allocating it intelligently. In particular, these investors seem to be increasingly dissatisfied with companies that aggressively buy back shares at a time when the market may be at or near its peak.
- The Growing Importance of Value Management Capabilities. A renewed focus on fundamentals is also heightening investor scrutiny of companies’ core management processes. These investors want to see companies do a better job of aligning their business, financial, and investor strategies, as well as strengthening their capabilities in value management, strategic planning, risk management, and other critical areas.
Consistently Modest Expectations
Despite the fact that equity markets have delivered double-digit returns since 2009, the respondents to our annual survey have been remarkably consistent in having quite modest expectations for future TSR. Every year, we ask investors to estimate average annual TSR over the next three years, as well as the underlying rate of earnings growth and dividend and share-repurchase yields. In 2015, the average estimate of future TSR was 6.5 percent—the exact same as in 2014. (See Exhibit 1.) Fewer than 1 in 10 respondents estimated that future TSR would be above the long-term historical average of 10 percent.
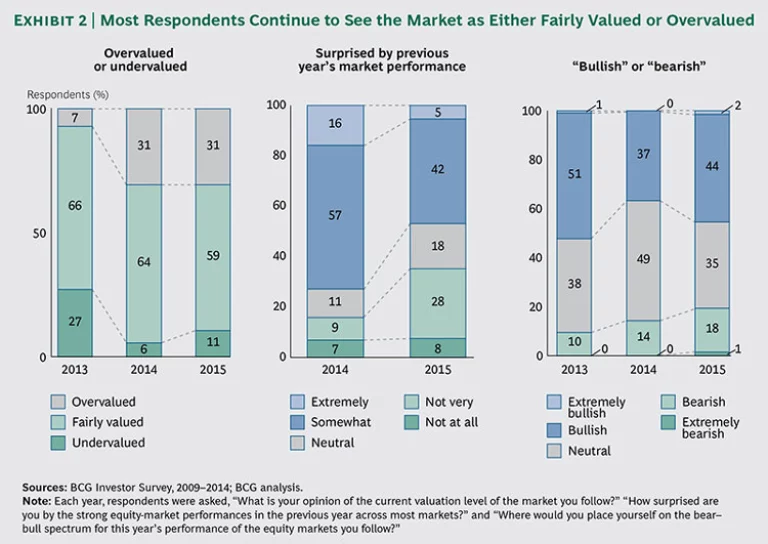
What explains these relatively low expectations for future TSR? As the right-hand chart in Exhibit 1 shows, they partly reflect equally modest expectations for future earnings growth (4.5 percent). What’s more, the combination of respondents’ expectations for earnings growth and for the future yield from dividends and share repurchases suggests that these investors are also assuming a decline in valuation multiples, which contributes to their low TSR expectations. This view is reinforced by the fact that a substantial portion of respondents think that markets are currently overvalued. Although a majority (59 percent) see the equity market that they follow as fairly valued, nearly one-third (31 percent) view it as overvalued—the identical percentage that did so last year. (See Exhibit 2.) There are some important regional variations on this issue. Among those respondents who mainly follow the S&P 500, the FTSE 100, or the Euronext 100, the percentage who find these markets overvalued is even higher— between 35 and 38. By contrast, concerns about overvaluation among respondents who follow Asian markets such as the Hang Seng Index or the Nikkei 225 are considerably lower (9 percent and 16 percent, respectively). The larger number of Asian respondents in this year’s sample also explains why the average percentage of respondents who think their market is undervalued has nearly doubled—from 6 in 2014 to 11 in 2015.
Anticipating a Soft Landing?
And yet, despite concerns about possible overvaluation, these investors do not seem to be anticipating a major drop in market values. Rather, they appear to be anticipating something more in the nature of a soft landing, with lower but still positive levels of TSR. Although many respondents believe that markets are near their peak, they are not particularly surprised at how well markets performed in 2014. The middle chart in Exhibit 2 shows that whereas 73 percent of respondents in 2014 were either somewhat surprised or extremely surprised by the previous year’s market performance, in 2015 that share dropped to less than half (47 percent). The expectation of a soft landing may also explain why, despite worries about overvaluation, nearly half of respondents (46 percent) are either “bullish” or “extremely bullish” about future market prospects—up from 37 percent one year ago. To a degree, this increased bullishness reflects the greater representation of investors focusing on non-U.S. equity markets in this year’s survey. Only 44 percent of investors focusing on U.S. equity markets are either bullish or extremely bullish, whereas 53 percent of investors covering Asian markets and 57 percent following European markets are. But it’s also plausible that this increased bullishness in 2015 reflects investor optimism that equity markets are finding a new equilibrium after the intense volatility in the years immediately following the 2008 financial crisis.
Back to Basics
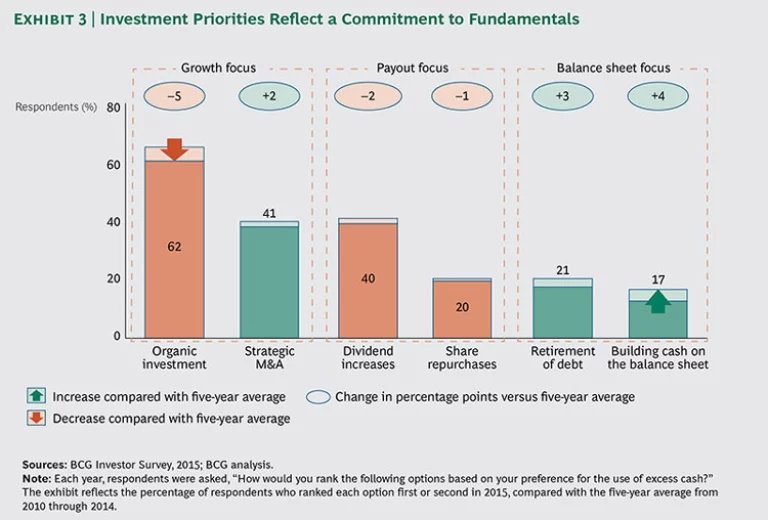
If these investors expect a market environment of modest earnings growth, gradual decline in valuation multiples, and below-average TSR, then how do they think companies should respond? One indication comes from the investors’ preferences for how companies should use their excess cash. (See Exhibit 3.) It is useful to divide the responses into three clusters. “Organic investment” remains, by far, the top priority, chosen either first or second by 62 percent of respondents. This result is somewhat below the five-year average result but still considerably ahead of other options. Next come strategic M&A (41 percent) and dividend increases (40 percent). Finally, share repurchases (20 percent), debt retirement (21 percent), and building cash on the balance sheet (17 percent) bring up the rear—although the proportion of respondents listing the final two as a top priority is 3 and 4 percentage points, respectively, above the five-year average for our survey.
We take these findings as an indication of a “back to basics” trend in an environment where markets are experiencing a soft landing and where there will be more pressure on valuation multiples. On the one hand, respondents continue to want companies to find ways to grow profitably in what is, by historical standards, a relatively low-growth economic environment. This view is confirmed by the answers to a subsequent question in our survey asking respondents where they think companies should focus their internal investments. The top choice for more aggressive investment, chosen by a full 86 percent of respondents, was R&D—with 33 percent saying they “strongly agree.”
On the other hand, this focus on fundamentals is combined with a recognition that, in a period when companies can no longer rely on multiple expansion to deliver superior TSR, it will be critical for them to carefully manage their free cash flow and allocate resources intelligently. In particular, many of the respondents to this year’s survey are opposed to the recent wave of share buybacks. Nearly half (47 percent) said that they were “not satisfied” with the buyback policies of the companies they invest in—up 17 percentage points from 2014. This finding makes sense, given that the recent wave of buybacks has taken place at a time when market valuations have been relatively high; in other words, instead of “buying low and selling high,” companies are doing precisely the opposite.
Fine-Tuning Management Processes
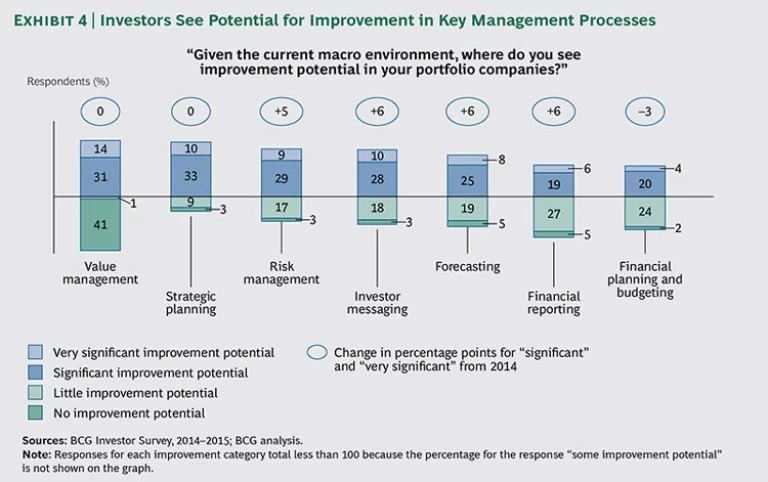
Finding the sweet spot between managing free cash flow and allocating financial capital and managerial talent in a way that continues to grow earnings and defends the valuation multiple won’t be easy. There are indications in this year’s survey that respondents are paying special attention to the quality of a company’s management processes in getting the balance right. Every year, nearly two-thirds of our respondents say that the business, financial, and investor strategies of the companies they invest in are only partly or even poorly aligned. This year was no different: 61 percent think so. Nearly half of respondents (45 percent) also said that there were either significant or very significant opportunities for improvement in value management at their portfolio companies, and 43 percent said the same for strategic planning. (See Exhibit 4.)
These findings are similar to those in past BCG investor surveys. But what is especially striking this year is how many more respondents also see room for improvement in other core management processes, including risk management (38 percent), investor messaging (38 percent), forecasting (33 percent), and, to a lesser degree, financial reporting (25 percent). The share of respondents seeing either significant or very significant room for improvement in these areas is between 5 and 6 percentage points higher than in 2014.
Looking Ahead
We believe that as companies look toward the future, four steps are especially important in defining their value-creation strategy:
-
Take a balanced approach to value creation. If the findings of our 2015 survey are any indication, companies in the future won’t be able to continue relying on increasing valuation multiples to hit their TSR targets. Now more than ever, companies need to take a balanced approach to value creation based on a detailed understanding of what the chief drivers of TSR will be. Have you conducted analysis to understand how much TSR and what share price and valuation multiple your current business plans will deliver? Are they enough to beat the expectations of your board and your investors? What are the respective roles of earnings growth, margin improvement, dividend yield, and share repurchases in your TSR plan?
-
Understand the factors causing differences in valuation multiples. In order to combat multiple decline, a company also needs to understand what has caused differences in valuation multiples in its peer group. In our experience, roughly 80 percent of the factors that lead to differences in valuation multiples among similar companies can be identified and managed.
-
Develop a disciplined approach to cash payout. A company’s dividend and share buyback policies are too important to be merely an afterthought. Dividend policy, in particular, can help stabilize a company’s valuation multiple in a low-yield environment where there is likely to be downward pressure on valuation multiples and less investor support for buybacks. But before increasing dividends, companies must be sure that they can sustain the cash payout, even in a situation where growth turns out to be significantly weaker than analysts expect.
- Upgrade core management processes. Companies also need to do more to improve the consistency of their business, financial, and investor strategies. To this end, they should revisit core management processes such as target setting, budgeting, resource allocation, performance management, risk management, and incentives to ensure that they reflect the company’s value-creation agenda.
We will expand our consideration of these and related topics in our next annual Value Creators report, which will be published in June 2015.


