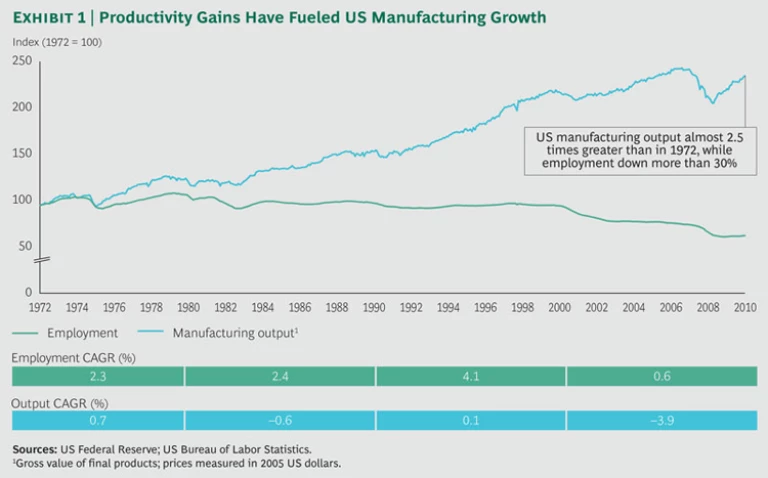
Productivity growth—output growth that exceeds the growth of the workforce and capital employed—has been the lifeblood of the US manufacturing sector for much of the recent past. From 1972 through 2010, the sector’s output more than doubled, while its workforce decreased by more than 30%. (See Exhibit 1.) These steady gains in productivity have been a major factor in the renaissance of US manufacturing. (See The Shifting Economics of Global Manufacturing: How Cost Competitiveness Is Changing Worldwide , BCG report, August 2014.)
However, the past decade has seen the emergence of an alarming macroeconomic trend. The US has struggled to improve productivity, which has increased at a tepid pace of 0.7% over the past ten years. Among leading manufacturers, the productivity gap between the US and other countries has widened over the past five years. Most strikingly, the US has fallen behind both Japan and Germany in total-factor productivity growth and is now in the middle of the pack among major manufacturing nations. If this downward trend persists, it could undermine the foundation of US competitiveness over the long term.
At the leadership level, executives of US manufacturers clearly recognize the importance of productivity. In a recent BCG study, more than 90% of the executives surveyed cited productivity as one of their top five most important corporate initiatives. It is easy to understand why. Companies with top-quartile productivity growth achieve five times higher total shareholder returns than bottom-quartile companies, according to a BCG analysis. Even so, surveyed executives showed a lack of urgency about implementing productivity changes. Their responses indicated that they rely too much on traditional improvement levers and are not sufficiently rigorous in managing their improvement programs. As a result, they fail to maximize the impact of their efforts.
We believe that US manufacturers’ current approach to productivity is not sustainable. Indeed, it is imperative for these companies to achieve a step-change increase in productivity and then maintain productivity growth through continuous improvement. And they must act now. Leaders should be bold: success means achieving step-change productivity gains of more than 15% to 20% in key cost areas, not eking out advances of 1% to 2% each year. In many manufacturing industries, such large productivity gains will tip competitiveness from low-cost countries back to the United States and create a virtuous cycle that allows US companies to further invest in top-line growth.
On the basis of BCG’s experience and our study of productivity trends in US manufacturing, we believe that setting an ambitious goal for productivity improvement is critical to maintaining competitiveness. (See the sidebar “An Innovative Way to Measure Corporate Productivity.”) Manufacturers can achieve this goal through the disciplined application of a comprehensive set of productivity levers that attack all the underlying drivers of cost. Essential to this approach is the use of new digital and analytic tools that can help manufacturers reach continually higher levels of productivity. In our experience, a best-in-class productivity program can generate a 3-percentage point to 6-percentage-point increase in earnings before interest and taxes (EBIT).
AN INNOVATIVE WAY TO MEASURE CORPORATE PRODUCTIVITY
To analyze productivity at the company level, we developed a corporate productivity metric that can be derived from publicly available financial and operational data. We define productivity growth as the percentage change in the ratio of two factors:
- Company value added, defined as the difference between revenue and the cost of direct and indirect materials and components
- The sum of labor cost plus the annualized cost of capital employed
To provide the input for the analysis, we drew upon data derived from Capital IQ data and analyst reports. The data set covers approximately 700 publicly listed US manufacturers with annual revenue greater than $500 million. We also applied the data to identify trends in growth and TSR and to forecast future growth.
Why Are Productivity Gains Imperative?
Revenue growth has historically been the largest driver of value creation for manufacturers, accounting for 70% of total TSR for top-quartile performers over a ten-year period. However, the world has shifted to a low-growth environment. For US manufacturers, median growth expectations for the next five years are 40% below historical averages.
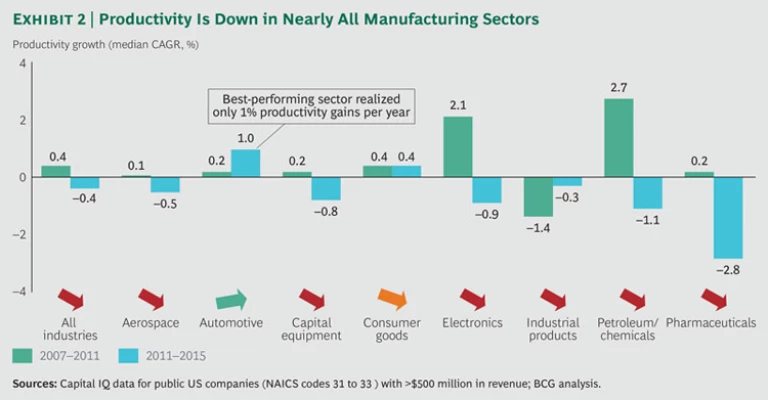
Lower expectations for revenue growth have elevated the importance of productivity gains as a means of value creation. Productivity growth is the main lever for margin expansion, which has been the second most important contributor to TSR for top performers. However, productivity growth has slowed and companies are struggling to achieve significant improvements. For US manufacturers, average productivity grew at a rate of only 0.4% from 2007 through 2011 before falling to −0.4% from 2011 through 2015. Indeed, productivity is trending downward in nearly every US manufacturing sector. (See Exhibit 2.) The sharpest decline was experienced by the pharmaceuticals sector, where the median productivity growth rate (CAGR) was −2.8%. Only the automotive sector saw positive growth, but at a mere 1% per year. Given that most executives we surveyed across sectors expect productivity to improve at 2% to 3% per year, the results of their current improvement efforts remain well below expectations.
While productivity growth is critical to value creation in a low-growth economic environment, it is important to recognize the clear linkage between economic growth and productivity growth. The downward trend in labor productivity has occurred during a period of sluggish economic growth, with real GDP averaging only 2.2% annually since the 2009 recession. In 2016, real GDP is forecast to be 1.6%. In our view, the simultaneous downshift in productivity growth and economic growth is not a coincidence. Productivity, after all, is defined as output per unit of labor and capital employed, so it should come as no surprise that weak output growth is holding back productivity growth. If our view is correct, stronger economic growth could be a factor in improving productivity, and vice versa.
What Underlies the Downward Trend?
Our experience and study of productivity trends point to two underlying causes of the downward trend in productivity growth.
An Emphasis on Traditional Levers. Companies focus on applying the traditional productivity levers they are most familiar with, rather than also utilizing primarily cross-functional levers. By doing more of the same, companies are promoting diminished returns. Both types of levers must be applied to drive step-change productivity gains.
In our survey of leading US manufacturers, we presented nearly 200 CEOs and executives at the director level and above with a list of ten traditional and primarily cross-functional productivity improvement levers. (See the sidebar “Ten Levers for Improving Productivity.”) For each lever, we asked our respondents to rank their company’s performance relative to peers and tell us whether they consider the lever to be a top-three priority.
Ten Levers for Improving Productivity
In our survey, executives ranked their company’s performance as highest for six traditional productivity improvement levers. Not surprisingly, these levers were also among their top priorities.
- Working Capital Reduction. This lever improves the management of inventory, accounts receivable, and accounts payable. Optimization enables reductions in the cash conversion cycle and inventory carrying costs.
- Lean Manufacturing. Companies apply lean principles to eliminate waste in the manufacturing process. Production is “pulled” on the basis of customer demand, with all steps of the manufacturing process tracked and monitored against standardized procedures and metrics.
- R&D Efficiency. This lever improves the output of the R&D project portfolio and the integration of business units and R&D functions. The objectives are to identify clear return-on-investment targets for R&D projects and establish linkages to business strategy and customer value. Low-performing R&D projects are removed from the pipeline.
- Supply Chain Optimization. Companies can use the supply chain as a source of strength and competitive advantage. Key sublevers include network optimization and lead-time management, sales and operations planning, and a distribution strategy designed for efficiency, agility, and responsiveness.
- Procurement. This lever optimizes a company’s direct and indirect spending by pulling sublevers such as best-cost country sourcing, demand management, and bundling.
- Pricing and Incentives. Companies improve the targeting and execution of their pricing policy, such as through dynamic pricing. These improvements enable them to maximize long-term profits on the basis of market conditions and product life-cycle analysis.
Executives had less familiarity with, and lower expectations for, four primarily cross-functional levers:
- Design to Value. This lever is a cross-functional development process that translates top-level strategy into design choices for products and services as well as the underlying processes along the supply chain. In a repeatable and rigorously implemented process, stakeholders from multiple functions—including engineering, production, procurement, and sales and marketing—apply the lens of customer value to evaluate costs and competing designs.
- Organizational Efficiency. Companies capture productivity gains through the optimization of management and corporate support functions. Sublevers include digitizing business process, optimizing management spans of control, and using shared services to capture the benefits of centralization and scale. While each functional and business leader has responsibility for his or her organization, a coordinated, cross-functional approach is required to capture full value.
- Complexity Reduction. To reduce complexity in the product portfolio, cross-functional teams explore ways to optimize the tradeoff between the value of product variations and the cost of complexity. They align the product portfolio with customer value by rationalizing stock-keeping units and reducing component-level complexity.
- Industry 4.0. Advanced technologies—including robotics, additive manufacturing, and the Industrial Internet of Things—are enabling step-change improvements in manufacturing productivity. To realize the benefits, companies must identify and implement use cases across the organization.
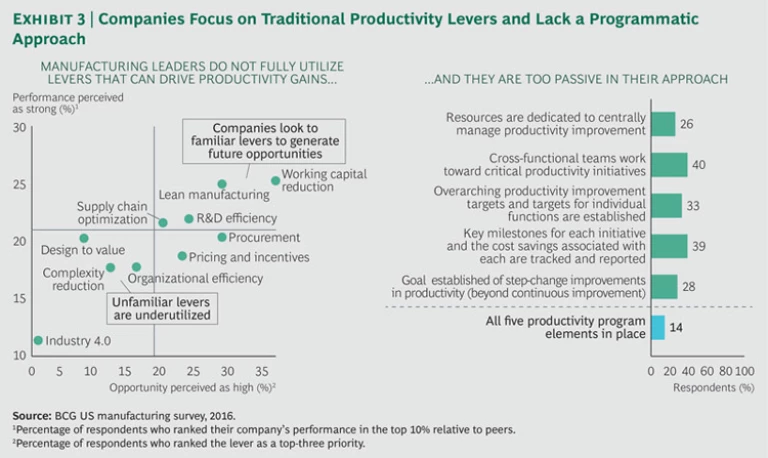
For four of the six traditional levers—working capital reduction, lean manufacturing, R&D efficiency, and supply chain optimization—executives ranked themselves as top performers and said these levers were top priorities. (See Exhibit 3.) Most companies give specific organizational units responsibility for achieving results with each of these levers, even when multiple functions are involved in the effort. For example, the manufacturing organization is typically responsible for lean manufacturing, while procurement is responsible for procurement savings. Attendance at cross-functional meetings is frequently limited to middle-level managers from different departments who lack decision-making authority. These managers provide weekly updates, with their primary focus being to defend their own turf.
For four of the six traditional levers—working capital reduction, lean manufacturing, R&D efficiency, and supply chain optimization—executives ranked themselves as top performers and said these levers were top priorities. (See Exhibit 3.) Most companies give specific organizational units responsibility for achieving results with each of these levers, even when multiple functions are involved in the effort. For example, the manufacturing organization is typically responsible for lean manufacturing, while procurement is responsible for procurement savings. Attendance at cross-functional meetings is frequently limited to middle-level managers from different departments who lack decision-making authority. These managers provide weekly updates, with their primary focus being to defend their own turf.
Executives ranked themselves lower on both their performance and the priority placed on the four primarily cross-functional levers: design to value, organizational efficiency, complexity reduction, and the broad suite of advanced digital tools referred to as Industry 4.0. Because responsibility for each of these levers does not reside with a dedicated organizational unit, it is often quite challenging to initiate projects and ensure results. For example, a successful design-to-value program requires close collaboration among engineering, production, procurement, and sales and marketing.Executives gave the lowest assessment of performance and priority to Industry 4.0, yet the advanced technologies that the term connotes hold particular promise for revolutionizing manufacturing. (See the sidebar “Industry 4.0 Holds Great Potential for Productivity Gains.”)
Industry 4.0 Holds Great Potential for Productivity Gains
Industry 4.0 is the most underutilized and underappreciated lever among the executives we surveyed. But of all the cross-functional levers, Industry 4.0 holds particular potential for capturing tangible value. (See Industry 4.0: The Future of Productivity and Growth in Manufacturing Industries, BCG report, April 2015.) Indeed, leading companies have used these advanced technologies to capture gains in productivity of up to 15%.
Here are brief descriptions of how four technologies are revolutionizing production:
- Augmented Reality. Augmented-reality-based systems support a variety of services, such as selecting parts in a warehouse and sending repair instructions over mobile devices. For example, workstations can display standard operating procedures for complex assembly as an overlay on a worker’s visual field. Companies have used such systems to improve their right-first-time ratio by more than 10 percentage points.
- Advanced Robotics. Robots are becoming more autonomous, flexible, and cooperative. Eventually, they will interact with one another and work safely side by side with humans and learn from them. For example, companies are using advanced robotics to streamline labeling and inspection processes and automate warehouse tasks. Productivity improvements include reducing the time spent on repetitive tasks in a low-volume, high-variety operation by 30% to 50%.
- Additive Manufacturing. Companies have used additive manufacturing (also known as 3D printing) primarily to prototype and produce individual components. Leading companies are testing ways to apply additive manufacturing in series production. For example, Boeing has reduced assembly time by additively manufacturing a complex airplane part, and GE has reduced scrap by 3D-printing a metal component.
- The Industrial Internet of Things. Advanced connectivity technology allows companies to create networks that comprise a wide variety of sensors and machines and make use of embedded computing. For example, companies are testing the use of this technology to enable flexible production lines that adapt based on variations in demand, product mix, and customization requirements. Another important application is enabling predictive maintenance through machine learning and predictive analysis, which reduces unscheduled outages and downtime for servicing.
An Insufficiently Rigorous Approach. Further, few companies have taken a sufficiently rigorous approach to their productivity programs. We presented respondents with a list of five basic elements of a comprehensive productivity improvement program. While more than 70% said they are designing their efforts with at least one element partially incorporated, only 14% are executing on all five. (See Exhibit 3.)
A New Approach to Step-Change Improvements
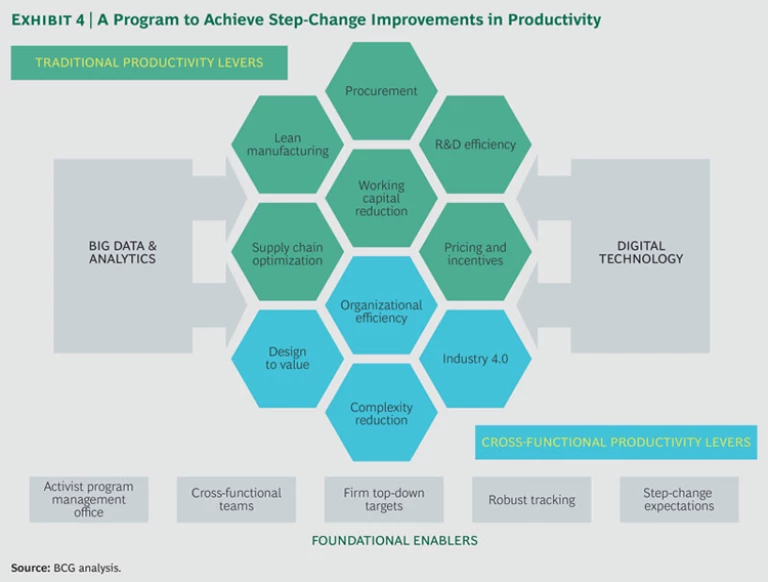
To achieve robust productivity growth, US manufacturers must use digital technology and big data and analytics to enhance the effectiveness of the full set of productivity levers. And they must implement a holistic set of actions that are the foundation of a rigorously designed improvement program. (See Exhibit 4.)
Use New Tools to Pull All Levers Effectively
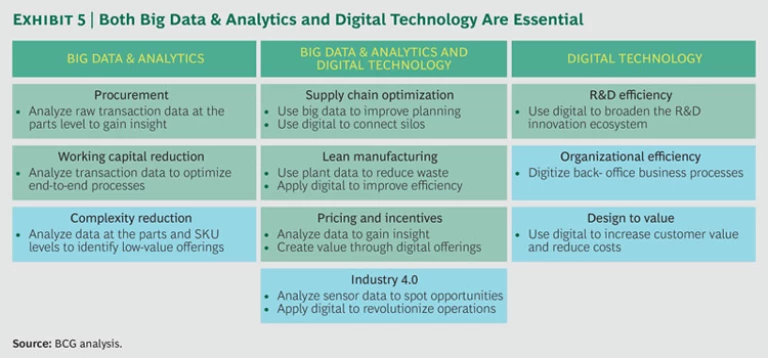
Digital technology and big data and analytics are applicable to both traditional productivity improvement levers and to the primarily cross-functional levers. (See Exhibit 5.) Two examples illustrate the opportunities.
Digital in Operations. Despite some advances in automating the value chain, today’s production cells are not connected, machines do not communicate, manufacturing lines are not sufficiently flexible, and a company’s communications with suppliers are not automated. As a result, companies require work-in-process inventory to accommodate the long lead time between order placement and delivery. This degree of automation enables mass production but only a limited ability to produce customized orders or small batches. To respond to changes in demand, a company needs fast, responsive lead times and a high degree of agility.
Companies can use digital technologies to fully integrate supply chains across the organization. Some producers have achieved a high degree of integration with their suppliers and consumers. Machine-to-machine, machine-to-part, and machine-to-human communication is becoming more and more common. Simulations are increasingly used for virtual testing and optimization. These advances will dramatically reduce the need for work-in-progress inventory, cut waiting time, and enable both mass production and customization.
Leading companies are already capturing impressive benefits. For example, Harley-Davidson uses 3D simulation, visual work instructions, and new techniques for planning and operations monitoring to enable same-day delivery of customized orders. The company has reduced the delivery time for a customized motorcycle from 21 days to six hours: customers can configure their motorcycle in the morning and ride it home from the factory in the afternoon. At the same time, Harley’s costs have declined by 7% and net margins have increased by 19%.
Big Data in Procurement. The explosion in available data and sharp reductions in the costs of data storage and processing mean that vast amounts of information and insight are now available to support productivity improvements in all parts of the value chain. Procurement is a case in point. Traditionally, a well-designed improvement program in procurement could reduce annual material costs by 4% to 5%. By applying big data and analytics tools to more effectively manage the “long tail” of procurement spending, companies can increase their annual material cost savings by 25% to 33%. For a $10 billion company, that could translate into more than $100 million in savings if done comprehensively.
Leading companies have used an approach developed by BCG that focuses on unlocking value in five of the most promising procurement areas: part numbers and prices, supplier management and contracting, time development and life cycle, inventory and stocks, and orders and plant execution. For example, a company can uncover savings opportunities by determining which parts are actually the same or similar despite having different identification numbers in the IT system. It can match parts on the basis of common sequences in the part number, use “fuzzy matching” to identify parts with similar descriptions, and link to other data sets to identify parts made from the same underlying commodity.By using these soft-matching techniques, companies can identify similar parts that have been sourced individually and aggregate spending. They can then reduce costs through traditional savings levers, such as sourcing from a low-cost country, changing suppliers, renegotiating contracts, or consolidating purchases for similar parts. For parts identified as the same or similar, the cost reductions are typically 10% to 20%.
Winning With a Holistic Program
The experience of a leading food and beverage manufacturer illustrates how a set of five enablers can provide the foundation for a productivity improvement program.
The company aimed for top-tier performance, with financial goals that included high single-digit revenue growth and earnings-per-share growth approaching 10%. However, weak GDP, value-conscious customers, and volatile commodity prices put these goals in jeopardy. The company launched a multiyear, comprehensive program that aimed to reduce costs while increasing agility and the speed of execution. The program included the following enablers:
- An Activist PMO. The company established and staffed a dedicated program management office, which was tasked with defining project principles, resolving problems, ensuring savings realization, and managing the cross-functional aspects of many of the productivity levers included in the program.
- Cross-Functional Teams. To go beyond cost reductions at the function level only, cross-functional teams conducted diagnostics to prioritize the most effective levers and apply new approaches that the company had not considered in the past.
- Firm Top-Down Targets. The company set a financial baseline before launching the program. The PMO coordinated target setting among functions, business units, and cross-functional initiative teams.
- Robust Tracking. A governance structure was put in place and managed by the PMO that included a productivity committee and regular reviews with the CEO and CFO. The company defined clear milestones and KPIs and held initiative teams accountable for both progress and savings.
- An Expectation of Step-Change Improvements. The leadership team established bold targets that were communicated throughout the company. Employees and line leaders were initially skeptical, but executives accountable for meeting the targets were able to use them to inspire functional and business leaders to identify innovative ways to improve productivity.
This approach enabled the company to exceed its most ambitious goals, increasing annual EBIT by $750 million. Coming out of the effort, the company created a new continuous improvement program, which helped to sustain improvements and prevent a return to previous cost levels. Over two years, the company’s productivity growth resulted in a TSR of 22.7%, 5.5 percentage points more than that of a main competitor. At the start of the two-year period, the company’s TSR had been 16.5 percentage points lower than the TSR of that same competitor.
Bold Ambitions Supported by Excellence in Execution
In order to determine which elements of this approach to focus on first and how to balance the traditional with the primarily cross-functional levers, a company must first benchmark its current approach against the full potential opportunity and then prioritize the productivity levers in terms of impact and speed of implementation.
In support of this assessment, the company can use a “health check” to measure its performance against KPIs relating to each of the ten productivity levers. Then, using a model developed by BCG, it can determine the size of the opportunity it can capture by applying each lever. The company can also use the model’s output to set an ambition level for a program tailored to its cost structure. Completing this assessment sets the stage for designing an integrated productivity improvement program. A well-designed and well-executed program targets quick wins that enable the effort to more than pay for itself in the first 12 months. The program can yield an improvement of at least 3 to 6 percentage points in EBIT over two to three years.
Taken together, our findings point to a pervasive complacency among US manufacturers regarding the potential for productivity growth. For too long, manufacturers have stayed within their comfort zone, applying the productivity levers they are most familiar with and eking out anemic productivity gains. If companies continue doing more of the same, the consequences for US manufacturing competitiveness could be disastrous. To reverse the recent downward trend in productivity, manufacturers must establish bold ambitions and pursue them using the comprehensive and rigorous improvement program we have described. Achieving a step-change in productivity growth must not be regarded as a long-term goal. For US manufacturers seeking to solidify their positions as global leaders, now is the time for action.
Acknowledgments
The authors thank Gideon Oppenheimer for his contributions to the underlying research and analysis for this report; the BCG ValueScience Center was also instrumental in conducting key analyses. In addition, the authors are grateful to the following colleagues for their insights: Matt Aaronson, George Bene, Dustin Burke, Philipp Carlsson-Szlezak, Carl Fuda, Christoph Gauger, Jan Gildemeister, Marin Gjaja, Gerry Hansell, Joel King, John Knapp, Abhijit Kodey, Joe Martin, Thomas Milon, Brian Myerholtz, Matthias Scherer, Hal Sirkin, and Andrew Taylor.
