Private equity firms once used financial leverage as their main tool for boosting the internal rate of return (IRR) on their portfolio companies. Now, as value creation has moved beyond financial engineering, operational improvement is the most frequently used lever. In particular, many PE firms are enhancing the value of their portfolio companies through add-on acquisitions. A study of private equity by The Boston Consulting Group found that M&A is the most common approach to improving the operational value of portfolio companies, used by 91% of the firms surveyed. (See Private Equity: Engaging for Growth, BCG report, January 2012.)
Buy-and-build deals (in which a PE firm buys a company and then builds on that “platform” through add-on acquisitions) can both accelerate revenue growth and drive margin expansion by realizing synergies. Furthermore, buy-and-build strategies can create market expectations of continued growth and margin improvements in portfolio companies, which can translate into higher exit valuations.
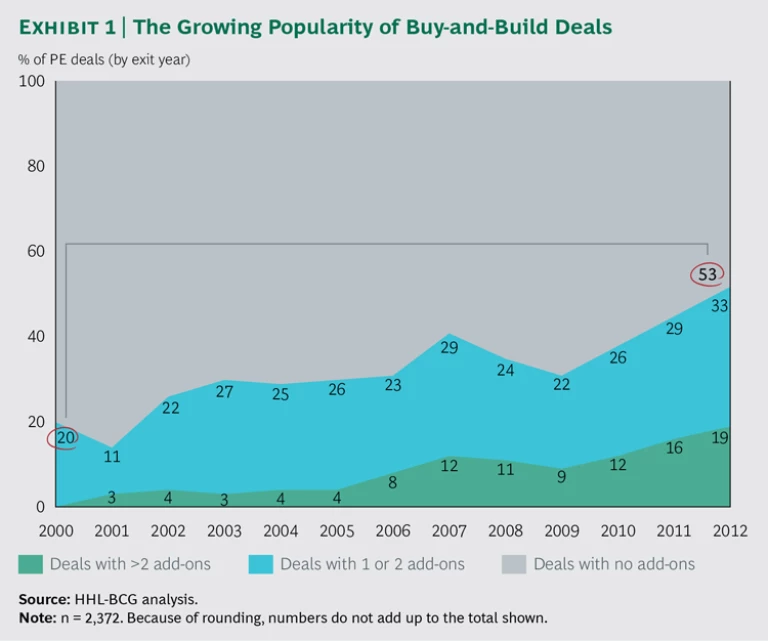
To gain a better understanding of the increasing importance of buy-and-build deals as a means of operational improvement, BCG collaborated with HHL Leipzig Graduate School of Management to analyze 2,372 deals exited from 1998 through 2012. The results reveal that the share of PE deals that include add-on acquisitions climbed from 20% of all deals in 2000 to 53% in 2012. (See Exhibit 1.) The average number of add-on acquisitions per deal grew from 1.3 in 2000 to 2.7 in 2012.
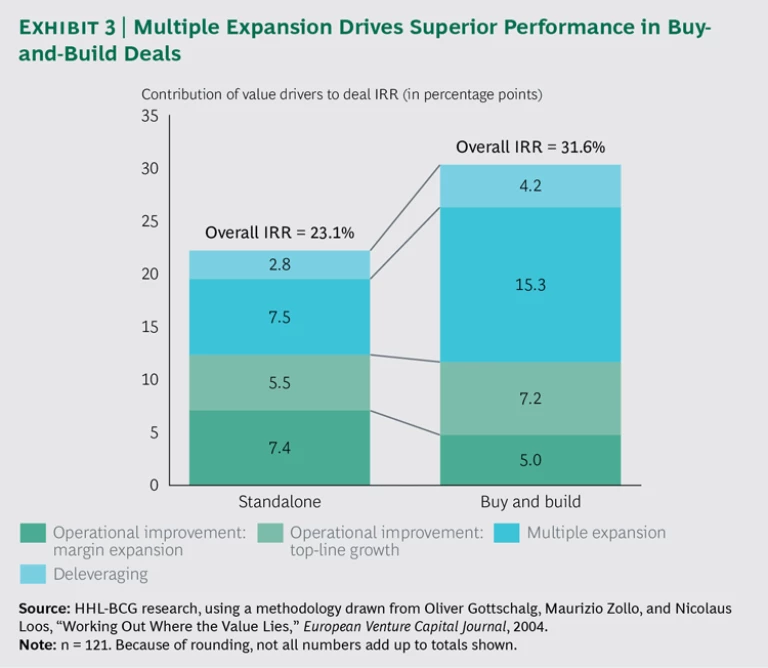
There’s one simple reason for the surge in buy-and-build deals: they outperform standalone PE deals, generating an average IRR of 31.6% from entry to exit, compared with an IRR of 23.1% for standalone deals.
The study also sheds light on how buy-and-build deals create value. For instance, small portfolio companies often have the most to gain from add-on acquisitions, and using acquisitions to build depth, rather than breadth, generates higher returns. Taken together, the findings of the analysis suggest the capabilities that are crucial for PE firms and platform companies and reveal the circumstances in which buy-and-build deals lead to superior performance.
From Leverage to Operational Improvement
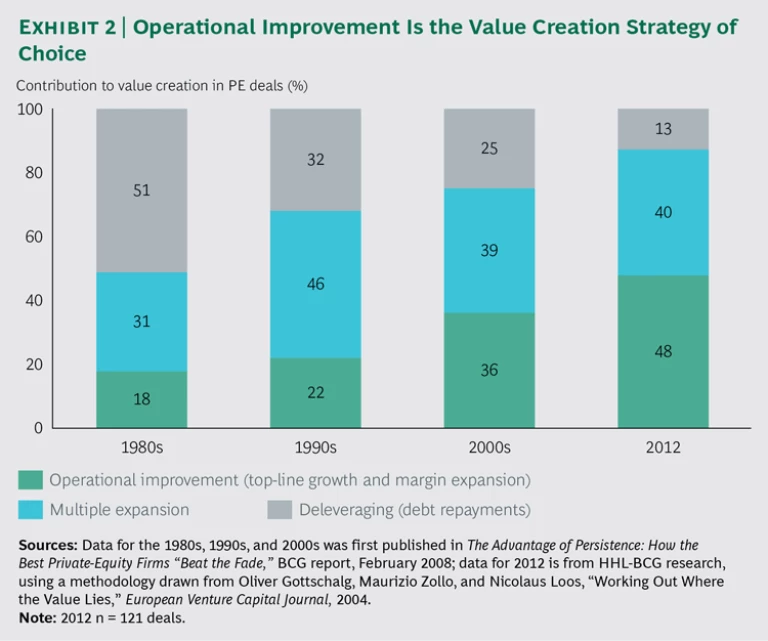
PE firms have generally created value in their portfolio companies in three ways: deleveraging, multiple expansion, and operational improvements aimed at increasing revenues, margins, or both. (See Exhibit 2.)
Deleveraging creates value by reducing the initial high level of leverage while the company is in the PE firm’s portfolio. This approach requires that the portfolio company generate a strong and stable cash flow to pay down debt. In the 1980s, deleveraging was the source of 51% of added value, but it has declined with each successive decade, to 13% in 2012.
Multiple expansion can increase the market value of the portfolio company by, for example, furthering a credible growth narrative, clarifying the company’s strategy, or lowering its risk profile. Valuations are also subject to external factors, of course, such as market conditions and the macroeconomic environment. Multiple expansion created 31% of value in the 1980s, surged to 46% in the 1990s, contracted slightly to 39% in the first decade of the 2000s, and stood at 40% in 2012.
Operational improvements create value through top-line growth generated by, for example, the development of new products, geographic expansion, improved price realization, or enhanced sales force effectiveness, as well as through margin expansion, achieved by such means as reducing operating costs and selling, general, and administrative expenses. The contribution to added value from operational improvements has climbed steadily, from 18% in the 1980s to 48% in 2012.
Buy-and-build deals are not the only way to generate superior performance, but they have become one of the favored means of realizing operational improvements and furthering a credible narrative about future growth and margin expansion. Value in buy-and-build deals often results from traditional synergy levers—such as scale effects in procurement and in selling, general, and administrative expenses—and from improved sales force effectiveness and pricing.
A Summary of Our Findings
To conduct our research, we winnowed down the sample—first from a universe of 9,548 deals to a set of 2,372, in order to gain a broad overview of market activity, and then, for return analysis, to 121 deals. About 40% of those deals included add-on acquisitions, and 90% involved companies based in Europe. The median fund size among the participating firms was $753 million, and the median enterprise value of the deals was $198 million.
No US companies were included in the sample of 121 deals, because US regulations do not require the sort of disclosures that provide the necessary detail. We selected deals for which we could obtain consistent sets of performance data, such as IRR, and detail on the levers employed to create value. We used this sample to analyze the relative contribution of each value-creation lever (deleveraging, multiple expansion, and operational improvements) to deal performance. (For a fuller explanation of our research methodology, see “How We Performed Our Analysis.”)
HOW WE PERFORMED OUR ANALYSIS
We sought to analyze the performance of private equity deals along two dimensions: buy-and-build intensity (how often PE firms used the approach) and performance (the internal rates of return these deals generated).
We began with a master set of 9,548 deals exited from 1998 through 2012, 2,497 of which involved add-on acquisitions. The set represented 2,682 PE firms and encompassed multiple regions, with 36% occurring in the US, 35% in Western Europe, 20% in the UK, and 9% in other regions.
To provide a broad view of buy-and-build intensity, we identified the 126 most active PE firms in our set. This resulted in a sample of 2,372 deals, 831 of which were buy and build. The median deal had an enterprise value of $360 million at entry.
We used this sample to examine the characteristics of the deals, including the number of add-on deals, the entry channel, the deal size, whether the acquisition was cross-border, and whether the deal diversified the portfolio company’s business.
Finally, for the purposes of performance analysis, we winnowed the sample to the 121 deals, including 48 with add-ons, that provided the most complete data on IRR and on the levers employed to generate performance, including sales increases, earnings improvements, debt reductions, and multiple expansion. This sample represented 107 PE firms. The median enterprise value of the portfolio companies in these deals was $198 million at entry. About 90% of the deals involved European companies, most of them in France, Germany, Italy, and Sweden.
The set of 121 deals is in line with the sample sizes employed in other studies of PE portfolio company performance.
Our research led us to several conclusions, which we discuss in more detail in later sections of this report.
- Multiple expansion is the main engine of superior performance in PE deals—particularly in buy and build. Leverage reduction, revenue growth, and widening margins, of course, contribute to higher returns. But their roles are secondary to multiple expansion, which in many cases is the result of increased expectations of profit growth, fueled in part by higher revenues or wider margins. The influence of buy and build on investors’ expectations, and hence on multiples, is underscored if we compare the multiple expansion of standalone deals with that of buy-and-build deals. The contribution of multiple expansion to the IRRs of the buy-and-build deals we studied was 15.3 percentage points, on average, compared with 7.5 percentage points in standalone deals. (See Exhibit 3.)
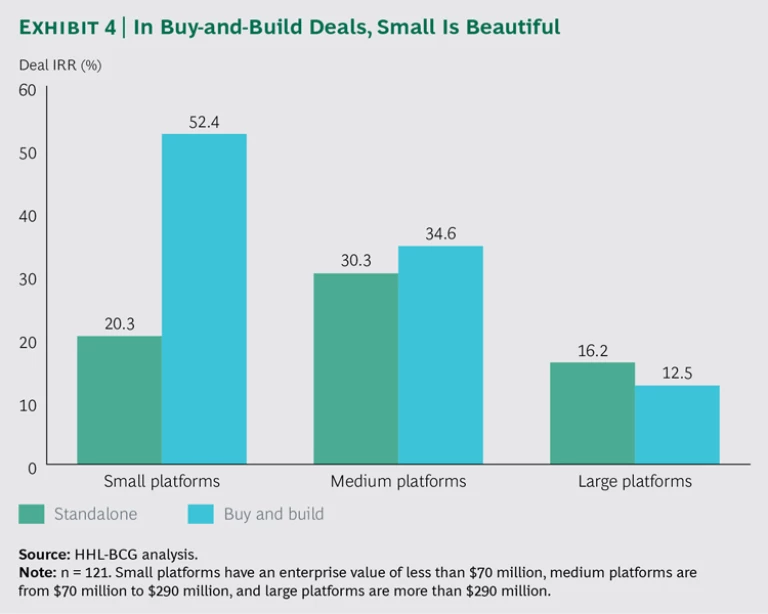
- Buy-and-build activity increases with the size of the initial platform deal, but the buy-and-build deals of small platforms outperform those of medium-sized and large platforms by sizable margins. The deals of the small platforms in our analysis, defined as those with an enterprise value of less than $70 million, generated an average IRR of 52.4%, compared with 20.3% for standalone deals. The buy-and-build deals of large platforms—those with an enterprise value of more than $290 million—underperformed relative to both smaller platforms and standalone deals. (Medium-sized platforms had an enterprise value of $70 million to $290 million.)
- Buy and build is employed most commonly in primary deals—in our study, 43% of primaries engaged in buy and build, compared with 32% of secondary transactions (in which ownership of a company passes from one PE firm to another). The strategy, however, is more successful in secondaries. Add-ons to secondaries yielded an average IRR of 36.9%; the average IRR of buy-and build deals for primaries was 29.9%, and for standalone secondaries, it was 11.2%.
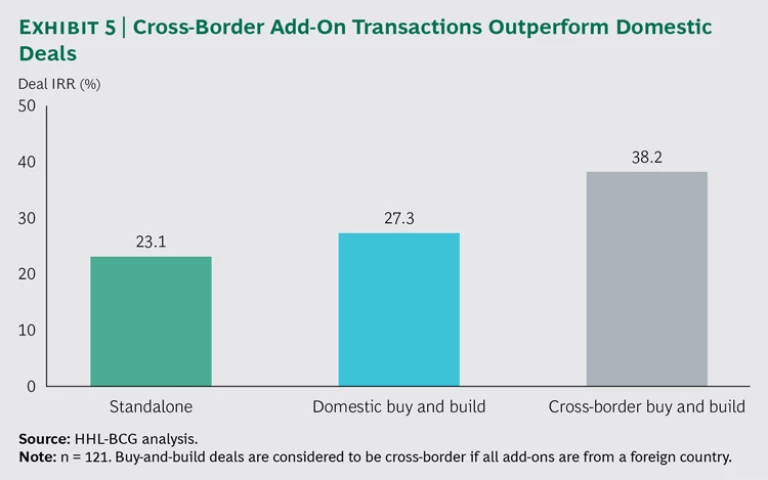
- Buy-and-build deals that involve cross-border add-on acquisitions outperform both standalone deals and deals involving domestic acquisitions, generating an average IRR of 38.2%, compared with 23.1% for standalone deals and 27.3% for domestic acquisitions.
- Deals that take the platform company deeper into an industry generate an average IRR of 43.5%, compared with 16.4% for deals that diversify the business and 23.1% for standalone deals.
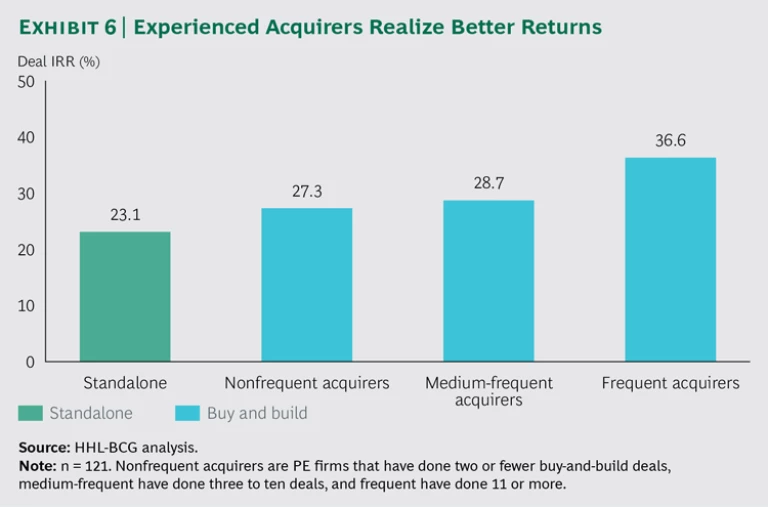
- Experience with buy-and-build deals boosts returns. PE firms in our sample with more than ten buy-and-build deals under their belts earned an average IRR of 36.6%[--Data on the number of buy-and-build deals is from our sample of 2,372 deals. IRR figures are from our sample of 121 deals.--], compared with 27.3% for firms with fewer than two buy-and-build deals and 28.7% for firms that did two to ten.
- Deals that include one or two add-on acquisitions outperform both standalone deals and those that include more than two acquisitions. Deals in our sample with one or two add-ons generated an average IRR of 35.5%, compared with 23.1% for standalone deals and 19.9% for deals involving more than two add-ons.
- Superior performance in buy-and-build deals is limited to industries that share specific characteristics, including low growth rates, low margins, and high fragmentation.
Smaller Is Often Better
Of all our findings, one of the most notable concerns the size of the platform company. Indeed, size is a determinant of buy-and-build success. The larger the platform, the more acquisitions it makes. However, the smaller the platform, the greater the returns from a buy-and-build strategy. (See Exhibit 4.) We divided platform companies into three categories: small (those with an enterprise value of less than $70 million), medium ($70 million to $290 million), and large (more than $290 million).
In a striking finding, we observed that the buy-and-build deals of small platforms performed significantly better than those of larger acquirers. The deals of small platform companies generated an average IRR from entry to exit of 52.4%, compared with 34.6% for deals done by medium acquirers and 12.5% for those by large acquirers. We conclude from this performance comparison that the greatest multiple expansion occurs in companies with relatively small enterprise values, in part because the valuation multiples of smaller companies expand faster with increasing size than those of their larger counterparts, and in part because smaller companies predominate in fragmented industries, which are primed for consolidation—another example of next-level value creation.
Small is also beautiful when it comes to the relationship between PE fund size and buy-and-build performance. Of the 48 PE firms in our analysis with assets of less than $753 million (the median for the sample), 35% did one or two acquisitions per platform, and 7% did more than two. By contrast, 14% of the 42 funds with assets of $753 million or more did more than two, and 29% did one or two. Funds with less than $753 million in assets earned an average IRR of 44.5% on their buy-and-build deals, compared with an average IRR of 31.3% for funds with more than $753 million in assets. Naturally, smaller funds tend to limit themselves to smaller acquisitions, and the add-on acquisitions of smaller portfolio companies offer the greatest scope for operational improvement, because comparatively small improvements can have outsize effects on operational results.
Secondaries Thrive with Buy and Build
Although buy-and-build activity is more common among platforms acquired as primary deals, occurring in 43% of cases (compared with 32% of secondaries), buy-and-build deals among secondary platforms generate higher IRRs. Buy and builds by secondaries in our sample returned an average IRR of 36.9%, while those by primaries generated 29.9%.
Those findings suggest that buy and build is a crucial means of value creation in secondaries. The primary owner will have used the basic operational improvement levers, such as margin gains and revenue enhancements, by the time the asset is sold. It then falls to the secondary owner to apply the next, more advanced set of operational improvement moves to create additional value in the portfolio company. Such improvements might include improved price realization, enhanced sales force effectiveness, or increased sales of higher-margin products or services.
Crossing Borders, Creating Value
Our analysis makes clear that buy-and-build deals that cross national borders create more value than both domestic buy-and-build and standalone deals. Of the 121 companies in our sample, 15.7% made cross-border acquisitions, 24% did domestic deals, and 60.3% made no acquisitions. The international acquisitions generated an average IRR of 38.2%, compared with 27.3% for the domestic acquisitions and 23.1% for standalones. (See Exhibit 5.) The takeaway: a buy-and-build strategy is especially effective when used to internationalize the acquirer’s business. The international expansion of a formerly domestic company creates opportunities for cross-selling and economies of scale, as well as multiple expansion if the business improvements raise investors’ expectations of results that aren’t yet borne out by financial performance.
Add-ons also outperform when they increase the platform company’s presence in a particular industry, as opposed to diversifying its business lines. The 22.3% of deals in our sample that deepened the acquirer’s industry penetration generated an average IRR of 43.5%, compared with an average IRR of 16.4% for the 17.4% of deals that moved the acquirer into a new industry. That finding reinforces the wisdom of “sticking to your knitting” in order to accrue experience—and assets—in a single industry.
Experience Pays—and Pays, and Pays
No matter a deal’s size, location, or industry, even the best-laid buy-and-build strategy stands little chance of success if the PE firm executing it lacks operational experience. We found that the firms in our sample with experienced operational teams not only did more buy-and-build deals but also reaped higher returns from them. Firms with operational experience generated an average IRR of 42.8% from add-on deals, compared with 21.2% for firms without such experience. That strongly suggests that operating experience is essential to creating value through the successful realization of synergies and integration of acquisitions.
Not surprisingly, experience with buy-and-build deals themselves also makes a difference. PE firms that do multiple add-on deals often generate higher returns from them than do firms with less buy-and-build practice. Yet many frequent acquirers limit their activity—38% of the 40 firms in the sample that had made 11 or more buy-and-build acquisitions did only one or two deals on average per platform; 13% of those frequent acquirers did two or more. By contrast, 24% of the 45 nonfrequent acquirers (those with two or fewer buy-and-build deals under their belts) did one or two deals per platform, while 4% did more than two. Of the 36 medium-frequent acquirers in the sample—those that had engaged in three to ten buy-and-build transactions—28% did one or two deals per platform, and 14% did more than two.
Returns on those deals strongly favored the experienced acquirers. Frequent acquirers posted an average IRR of 36.6%, compared with 28.7% for medium-frequent acquirers and 27.3% for nonfrequent acquirers. (See Exhibit 6.) Limiting the number of add-ons also led to high performance: deals in our sample with one or two add-ons generated an average IRR of 35.5%, compared with 23.1% for standalone deals and 19.9% for deals involving more than two add-ons.
The lesson is simple: when engaging in buy and build, experience pays.
Industry Matters
When it comes to buy and build, not all industries are created equal. Our analysis shows that certain characteristics—including low industry profitability, low growth, and high fragmentation—strongly influence whether a deal will generate superior performance. The 23 deals we studied that were in low-margin industries, for example, produced an average IRR of 46.1%, while deals in high-margin industries generated an average IRR of 18.3%.
In the same vein, platforms positioned in industries with three-year growth rates of 0% to 10.9% produced an average IRR on add-on deals of 41.7%, compared with an average of 16.3% for platforms in higher-growth industries. Deals in highly fragmented industries (as measured by the Herfindahl-Hirschman Index, which gauges industry concentration) generated an average IRR of 42.2% from buy-and-build deals, while deals in highly concentrated industries produced an average IRR of 25.3%. The performance differential is to be expected—it is a longstanding PE strategy to enter a fragmented industry and act as a consolidator to capture market share and realize synergies.
Next-Level Value Creators
The value creation game in PE has moved to the next level. Today, operational improvement is the most commonly used tool for building value in a portfolio company and ensuring a profitable exit. But as experienced PE professionals know, successful buy-and-build deals hinge on a variety of factors. Our analysis confirms that portfolio companies with buy-and-build strategies outperform, and first-quartile performers share a highly particular set of circumstances. In such cases, the portfolio company:
- Is small or medium-sized.
- Has a PE sponsor with operational and buy-and-build experience.
- Offers an operationally efficient and scalable platform.
- Operates in a low-growth, low-profitability, highly fragmented industry.
- Makes one or two add-on acquisitions.
- Targets add-on acquisitions in its core industry.
- Uses buy-and-build to expand internationally.
To capture the opportunity that buy and build presents, PE firms must raise their game in all phases of their businesses. It’s the only way to create value in all markets and in all stages of the economic cycle.
