Automakers around the world are under increasing pressure to improve the efficiency of their R&D operations. A lot of money is involved: the top 40 automotive OEMs spend more than $75 billion annually on R&D. To enhance the return on this investment, they need a new approach to tracking and steering their R&D efforts. Through our extensive work with automakers around the globe, we have developed an innovative way of measuring R&D efficiency—one that assesses spending relative to actual output. This approach will enable automakers to identify areas of unnecessary spending, thereby freeing up funds for more-critical projects.
Such new thinking is essential, given the treacherous road ahead for automakers. Companies are grappling with the need to accelerate their pace of innovation amid the most powerful technological changes since the birth of the combustion engine. Among the seismic shifts: the takeoff of electric vehicles and the emergence of autonomous vehicles. But at the same time, volume growth is slowing, which raises a crucial question: how will companies fund the hefty investments that they must make in new technologies to remain competitive?
The answer lies in automakers’ ability to improve the efficiency and productivity of their research and development. But such improvement depends on addressing a fundamental shortcoming in how they currently manage R&D. Today, the primary financial metric for evaluating R&D is the ratio of R&D spending to sales. But given the lag time between R&D investment and the final products it yields, that measure reveals nothing about the effectiveness of current R&D efforts. The delay in practical assessment can lead to overspending and subpar allocation of resources among divisions, technologies, and regions. Our new approach overcomes that shortcoming and allows automakers not only to assess the efficiency of their past R&D operations but also to develop smart R&D plans for the future.
Recent benchmarking of six premium automakers finds that R&D efficiency has deteriorated in recent years—a worrisome development. If the industry is to reverse this trend and build the innovation-generating machine required in the future, it must start by shining a bright light on what its massive investment in R&D is producing now.
A Seismic Shift
Three profound changes in the auto industry are combining to generate an upheaval of unprecedented magnitude.
The first change is the shift in engine technology. For more than a hundred years, cars have been built around a combustion engine. Although those engines have evolved in power and sophistication, their core technology has remained the same. Today, however, that engine is increasingly being replaced by electricity-based alternatives—and that shift will drive a fundamental change in the engineering skills and talents needed to succeed in automaking. That’s because, unlike combustion engines, the motor in an electric car will essentially be a commodity. Companies will differentiate themselves through the software and applications they develop for that commodity engine. As a result, critical engineering capabilities in the future will involve not hardware development, but rather software and application-oriented design. Already the industry faces a serious new competitor in the field of electric vehicle innovation—Tesla. (See “ What Automakers Can Learn from the Tesla Phenomenon ,” BCG article, May 2016.)
The second disruptive change is the arrival of self-driving vehicles (SDVs), marking a fundamental point of departure from the world of the driver-operated car. (See Revolution in the Driver’s Seat: The Road to Autonomous Vehicles , BCG report, April 2015.)
The third powerful change is the emergence of new business models that have the potential to upend the traditional market for selling cars to individual owners. From Google’s self-driving car project to Uber’s ride-share service, new mobility options are gaining steam, with major implications for how consumers are likely to think about car buying in the future.
For automakers, responding to these changes is a tall order. OEMs must make significant investments in new technologies and explore new business models while upgrading and maintaining their traditional products and businesses. Until now, sustaining high levels of R&D investment has not been difficult, thanks to robust volume and revenue growth. Following the 2009 global economic crisis, the auto industry came roaring back, posting average annual growth of 5% to 6% from 2009 to 2015. But that torrid pace has begun slipping, and BCG’s analysis of IHS Markit data suggests that growth will weaken to just 2% to 3% over the next three to four years. In the premium segment—where adoption of technological advances typically occurs first—we project that the slowdown will be even more dramatic, from 13% in the 2009 to 2015 time frame to 2% to 3% in the period from 2017 to 2020.
In this environment, automakers must bring a new focus on efficiency to R&D and the allocation of R&D dollars.
Replacing a Flawed Approach to R&D Measurement
The ratio of R&D spending to sales (the R&D ratio) is often but wrongly referred to as “R&D efficiency.” Although this measure gives a sense of the intensity and scope of the R&D effort relative to the size of the company, it does not shed any light on how efficiently those dollars are used.
The problem with the R&D ratio is twofold. First, product development cycles are long in the auto industry, with four or more years required to develop a new model. As a result, R&D expenses in one period are measured against revenues generated by products developed in an earlier period. Second, changes in the market environment—an economic slowdown, for example—can strongly influence revenues and drive up the R&D-to-sales ratio. But the resulting change in the metric will have little or nothing to do with actual R&D efficiency.
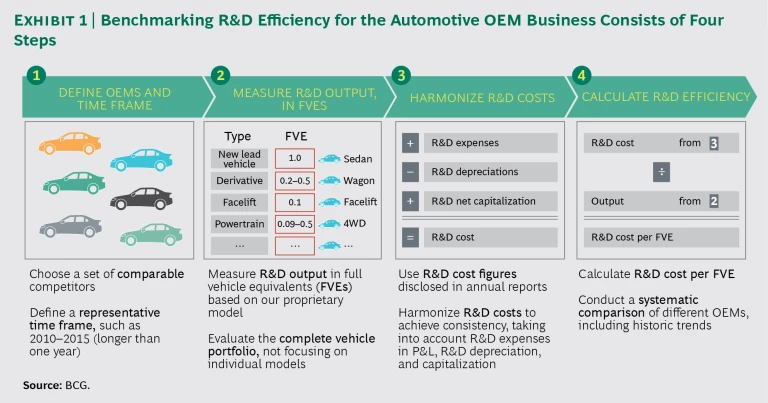
To address the need to zero in on true R&D efficiency, BCG has developed and applied a metric: the ratio of R&D spending in a certain period to what we call “full vehicle equivalents” (FVEs) developed during that period. This approach enables us to measure what was spent—and what new products that spending actually yielded.
We derive the numerator in this equation from an analysis of the automaker’s public financial statements, after adjusting the disclosed R&D figure to account for the capitalization of certain R&D investments.
To calculate the output on those investments—the FVEs—we developed a proprietary model that converts all large elements of the vehicle development process into FVEs on the basis of the average resources those elements consume. The maximum level of investment is an entirely new model—typically the lead vehicle in a series—which is equal to 1 FVE in our analysis. The first BMW 5 series model and the original Audi A3, for example, qualify as lead vehicles. A facelift of an existing model (which we define as a limited makeover in the middle of the model’s life cycle) requires less effort, of course, and receives a lower FVE value—in our system, 0.1 FVE. We assign different FVE values to other outputs such as a new powertrain, a new drivetrain, and derivative models. A wagon derivative of a lead vehicle receives a value of 0.2 FVE, for example, while an SUV based on that lead vehicle gets 0.5 FVE.
We can then examine the R&D-spending-to-FVE ratio for a given period. Looking at a five-year time frame, for example, we would take total R&D spending for that period and compare it to the FVEs produced during that period, capturing only work done in that five-year period. So if half the work involved in developing a new vehicle occurred during that period, the output in FVEs would be 0.5 FVE, not 1 FVE. In this way we match spending and output directly.
We can use this model for benchmarking (in which case it draws on publicly available data) or for analyzing an individual company’s efficiency (using internal figures). (See Exhibit 1.) In our experience, the difference between results based on internal data and those based on external data is small.
A Troubling Drop in R&D Efficiency
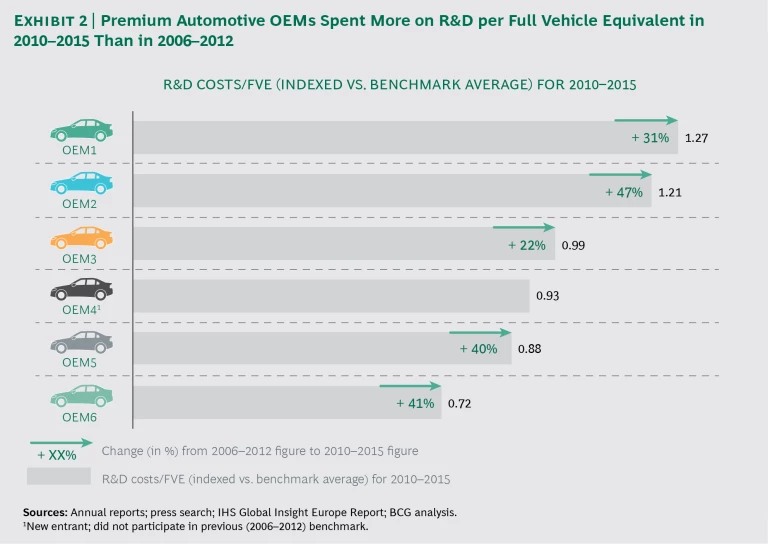
What does this new measure of R&D tell us about the auto industry’s efficiency? The news is not good. We calculated the R&D-to-FVE ratio for six premium automakers in two periods, 2006 through 2012 and 2010 through 2015. (See Exhibit 2.) The numbers reveal a steep drop in efficiency: the ratio during the period from 2010 through 2015 ranged from $716 to $1,266 million per FVE, up from $509 to $966 million during the period from 2006 through 2012.
Several factors have contributed to that deterioration in efficiency, including the fact that companies are investing heavily in early-stage technologies such as electric vehicles and autonomous driving systems. Such investments are critical, but they will naturally bring down the R&D efficiency ratio for a couple of reasons. First, it costs more to develop an entirely new, previously untested technology than to improve on a well-tested existing product. Second, the FVE calculation does not capture investments in new business models, because that spending does not technically lead to new products such as a physical vehicle.
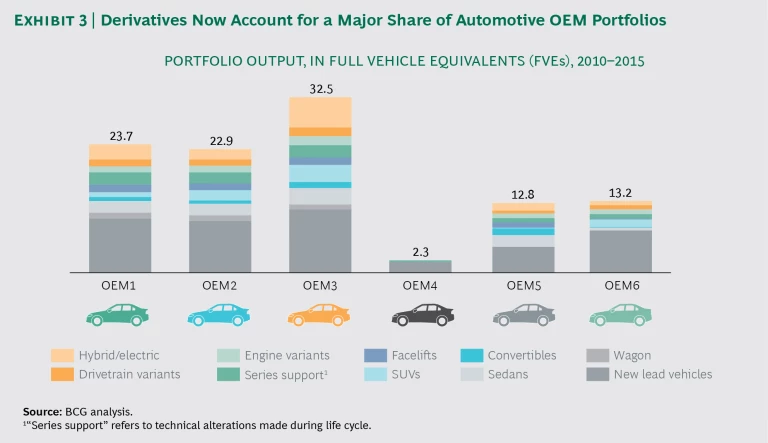
But those nascent technologies are not the only drag on R&D efficiency. Another significant factor is an increase in derivatives (a hatchback version of an existing sedan, for example) and series facelifts. (See Exhibit 3.) Traditionally, new lead vehicles dominated automakers’ new product portfolios. Five or six years ago, about three-quarters of the new portfolio as measured by FVEs consisted of lead vehicles; today the corresponding figure is about 42%. Derivatives and facelifts now account for 46% of the new portfolio, and electric vehicles (including full hybrids) make up 12%.
While the increased emphasis on derivatives has helped generate growth in revenue and volume by allowing automakers to create cars tailored to the tastes of particular customer segments, it has also increased the complexity of the product portfolio and, in turn, the R&D operation.
How Measuring R&D Efficiency Can Change the Future
It is one thing to understand how the efficiency of R&D operations has changed in recent years. But the real power from this new metric comes in altering how companies allocate R&D going forward.
To understand the opportunity here, it is helpful to consider how automakers handle their R&D budgets and planning today. Usually a company bases its overall R&D budget on its financial statements, with R&D allocated some fixed percentage—usually 5% to 8%—of sales. Separately, the marketing team (typically) creates plans for new vehicles, and the engineering team estimates the costs of developing the new products. Much time and effort then go into bringing those three distinct sets of plans and budgets into alignment.
Using the R&D-to-FVE ratio as the centerpiece of R&D planning can eliminate the current system’s lack of coordination. An automaker can start with its planned new-product portfolio over the next several years. Converting that lineup into FVEs provides a solid measure of output. Calculating the ratio of planned spending to that FVE number will enable the company to determine whether it is on a path toward declining R&D productivity.
Armed with that insight, companies can move away from financial-statement-driven allocations of R&D investment and instead allocate only the dollars that are necessary for the product pipeline. Companies may discover that the topline allocation of R&D spending is higher than the products in the pipeline warrant. In such cases, the excess funds can be redirected toward the development of new technologies.
In some cases, of course, pinpointing excess spending in existing traditional businesses will not free enough funds to meet the investment requirements in cutting-edge areas. Companies faced with that situation will have to make tough decisions about reducing funding for upgrades or for adding new features to existing cars in order to up their investment in emerging technologies.
The advent of electronic cars, self-driving vehicles, and new business models will remake the auto industry in significant—and unpredictable—ways. To thrive, automakers must make sizable R&D investments, at a time when declining volume growth will squeeze their budgets.
Dramatically improving R&D efficiency means moving away from the traditional planning process and embracing a new method of tracking and directing R&D spending. The new FVE-based model that we have developed will enable companies to rethink their management of R&D in several ways. First, they will be able to assess their own R&D efficiency over time and compare their performance to that of their competitors. Second, they will be able to conduct clear-eyed analyses of various development models, including partnerships, in order to make decisions about future investments. And third, they will be able to effectively link financial and portfolio planning to avoid multiple, inefficient rounds of siloed planning.
Such advances will help automakers confront a business environment that is rapidly changing—and set them on the road to success.
