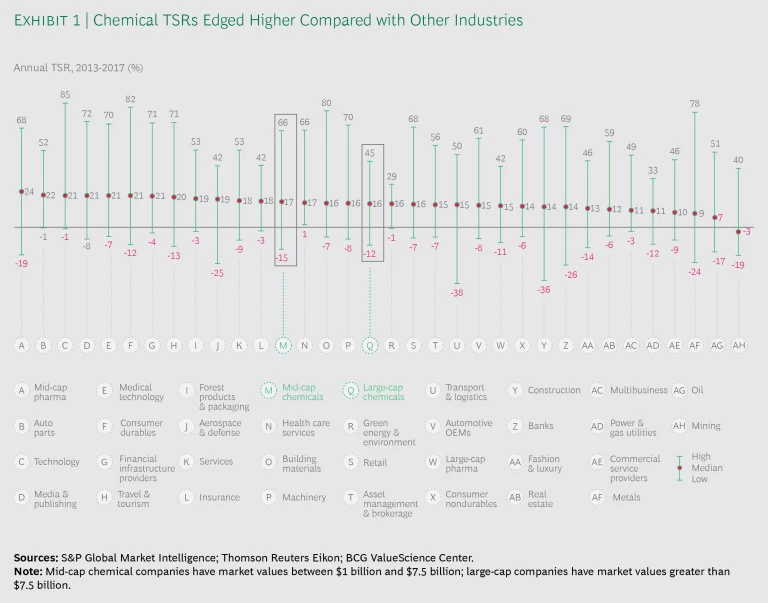
Benefiting from better performance in certain geographies and subsectors, the overall chemical industry has surpassed some other industries in shareholder returns. (See Exhibit 1.) But there is huge variation in returns from firm to firm, underscoring the need for companies to pursue the strategies and end markets that will create a path to profitable growth.
The total shareholder return of the average large chemical company was 16% for the five-year period from 2013 through 2017, a 2 percentage point increase from the previous period.
Doing particularly well were chemical companies with market values between $5 billion and $20 billion. The median five-year TSR of chemical companies with these valuations was 18.7%. A lot of that outperformance took place in the focused-specialty subsector, which has had the highest five-year TSRs in the chemical industry for four straight periods. Two-thirds of focused-specialty companies of this size had five-year TSRs above 20%. But there were also a good number of high-performing multispecialty companies in this market value range, part of an improvement that has allowed the TSRs of multispecialty companies as a whole to draw even with those of focused specialties. Roughly half the multispecialty companies with market values of $5 billion to $20 billion had five-year TSRs above 20%.
Almost as high performing were the smallest companies in our study—an inherently volatile group with market capitalizations of $1 billion to $5 billion. This group includes most of the emerging-market chemical companies that we looked at. (See “How We Calculate and Report TSR.”)
HOW WE CALCULATE AND REPORT TSR
HOW WE CALCULATE AND REPORT TSR
Total shareholder return, which accounts for the change in share price and any other effects on shareholders’ net wealth in a given period, is the product of multiple factors. Readers of BCG’s Value Creators series are likely familiar with our methodology for quantifying the relative contribution of the various components of TSR. (See the exhibit below.) The methodology uses the combination of revenue (that is, sales) growth and change in margins as an indicator of a company’s improvement in fundamental value. It then uses the change in the company’s valuation multiple to calculate the impact of investor expectations on TSR. Together, those two factors determine the change in a company’s market capitalization. Finally, the model also tracks the distribution of free cash flow to investors and debt holders—in the form of dividends, share repurchases, and repayments of debt—in order to determine the contribution of free-cash-flow payouts to a company’s TSR.
All those factors interact—sometimes in unexpected ways. A company may increase its earnings per share through an acquisition but create no TSR if the acquisition erodes its gross margins. In addition, some forms of cash contribution (like dividends) can affect a company’s valuation multiple in ways different from others (like a share buyback); the effects are complex.
In this report, the TSRs used for groups and for comparative purposes are generally medians. The TSRs associated with individual companies are straight calculations of the company’s capital gains and cash flows, rounded to the nearest percent or tenth of a percent.
Northeast Asia Is On Top Overall
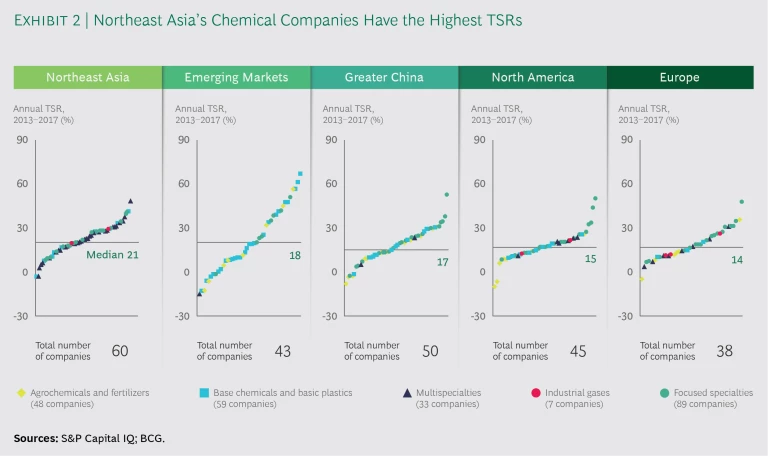
After three five-year periods in which North American chemical companies were at or near the top in terms of performance, the best returns in the industry are once again accruing to companies in Asia. (See Exhibit 2.) In Northeast Asia, the region with the highest five-year TSR, the strong performance came almost entirely from Japan. The average Japanese chemical company had a five-year TSR of 24% in the most recent period, on top of an already strong 19% TSR from 2012 through 2016. (In the two five-year periods before that, Japanese chemical companies had median TSRs of 13% and 11%, respectively.)
A substantial portion of Japanese chemical company TSR improvement has resulted from financial moves—so-called cash flow effects. For instance, close to two-thirds of the TSR of Tosoh, Japan’s top-performing chemical company in the 2013−2017 period, came from deleveraging. Debt reduction likewise accounted for two-thirds of the TSR of Tokuyama, Japan’s sixth best-performing chemical company.
Japanese companies have largely moved away from base chemicals and basic plastics, a subsector that—with its demand characteristics and fixed manufacturing costs—has become challenging in developed economies that have no feedstock advantage. Underperforming base chemical companies in developed economies (those with TSRs below the chemical industry average) outnumber superior performers by more than two to one. Base chemical companies have little sex appeal in developed markets, as evidenced by the slow relative improvement of their valuation multiples compared with other subsectors.
To their detriment, South Korean chemical companies—the other group in Northeast Asia that we studied—remain tilted toward base chemicals. This has been a drag on their shareholder returns: the median five-year TSR of the country’s chemical companies was just 8%. Only two small base chemical companies (Korea Petrochemical Industrial Company and Posco Chemtech) had TSRs above the chemical industry average; all the others had below-average TSRs. South Korea’s multispecialty companies have also struggled, eking out a median TSR of only 3% in the most recent period. The relatively poor TSR performance of South Korea’s chemical industry hasn’t completely undermined chemical TSRs in the region, since for every South Korean company in our study there were three Japanese companies. But the South Korean performance has exerted some downward pressure on Northeast Asian TSRs, leaving the region with a median TSR of 21%.
India Leads the Way in Emerging Markets
After Northeast Asia, chemical companies in emerging markets showed the best performance, with a five-year TSR of 18%. Here, too, the story was Asia—specifically, India. All the Indian companies in our study—including six that, having crossed the $1 billion market cap threshold, are included this year for the first time—had median five-year TSRs above the chemical industry average. Indian chemical companies have had a number of things going for them from a TSR perspective, including the fast rate of economic growth in the country, rising demand for chemicals, and local stock market indexes that advanced by more than 70% between 2013 and 2017. (See below for a fuller discussion of India’s chemical industry.)
India isn’t the only emerging-market country producing TSR stars. Also part of the surge in the emerging-markets group (which had the most improved TSR of companies in any region) were two Turkish base chemical companies, Petkim Petrokimya and Soda Sanayii (five-year TSRs of 40.4% and 38.2%, respectively); the Philippine focused-specialty company D&L Industries (40.6%); and the Pakistani fertilizer company Engro (31.1%). The emerging-markets chemical group also had the widest range of TSRs in our study, with Saudi Arabian companies generally coming in well below the average.
Chemical companies in Greater China continued to grow quickly, with a median TSR of 17%, the third highest of any regional group. By far the biggest contributor was revenue growth, a median of 11% per company—even higher than China’s GDP growth, which is around 7%. That China’s chemical industry has grown so much faster than its GDP is a consequence of “substitution”—the replacement of nails with chemical adhesives, for instance—and the use of chemicals in virtually all parts of the industrial value chain. Another source of growth is production by Chinese companies of chemicals that previously were imported.
In Greater China, virtually every subsector of chemicals—from PVCs to intermediates to pharma ingredients—is enjoying double-digit revenue growth.
The fast growth in Greater China’s chemical industry is not concentrated in any one product area. Virtually every subcluster of chemicals—from PVCs to intermediates to pharma ingredients—is enjoying double-digit revenue growth.
For the last few years, the route to success in Greater China has been focused specialties. Seven of the top ten TSR companies are in this subsector, including China’s number-one TSR performer, Shanghai Kinlita Chemical (five-year TSR of 51.9%). Kinlita (a new addition to this year’s study) provides paints and coatings for the transportation and automotive industries. The number-two Chinese company, Shandong Sinocera Functional Material, makes ceramic powders used in a variety of electronics products. Sinocera (five-year TSR of 36.7%) is one of four companies in China with above-average TSRs that specialize in additives and functional chemicals.
In the long run, we expect the Chinese government’s growing interest in environmental protection to have a significant impact on the country’s chemical industry. The regulations (covering air, water, and solid waste) will mostly affect base chemical companies, which are asset intensive and tend to operate in the sectors with the highest levels of pollution. As plants close and the asset base consolidates, the overcapacity problem that has plagued China’s base chemicals subsector is likely to ease. The subsector should become healthier and returns should increase. This will benefit bigger companies, including state-owned enterprises and multinationals, which have the resources to comply with new environmental requirements.
North American and European Performance Diverges
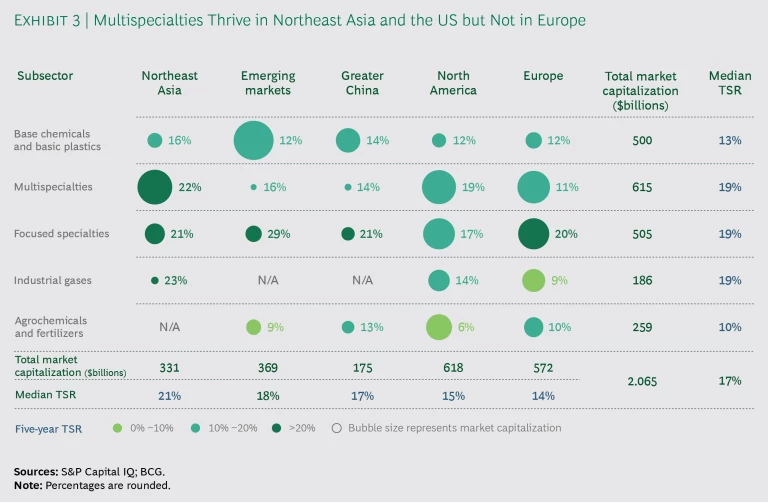
Multispecialty companies in North America, which not so long ago were among the lowest performers in the region, have become something of a bright spot. (See Exhibit 3.) Their median TSR (18.8%) now exceeds that of the region’s chemical companies overall (15%)—for the first time in the six years that BCG has been evaluating the industry. Five of the six North American multispecialty companies in our study (all in the US) have TSRs above the chemical industry average.
Near the top among North American multispecialties is DowDuPont, with a five-year TSR of 20.6%.
For the first time since BCG began assessing the industry, European chemical companies were at the bottom in terms of performance. The region’s multispecialties continue to have weak returns. Unlike their North American counterparts, these companies have not, for the most part, restructured their businesses in ways that have significantly improved profitability. European multispecialties have improved their profit margins by only 2.2%—far less than the 5.9% improvement of North American multispecialties. As a result, the European multispecialty sector lags the newly resurgent North American sector in terms of TSR development. If this divergence continues, we expect to see more European chemical conglomerates restructuring their portfolios as the pressure for higher profits intensifies.
Where the Returns Are Flowing
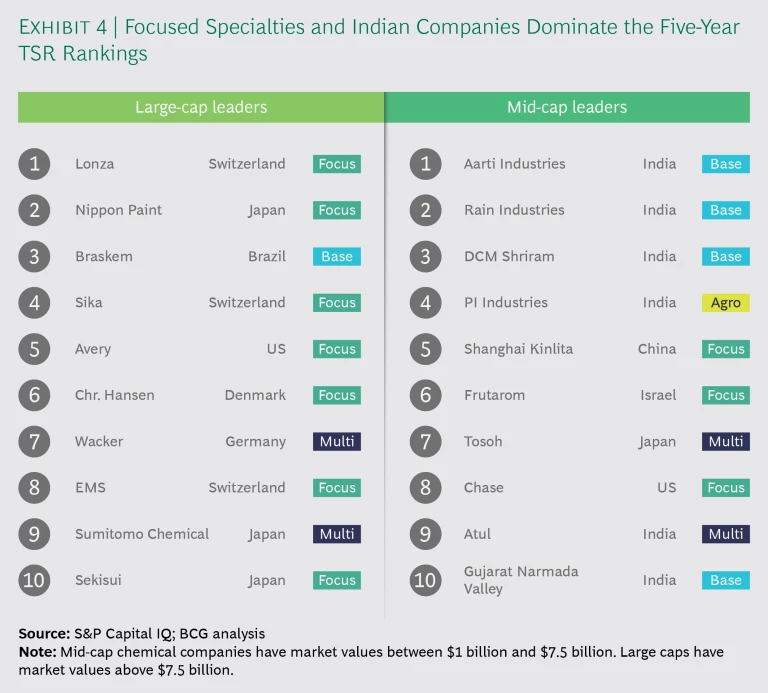
Despite the rebound in multispecialty TSRs in North America and Northeast Asia, focused specialties continue to earn the best returns among large-cap chemicals—the ultracompetitive space inhabited by companies with valuations above $7.5 billion. Focused specialties dominate BCG’s list of top-performing large-cap companies, taking seven of the top ten spots. (See Exhibit 4.)
Since 2012, when focused specialties began pulling ahead in terms of TSR, these companies have relinquished the top spot only once. And even during the period in which they were not in the lead, focused specialties matched the average return of all chemical companies and were within 2 percentage points of the top subsector.
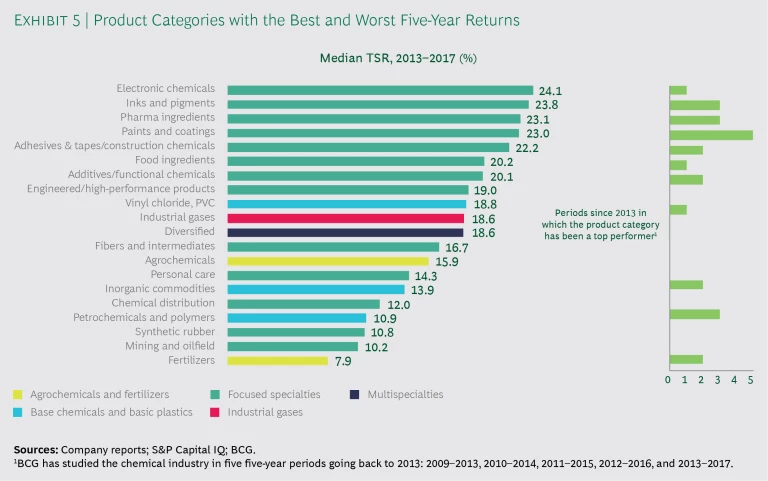
In terms of focused-specialty product categories, pharma and food ingredients have had among the highest TSRs in the last few years. (See Exhibit 5.) These are products that benefit from continuous innovation and for which there is strong underlying demand. Moreover, switching costs for these products can be high: in the US, a new pharmaceutical supplier can trigger a review and require reapproval by the Food and Drug Administration. The category’s economics are also highly favorable, since the chemical ingredient does not usually account for a large part of the end product’s cost but can make an enormous difference in its performance. This high value/low cost combination makes it easier than it is in some other chemical product categories to push through price increases.
Paints and coatings—another high-performing cluster—are benefiting from their growing use in important industries such as automotive. And because of these products’ role in construction, makers of paints and coatings have been thriving in emerging markets as well. This too is a product category that benefits from continuous innovation, resulting in better performance, easier application, reduced waste, and lower environmental impact. These attributes have made paints and coatings a top TSR performer in recent periods, keeping the category out of negative TSR territory since 2011.
Not surprisingly, companies operating in both the pharmaceutical and food category and the paints and coatings category figured prominently among our top performers. The Swiss company Lonza (first on the large-cap list, with a five-year-TSR of 45.1%) provides a variety of solutions, such as active immunotherapies and drug delivery technologies, to the global pharmaceutical market. Denmark’s Chr. Hansen (number six among large caps) and Israel’s Frutarom (in the same position among mid-caps) are food ingredient players that work with international food companies. The paints and coatings category is represented by Nippon Paint of Japan, the number-two company in the large-cap group, with a five-year TSR of 38.8%.
In the most recent five-year period, focused specialties had revenue growth of 5%—the highest of any subsector except for industrial gases—and the best returns on capital employed. The median ROCE for focused specialties was 12.6%, compared with 11% for agrochemicals and fertilizers, 9.6% for industrial gases, 8.9% for multispecialties, and 7.5% for base chemicals and basic plastics. Over the longer term, agrochemical and fertilizer companies came out on top on this metric, which is perhaps the best way of measuring chemical companies’ capital stewardship. Agrochemicals’ ten-year ROCE (bolstered by the subsector’s great run in the early part of this decade) was 13.9%, ahead of focused specialties’ 13.2%.
Of course, there are companies in subsectors besides focused specialties that are thriving, too. That is evident from the two best-performing chemical companies in our study—Aarti Industries and Rain Industries—both in the generally low-performing base chemicals subsector. Perhaps more to the point, both are benefiting from boom times in India.
Understanding India’s Surge
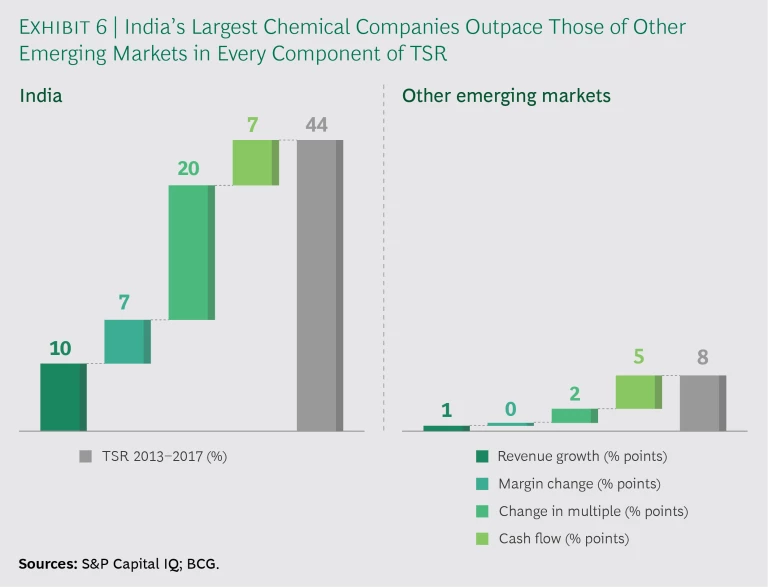
On an interactive map of the chemical industry’s prospects, India would be blinking bright green. The rise in Indian stocks in the last few years has lifted many Indian chemical companies—their median five-year TSR is 44%—allowing them to capture six of the ten slots on our mid-cap list. As shown in Exhibit 4, the first-, second-, third-, and fourth-ranking mid-cap chemical companies are all Indian.
Some industry observers may be tempted to discount the TSRs of Indian chemical companies because of the strong tailwinds the companies have enjoyed as a result of India’s stock market rise (the BSE Sensex index climbed more than 25% in 2017 alone), and because the companies are so small. (Of the 13 Indian companies included in our study, 8 had less than $1 billion in sales.) It’s easier to show dramatic progress when you’re small than when you’re big, and easier to jump out to a lead in a fast-developing market than it is to maintain such a lead.
But whatever may be going on with individual chemical companies, there is no mistaking the potential of India’s chemical industry as a whole.
Rising Incomes. Economic fundamentals have a lot to do with it. Among large developing markets, India has been one of the fastest growing, with GDP increases that have approached or exceeded 7% in the last four years. The proportion of Indian households with incomes of at least $7,700 (the starting point for what BCG calls India’s “aspirer” class) was 23% in 2016, up from less than 13% in 2005. By 2025, 36% of Indian households will be at this level or at the two higher income levels identified by BCG’s Center for Customer Insight: affluent and elite.
The growing wealth will inevitably lead to greater use of chemical products. Per capita use of polymers in India is about 24 pounds, far below the Chinese per capita average of 84 pounds and the European per capita average of 143 pounds. There’s a lot of room for growth in this and other areas of the industry.
And the growth has already started. Chemexcil, a council set up by the Indian government, expects chemical revenues in India to grow from $147 billion now to $300 billion in 2025.
On an interactive map of the chemical industry's prospects, India would be blinking bright green.
Growing Use of Specialty Chemicals and Agrochemicals. Premium chemical products will be a big part of that growth. To take just one example, many construction projects in India still use basic windowpanes and basic concrete. But more and more buildings, especially in large cities, are starting to use acrylic windows and specialty concrete, such as fast-setting mixes. These products require polymers, sealants, foams, and concrete admixtures, all of which will increase the demand for specialized chemicals and push India’s chemical industry toward higher-margin products.
There are analogous shifts on the consumer side. Among the products that use specialty chemicals—and that are starting to be purchased with more frequency in India these days—are facial cleansers, cosmetics, and shampoos. The trends on the construction and consumer sides will push India’s chemical industry, which has been rooted in commodity chemicals, toward more specialized formulations.
Not that there’s anything wrong with being a commodities chemical company in India. Among the six base chemical companies in our study that are located in India, the median five-year TSR was an eye-popping 51%. And while agrochemical companies worldwide are struggling to generate returns, in India this subsector is thriving. As a country with declining amounts of arable land, low crop yields, and rising demand for grain and animal feed, India has become a big user of agrochemicals. This has bolstered the fortunes of Mumbai-based UPL (five-year TSR of 44%), which manufactures pesticides, herbicides, fungicides, and seeds, and of PI Industries (TSR of 55.4%), an agrochemicals company that prides itself on innovative products and close relationships with its customers, including farmers.
Growth in the Cities and Towns. Certain regions provide clear evidence of how India’s chemical industry is taking off. In the western part of the country, which includes Maharashtra and Gujarat, for example, giant manufacturing plants rise up in industrial areas and special economic zones. Even in the region’s less populous cities and towns, smaller plants, cement mixers, and distillation columns dot the roadside. These are smaller companies, often family run, that make chemical-based products catering to local needs. Quite often, it’s their canisters and containers that can be found on the shelves of hardware stores in the area.
In addition, the Indian government has been trying, for the better part of a decade, to accelerate the development of the chemical industry through the creation of Petroleum, Chemical and Petrochemical Investment Regions (PCPIRs). The idea is that each PCPIR will include a core petrochemical company that supplies feedstock to dozens of more specialized chemical companies.
Some investments are occurring outside the PCPIR framework. Earlier this year, Saudi Aramco, the world’s biggest oil producer, and the Abu Dhabi National Oil Company teamed up with a consortium of Indian chemical companies to build a giant refinery and petrochemical project on India’s west coast. If our conversations with Western technology players are any indication, this will not be the last such development; indeed, several technology players report having been contacted by Indian companies looking for partners in petrochemical investments.
What It Will Take to Succeed. As a whole, India’s biggest chemical companies have had both significant revenue growth and higher profits in the last five years. (See Exhibit 6.) Some already have significant export revenues. For instance, roughly 80% of UPL’s revenues come from outside the country (and more than a quarter of those are from Latin America). The export portion of the business of Indian companies will increase further as they set up operations outside of India and use their cost advantage over US and European rivals.
The question for most companies is not whether there are opportunities in India but which opportunities they should pursue. Domestic companies should certainly view specialty chemicals as an avenue of growth. This is not a build-it-and-they-will-come certainty, however; a lot of ground-up marketing is required. For instance, India’s masons, contractors, and architects will need training in order to take advantage of new concrete admixtures and other construction materials that use specialty chemicals. Thankfully, the increasing penetration of smartphones and 4G internet service in India is making the marketing job easier; the target audience for these products will be able to find information online rather than requiring individual tutoring. But Indian companies will certainly need to develop some new digital capabilities.
Another opportunity for domestic Indian companies is to increase their exports. We have already mentioned the exports of several of India’s agrochemical companies; an analogous opportunity exists for those making intermediates. Less expensive than Western offerings and (in some cases) higher in quality than China’s, Indian-made intermediates have already gained a toehold with European and US chemical firms. Nutraceuticals have been a notable early area of success.
As for non-Indian multinationals, they have opportunities in multiple end markets, from core development needs—materials for clean air, clean water, sanitation, and personal hygiene—to more advanced specialty products. However, non-Indian companies will only succeed to the extent that they establish a local presence for sales and marketing. Multinationals will also have to think through whether their existing products are suitable for India, or whether new products—perhaps at different price/performance points—will be needed given the country’s stage of development.
While agrochemical companies worldwide are struggling to generate returns, in India this subsector is thriving.
For foreign companies that don’t yet have a presence in India, there’s the question of how to begin. Partnerships and M&A are both good ways to enter the market and develop production capacity. The Indian government allows full ownership of Indian chemical companies by non-Indian entities, and this is something that multinationals should consider. After all, with the landscape of providers still so scattered, there is an opportunity to create shareholder value through efficiency gains and economies of scale. And there is little question that foreign companies will be more successful if they use local managers with the access, contacts, and understanding needed to succeed in India’s unique chemicals market.
Digital’s Looming Impact on Chemical TSRs
BCG’s analysis suggests that the chemical industry has been somewhat slow to use digital technologies effectively. Only 17% of chemical companies worldwide fit our definition of “digital champions,” versus 23% of companies in all industries. Digital champions use technology to improve core processes like operations and the customer interface. They also use digital to make better use of data and to come up with innovative new business models. (See “ Digital Maturity Is Paying Off ,” BCG article, June 2018.)
It would be all but impossible, on the eve of 2019, for chemical companies not to have made some serious digital strides. In all of the industry’s subsectors, digital technologies are contributing to operational improvements, especially in areas like production efficiency and supply chain transparency. From the outside, there is no way to quantify the impact of individual companies’ digital efforts on their TSRs. But given what it takes to get these investments approved—most digital projects in the chemical industry must pass a threshold for return on invested capital—and our conversations with the teams involved, our sense is that such projects will inevitably increase profit margins.
As for digital investments or projects that fundamentally change the competitive dynamics or economics of a subsector—and hence affect the TSRs of individual companies in a dramatic rather than a merely incremental way—these are harder to find in the chemical industry. But they are coming. For example, digital could be at the core of a value proposition involving an integrated solution, such as the guarantee of an outcome rather than a price: a coatings company “selling” a certain number of successfully coated cars per day to an automotive OEM, instead of just sending 100 drums of coating along with an invoice. The digital technology, developed jointly with a maker of industrial sprayers, would automatically fine-tune the coating, detect problems, ensure quality, and audit the number of completed “coats.” Likewise, an agrochemical company could sell herbicides not by the liter but by promising a pathogen-free field or a guaranteed income for the farmer. This type of arrangement is just beginning but could bring substantial benefits to farms operating in locations with heavy regulation or very specific customer demands.
The chemical industry has been somewhat slow to use digital technologies effectively.
Overall, such uses of digital are less likely for base chemical companies than for focused-specialty and multispecialty companies, where performance differences are most real and most significant. But even in base chemicals, digital might enable pooled virtual capacity, a way of sharing assets that could soften the boom-and-bust cycles that afflict so many base chemical plants.
That none of these innovations has really taken off may reflect the chemical industry’s conservative nature. In chemicals as in most traditional materials industries, the uncertainty associated with disruption can create a bias, at least in the short term, against major changes that put shareholder value at risk.
A Diagnostic with 2019 in Mind
There is no one strategy or set of strategies that every chemical company should pursue; the industry is too complex for that. But there is a set of questions that every chemical company should ask. Here, with an eye to 2019, are the five most important:
- Do your different businesses have autonomy? This question is most relevant to executives at multispecialty companies. Put bluntly, top-down centralized decision making doesn’t usually work. Instead, you should let each of your businesses pursue an operating model and a value proposition that will enable it to compete in its own area. Centralized approaches to R&D, procurement, production, and the supply chain should likewise be scrutinized. The synergies used to justify these shared functions are often overstated.
- Are you innovating with an eye to sustainability? The word “sustainability” may have a negative connotation in highly regulated parts of the industry. But sustainability also has a commercial upside. Because your customers may want or need to satisfy emerging health or environmental requirements—and because of the increased requirement for sustainability in your own operations—you should be looking for new ways to meet this imperative and devoting more innovation dollars to sustainability.
- Do you have the right plan for developing markets? Big companies often enter new regions with products that have succeeded in territories where they already have a presence. This is understandable as a cost-savings tactic but doesn’t usually work. Our experience in newer chemical markets—India is a good example—suggests that products and solutions need to be tailored to local needs. It’s also important to have local assets and dedicated local infrastructure.
- Are you using digital to differentiate yourself strategically? Coming up with the right digital strategy is to some extent a feat of the imagination. You need to build scenarios that help you understand what a new entrant could do to separate you from your customers. And you need to think about how you could use digital to broaden your value proposition, potentially offering outputs and guaranteed benefits rather than just input-oriented chemical products.
- Have you prepared for changing trade and tariff regimes? Depending on your position in the global trade flow, there’s a real risk of costs going up and revenues going down. Uncertainties relating to trade could also increase inventory levels throughout the industry, reducing ROCE and TSRs. At the moment, more is unknown than is known. So it’s imperative that executives have a detailed understanding of which of their products and segments could be positively or negatively affected, think through “second-order impacts” on customers and suppliers, and develop alternative supply chain scenarios so the company can thrive no matter how the geopolitics shake out.

