Many generic pharmaceutical companies don’t know what really drives the cost of goods sold (COGS) at the level of the single stocking-keeping unit—and consequently cannot effectively manage these costs. Yet with competition growing increasingly cutthroat, the success of an entire product family can hinge on the gross margin of a SKU in a single market. Generic small-molecule and biosimilar pharmaceutical companies have rightly taken steps to control COGS by reducing material and labor expenses—but those steps aren’t always enough.
BCG’s 2019 Generics COGS Benchmark provides some valuable insights. The study, which included a range of global leading firms and local champions from the US, Europe, and Asia, found that the cost of goods sold as a percentage of revenue (COGS%) varies widely. Scale can help reduce small-molecule and biosimilar per-unit costs, but only to a point. Portfolio complexity has a huge impact, so companies need to monitor that complexity constantly.
The key takeaway is clear. By carefully managing COGS, generic drug companies can improve their competitiveness dramatically. While implementation details will depend on the individual firm’s business models, markets, and manufacturing network, the potential savings can be as high as 30%.
Reducing material and labor expenses isn’t always enough to control COGS.
COGS Has Many Drivers
Our benchmark study explored the differences in the costs of producing generic small-molecule and biosimilar drugs. We also looked at the costs of producing different dosage forms of small-molecule products, in particular, oral solid doses (OSDs) and sterile liquids (SLs). Since internal conversion costs represent only approximately 30% of total COGS, the benchmark reviewed the entire COGS baseline, which also includes the costs of active pharmaceutical ingredients and their procurement, contract manufacturing, distribution, and related work done in company locations outside of manufacturing plants (above-site costs).
Three key findings emerged: COGS as a percentage of revenues varies widely; firms that produce both generic small-molecule and biosimilar drugs spend the same portion of COGS on the same functions; and both scale and complexity affect COGS.
COGS as a Percentage of Revenues Varies Widely
To assess the performance of companies across the industry, we used cost of goods sold as a percentage of revenue (COGS%). That’s because the cost to produce divided by revenue generated from the sales is a good indicator of how well a company has control and understanding of the tradeoffs between its product portfolio, pricing practices, and industrial operations’ impact on the operating margin.
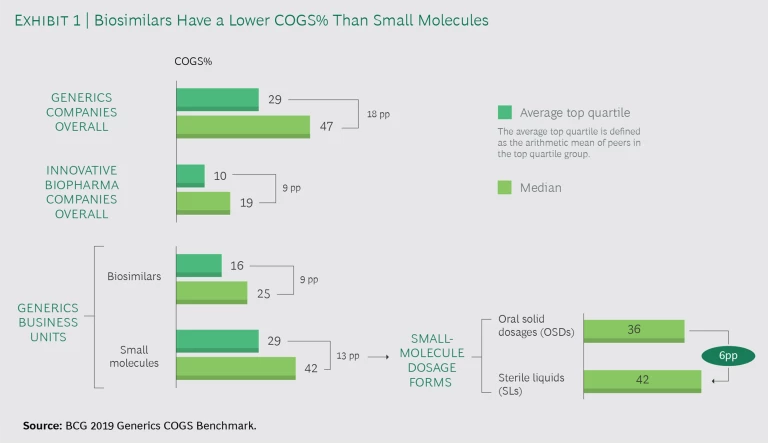
Our benchmark found a wide range of COGS% among generic drug companies. (See Exhibit 1.) Specifically:
- Generics small-molecule and biosimilar drug companies that ranked in the top quartile had significantly lower COGS% than their peers: the top quartile averaged 29%, while the industry median was 47%. This 18 percentage point span contrasts with the 9-point span between top quartile and average innovative biopharma companies, as reported in BCG’s recent biopharma COGS benchmark .
- The COGS% of business units producing biosimilars is much smaller—approximately 17 percentage points—than those that produce small molecules.
- The span between average top quartile and median companies is higher for small molecules than for biosimilars (13 and 9 percentage points, respectively).
These spans suggest that strategies (and therefore profitability targets) vary widely depending on where and how generics companies compete, and that the particular markets, portfolio mix, and pricing strategy all play a role, especially in the small molecule arena.
Drilling down into the costs of producing generic small-molecule dosage forms, we found some important differences. The COGS% of SLs accounts on average for almost 6 more percentage points of revenue than does OSDs. Yet several generics players are keeping SLs—even products with negative margins—in their portfolio. That’s because these products answer market needs, complete the portfolio to allow access to specific tenders, address regulatory requirements, and make use of excess manufacturing capacity.
Generics Companies Have Similar COGS Breakdown Across Business Units
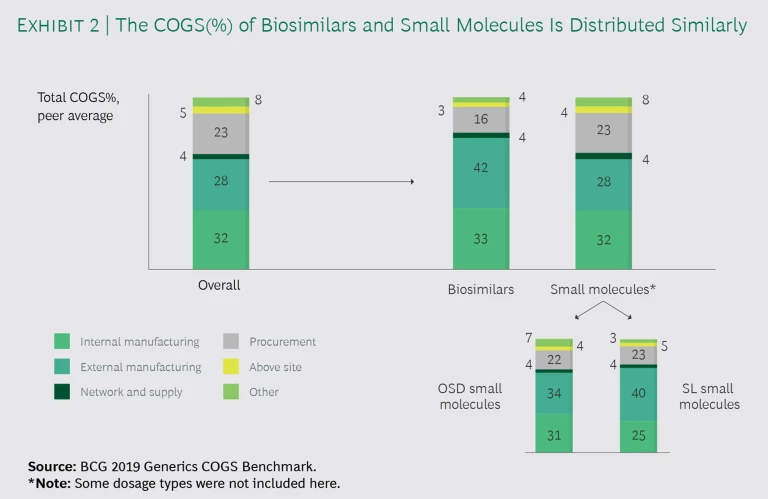
We found that companies producing both generic small-molecule and biosimilar drugs end up spending the same portion of COGS on equivalent functions. As Exhibit 2 indicates, both small-molecule and biosimilar business units (BUs) devote approximately 30% to internal manufacturing, 4% to supply chain, and 3% to 5% to above-site costs. The only areas where the BUs differ substantially is external manufacturing and procurement: biosimilar BUs spend more on contract manufacturing organizations (CMOs) than do small-molecule units (42% versus 28%) and less on procurement (16% versus 23%).
Within small-molecule business units, the proportion of COGS spending devoted to internal and external manufacturing varies with the dosage form. Notably, external manufacturing spend for SLs is greater than it is for OSDs. These findings suggest that contract manufacturing plays a larger role in the production of hard-to-make products.
Only 15% of products that will lose their patents over the next five years are SLs (60% are OSDs); moreover, the SL subsector continuously faces quality and compliance issues. For these reasons, some generics players have made the strategic decision not to develop the technical expertise or scale to derive any kind of competitive advantage from manufacturing SLs in-house. Outsourcing, in fact, helps remove unneeded complexity. The same considerations hold true for most biosimilar companies as well.
Companies producing both generic small-molecule and biosimilar drugs spend the same portion of COGS on equivalent functions.
Both Scale and Complexity Affect COGS
For the small-molecule companies we analyzed, scale is the primary driver of COGS. That is, COGS is correlated to the volume per manufacturing site and total production volume, meaning the number of units produced in each business unit. COGS is also affected by complexity—that is, the number of SKUs per site:
- Volume Per Manufacturing Site. The relationship between the number of units produced at a given site and the per-unit cost appears to be linear, meaning that the bigger the volume produced on a given site, the lower the per-unit cost.
-
Total Production Volume and Complexity. In the benchmark sample, for every doubling of total production volume of both OSD and SL products, there is a 15% to 20% reduction in the cost per unit. If OSD production volume exceeds a threshold of 30 billion to 40 billion units, unit costs start rising. The threshold for SL products is much lower—unit costs start rising after volume reaches only 1,500 million to 3,000 million units. (See the sidebar for a comparison of the impact of scale on unit costs of small-molecule OSDs and their branded equivalents.)
For both OSDs and SLs, the threshold is linked to complexity too. In the case of OSDs, the per-unit cost starts rising when more than 350 to 500 SKUs are produced in one site because of factors such as frequent changeovers and complex planning.
- Three Performance Tiers. Taking the previous two factors into account, we found that survey participants can be divided into three categories, along the correlation curve between cost and volume:
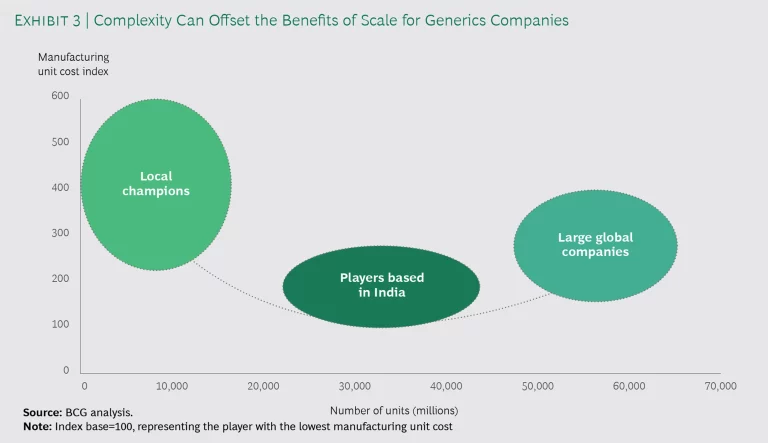
Local Champions. These companies have a strong commercial presence and access in a number of different specific markets, such as those in Europe, and so have a complex portfolio of products. Moreover, their manufacturing operations are located mostly in higher-cost domestic plants. Consequently, these firms have high unit costs.
Players Based in India. Competing in select large markets while manufacturing a relatively simple portfolio in low-cost domestic locations, these companies have relatively low unit costs.
Large Global Companies. Serving markets around the world, these companies produce a complex portfolio of products and are unable to fully leverage scale. Many of these firms have spent years rationalizing plants and optimizing their network footprint. As a result, their unit costs are moderate.
To improve COGS performance, firms need to focus on managing the elements that demand the most spend.
The amount of portfolio complexity has a surprisingly significant impact on COGS. (See Exhibit 3.) Although it’s generally believed that increasing volume lowers cost, that’s true only up to a point. Scale without streamlining will drive complexity up—and COGS along with it.
Coming to Terms With COGS
To improve COGS performance, then, firms need to focus their efforts on managing the elements that demand the most spend—internal manufacturing and CMOs. The following practices are key:
- Improve visibility into costs. Getting a detailed, dynamic understanding of costs and allocations is critical for strategic decision making. Following the practices of a select few pharma companies, generic drug companies should leverage artificial intelligence and other digital technologies, which can more accurately allocate cost and revenue to each SKU. Commercial and technical operations can use this information to make better decisions about pricing, cost reduction, service optimization, and outsourcing for products throughout their life cycle.
- Manage volume-complexity tradeoffs. To manage volume complexity, companies need to better understand the tradeoffs, which depend on the firm’s particular performance tier:
Local Champions. With an average COGS of 50% to 55%, these companies should focus on increasing volume per SKU, per site, and overall. This can be achieved with close collaboration between commercial and technical operations. (See the sidebar.) But because of the specific needs of different markets these companies serve, reducing complexity will likely be more difficult.
How Scale Impacts Generic and Biopharma Per-Unit Costs
How Scale Impacts Generic and Biopharma Per-Unit Costs
We compared the per-unit costs of generic small-molecule and biopharma products along three dimensions:
- Overall Volume. The per-unit cost of generic products declined 18% for every doubling of total production volume, while that of biopharma products declined 15%.
- Volume per Site. Generics manufacturers saw unit costs drop 27% every time the volume per site doubled. Biopharma companies, by contrast, saw unit costs decline 17% under the same circumstances.
- Volume per SKU (number of units of each separate SKU produced). For generics producers, every time the number of units doubled, the unit cost dropped 45%; for biopharma manufacturers, it declined 29%.
These findings indicate that scale effects have a greater impact on small-molecule OSD unit costs than on the biopharma equivalents.
Players Based in India. The average COGS of these companies is low, at only 35% to 40%. By expanding to additional markets, they will naturally increase the complexity of their portfolios. But low labor costs will be insufficient to maintain their cost advantage: these firms will have to boost their operational efficiency as well.
Large Global Companies. Given that the median COGS% of these firms is 45% to 50%, they should continue to optimize their portfolios and networks in lockstep.
These are fairly broad recommendations. The precise details will likely vary with the specificities of each company‘s business models, markets, and manufacturing network. But it’s safe to say that most companies, regardless of category, can benefit by reducing portfolio complexity.
We recommend setting up regular joint reviews by commercial and technical operations organizations to eliminate product families or molecules that are not strategic, profitable, or necessary for the sales of other products. Key country, regional, or global organizations should manage the tradeoffs between markets. This approach will improve the effectiveness of operating equipment and provide opportunities to consolidate manufacturing sites in the network, thereby reducing the COGS base by 3% to 4%.
-
Reevaluate the internal production network. Like their biopharma competitors, many generics manufacturers have too much capacity, whether because of historical M&As or because of capacities added in anticipation of growth.
Companies should keep production in-house if there is a competitive advantage such as scale, access to a specific technology, or IP that must be protected. For SKUs produced in sufficient volume, internal manufacturing allows companies to save up to 30% of the CMO’s gross margins. If players decide to take this route, they should focus on improving production costs with operational excellence measures.
- Explore partnerships with CMOs. The other option is to partner with CMOs. The small molecule and biosimilar drug companies we analyzed outsource on average more than 30% of their production volume.
The small-molecule and biosimilar drug companies we analyzed outsource on average more than 30% of their production volume.
Best-practice companies tend to group their contract manufacturers into three or four tiers. The top tier consists of the few CMOs that are strategic partners, while the bottom tier is usually a long tail of one-off outsourcing projects for a specific product or market. For example:
Strategic Partnerships. Strategic alliances are essential for biopharma manufacturing . They are also becoming more important for small-molecule and biosimilar drug producers, which need access to the complex and expensive technologies and processes such as mechanisms to improve how a drug is delivered or how long it lasts. Allowing only two or three contract manufacturers to produce any one macro technology can reduce COGS by 2% to 3% by reducing the complexity of the overall footprint while providing an opportunity to achieve scale.
Toll Manufacturing. For the other CMO tiers, it’s worth keeping in mind that toll manufacturing is much less costly than asking CMOs to manage the entire manufacturing process. By providing raw materials or semi-finished goods to a CMO to finish production, companies can reduce COGS by 5% to 10%.
CDMO Partnerships. When it comes to molecules that can be developed in-house, internal R&D allows companies to reduce development costs by 10% to 20%. For all other molecules, partnerships with contract development manufacturing organizations are a good option if a company does not possess the needed capabilities internally.
- Drive digitization of manufacturing facilities. Industry 4.0 technologies will help accelerate improvements in drug manufacturing COGS as greater use of automation, robotics, and predictive analytics increases asset utilization and end-to-end supply chain transparency. Although generics companies’ digital capabilities potentially lag those of innovative biopharmas, we believe that selected agile innovations, supported by solid economics and investments, will help reduce the gaps. Over the next decade, generics companies will likely follow the path of innovative biopharma brands that have embraced flexible manufacturing and that produce new drug products in small-volume facilities that can be easily adapted for different products. Industry 4.0 solutions will facilitate that transition.
The cost pressures that generic and biosimilar drug companies feel today are unlikely to diminish any time soon. But with a better understanding of what drives up COGS the most, firms can start now to take the steps needed to reduce their COGS. Their competitiveness depends on it.


