Natural products are looking more and more like natural winners in the consumer packaged goods (CPG) industry. From mid-2018 through mid-2019, these products drove more than half of the industry’s growth in unit sales, despite accounting for only 7% of those sales. Looking forward, we expect natural products to continue to outpace conventional products, thanks to powerful tailwinds from consumer demand, more selection, and wider distribution.
Many players—including natural brands, CPG companies, and private equity firms—want to invest in the natural-products segment. But as natural-product categories grow and mature, the challenge is to determine where to invest. Our research reveals that certain bellwether cities are powerful predictors of nationwide adoption trends, pointing to five opportunities for the fastest growth in natural products.
A Large Segment with Sustainable Growth
It is important to first clarify what we mean by the term natural product. It is open to some interpretation because there is no legal or regulatory definition. SPINS, a company that analyzes consumer data for manufacturers and retailers of natural products, defines a product as natural if it meets two requirements. The first prerequisite is that the product is marketed as, or perceived by consumers and retailers to be, natural. The second one is that the product meets SPINS’s set of proprietary criteria for ingredient quality, certifications, and claims, among other factors. For the purposes of this article, BCG partnered with SPINS, adopting its definition and analyzing its industry data.
To gauge the future growth of natural products, we analyzed a broad set of distribution paths, including conventional retail channels (such as those for food, drugs, mass merchandise, and convenience items) as well as channels for natural and specialty products. (See “About the Data.”)
About the Data
About the Data
For this study, we partnered with SPINS, a leader in aggregating and analyzing retail and consumer data for the natural-products segment. We used four years of SPINS’s syndicated retail-store data, covering the period from mid-2015 through mid-2019 and reflecting $1.39 trillion in CPG sales made in the US annually.
The scan data comprised more than 2 million universal product codes (UPCs), which provide information about a product (such as its name, label claims, and third-party certifications) as well as where it was sold, the quantity purchased, and the price; UPCs are collected when products’ bar codes are scanned at a point of purchase.
The UPCs were linked to more than 75 health and wellness attributes (for example, organic and paleo) and classified into more than 100 product categories and 500 subcategories. Such detail showed how brands positioned their natural products in the marketplace. The sales location data was broken down by conventional retail channels (such as those for food, drugs, mass merchandise, and convenience items) as well as channels for natural and specialty products. BCG reclassified SPINS’s data into 33 product categories for the purposes of its analysis.
It’s no secret that the natural-products segment is growing fast within the CPG industry, but it’s striking just how powerful this small segment has become and how much it is outpacing the conventional-products segment. Besides examining unit sales growth and total unit sales, we also looked at revenue growth and total revenue. From mid-2015 through mid-2019, natural-product revenue grew by 25%, from $51 billion to $64 billion, across the channels that we analyzed.
Revenue growth has come mostly from an increase in unit sales, suggesting strong, sustainable growth.
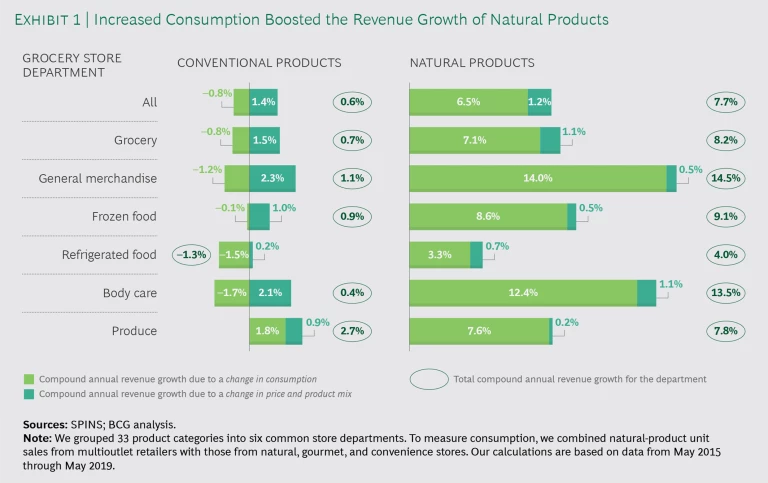
Significantly, this revenue growth has come mostly from an increase in unit sales, rather than a change in the price and product mix, a fact that suggests strong, sustainable growth. From mid-2015 through mid-2019, rising consumption (as measured by unit sales) boosted natural-product revenue growth by 6.5% per year, on average, while changes in the price and product mix added another 1.2% per year, on average, to revenue growth. That adds up to a 7.7% compound annual growth rate (CAGR) for the natural-products segment. (See Exhibit 1.) This performance stands in stark contrast to that of conventional CPG products, which managed to eke out an overall CAGR of 0.6% only because changes in the price and product mix boosted revenue by 1.4% per year, on average, mitigating an average annual 0.8% decline in revenue from unit sales.
Three Strong Drivers of Growth
We expect the revenue of the natural-products segment to increase by more than $15 billion by 2024, as a result of three main drivers of growth.
Consumer Demand for Natural Attributes. Consumers’ interest in purchasing natural products that have clear and direct benefits to their personal health continues unabated. For example, products labeled raw now make up a $2 billion market that had a 9.5% CAGR from mid-2015 through mid-2019.
Consumers are also purchasing products manufactured by socially and environmentally conscious companies. For example, Certified B Corporations—businesses that meet high standards of verified social and environmental performance, public transparency, and legal accountability—now account for $5 billion in consumer product sales, the result of an 8.9% CAGR for these companies’ combined sales from mid-2015 through mid-2019.
And, whenever possible, consumers want to purchase products that are good for themselves and for the environment. For example, certified organic products make up a $36 billion market that had a 7.0% CAGR for the same four-year time period.
Breadth of Natural Offerings. Three factors contribute to the increasing number of natural brands and offerings:
- An Explosion of Challenger Brands. From mid-2015 through mid-2019, 3,600 natural brands emerged, vastly increasing the availability of natural products, giving consumers more choice, and challenging incumbent brands. This explosion mostly occurred within product categories (such as baby food) that have historically included more natural products. But companies have also pushed to disrupt other categories (such as skin and body care) that have historically had fewer natural products.
- Growth in Private-Label Natural Products. To capture the growth in natural products, traditional retailers are increasing the number of private-label natural products that they offer across product categories. Private-label products that are certified organic, for example, make up a subsegment that had a 16% CAGR from mid-2015 through mid-2019, the result of a $2 billion increase in revenue. The introduction of new, lower-priced private-label natural products has expanded the number of consumers who can afford these products.
- New Products from Conventional Brands. As consumer demand for natural products continues, more conventional brands are innovating and releasing natural offerings. Sometimes, these are entirely new brands (such as Purely Inspired by Iovate Health Science); other times, natural offerings are conventional products that have been repositioned (such as Huggies Natural Care Wipes).
Distribution Through Conventional Channels. The third driver of revenue growth is wider distribution: increasingly, natural products are being carried not only in stores that sell natural and specialty products but also in conventional retail venues. The number of natural products that were carried by multioutlet (MULO) retailers rose by 28% from mid-2015 through mid-2019. We expect the number to expand further, particularly in product categories that remain relatively underrepresented in MULO stores.
Consumer Adoption Varies by Product Category
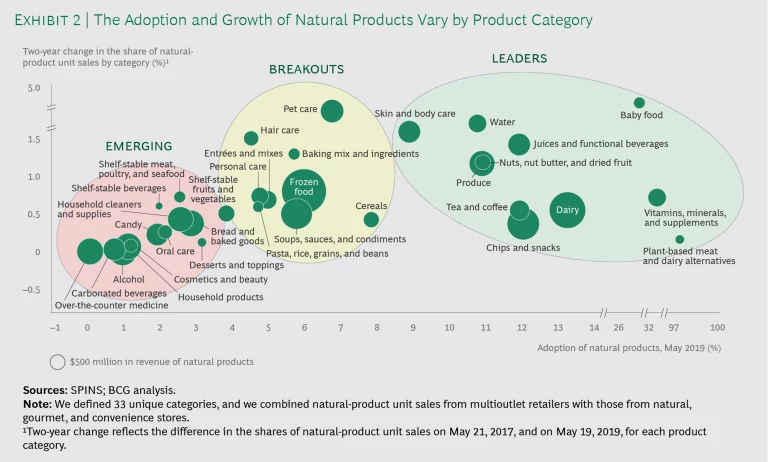
As noted previously, the natural-products segment accounted for 7% of the CPG industry’s total unit sales from mid-2018 through mid-2019. However, natural products’ percentage of total unit sales for each product category varied significantly. In some categories, natural products accounted for less than 2% of unit sales; in other categories, these products accounted for 25% or more. To identify patterns in consumer adoption (or purchasing) of natural products, we sorted 33 product categories into three groups. (See Exhibit 2.)
- Emerging. Most of the natural products in this group are still just getting out of the starting blocks. Consumer adoption has been minimal, and these natural products accounted for 3% or less of their categories’ total unit sales as of mid-2019. (In other words, conventional, nonnatural products accounted for 97% or more of these sales.) One explanation for the slow growth is that emerging product categories—such as candy, household cleaners and supplies, and alcohol—have not been associated with natural attributes and have yet to catch on. As consumer attitudes evolve, however, these emerging categories are poised to become breakouts.
- Breakouts. Consumers are rapidly adopting the natural products in this group, and there is still plenty of room for growth, given that they accounted for only about 4% to 8% of their categories’ total unit sales. Breakouts will likely continue to scale quickly as consumers increasingly demand greater access to natural products.
- Leaders. This group includes some of the earliest natural offerings. The adoption of these natural products slowed, but it did not hit a ceiling. We found that they accounted for 9% or so of their categories’ total unit sales, and we expect that some will continue to see growth of 1% or more per year.
Bellwether Cities Point to Five Growth Opportunities
We expect the revenue of the natural-products segment to grow by more than $15 billion by 2024. But the trick to investing strategically is to understand where exactly growth will come from. To zero in on current trends, we analyzed consumer adoption of natural products in 33 consumer goods categories in metro areas around the US. What we found was enlightening. In certain early-adopter cities—for example, Denver, Portland, San Diego, San Francisco, and Seattle—natural-product adoption tended to be at least twice the national average. For example, consumer adoption of the natural bread and baked goods category was 11.8% in Seattle, compared with its national average of 4.3%.
In bellwether cities, natural-product adoption tended to be at least twice the national average.
In order to determine how much faster early-adopter cities are embracing various natural products than the nation as a whole, we calculated early adoption (EA) scores for the 33 categories. A category’s EA score is the result of dividing its local adoption percentage by its national adoption percentage. In the case of natural bread and baked goods, the EA score is 2.8, indicating that adoption in Seattle is more than twice the national average. This is significant because, as we also found, natural categories that had higher EA scores in these early-adopter cities in 2016 tended to see a spike in national adoption over the next several years, as the rest of the country played catch-up.
By analyzing the EA scores of natural categories, we identified five promising opportunities for rapid growth by 2024: chips and snacks, bread and baked goods, frozen food, household products, and nonalcoholic beverages. Interestingly, these five opportunities cut across the three groups—emerging, breakouts, and leaders.
Chips and Snacks. The national adoption of natural chips and snacks was 12%, which is higher than most, making this category a natural-products leader. However, adoption in the bellwether metro areas was twice that, indicating significant growth opportunities for a category with $27 billion in total revenue. Specifically, we anticipate continued consumer demand for gluten-free, vegan, and paleo products, as well as for those without genetically modified organisms (GMOs). The key brands that have driven unit sales growth include Angie’s Boomchickapop, RXBAR, Simply Cheetos, and SkinnyPop Popcorn.
Bread and Baked Goods. Although the category of natural bread and baked goods grew significantly, it’s still an emerging area, and we see much room for growth. The national adoption for this category was just 2%, but among bellwether cities, adoption was 7%. For the period we analyzed, Dave’s Killer Bread drove much of the category’s growth in these cities.
Frozen Food. The national adoption of natural products in the frozen food category stood at 6%, historically driven by demand for ice cream marketed as natural or “better for you” (for example, Halo Top). In bellwether metro areas, adoption was 10%, driven by the high demand for frozen meals, pizzas, and vegetables. We expect adoption to rise, particularly as natural products disrupt demand for conventional products, much as Halo Top did. A possible headwind for this category is a trend among successful brands and products (such as plant-based meats) to migrate from frozen food to other, nonfrozen categories.
Household Products. Although natural household products have made inroads, adoption (across both categories—household products and household cleaners and supplies) was just 2% nationally. Given that adoption was twice as high in bellwether cities, we expect the growth of this emerging category to accelerate. These natural products continue to gain wider distribution in conventional channels, and an increasing number of branded and private-label products are being introduced. The key brands that drove growth include Method, Mrs. Meyer’s Clean Day, and Seventh Generation.
Nonalcoholic Beverages. For the purposes of our study, we analyzed four categories—juices and functional beverages (such as sports and energy drinks), water, tea and coffee, and carbonated beverages—as a group. We found that by mid-2019, the national adoption for this group was 9%. By comparison, this group’s adoption in bellwether cities was 19%, signaling significant room for growth in the broader market. Driving these gains were marketing efforts that promoted digestive health and gluten-free and organic ingredients. The key brands in this product category include Bodyarmor, CORE Hydration, and Guayakí Yerba Mate.
A broad array of players are looking to invest in natural products—and they are worth serious consideration. Consumer adoption of natural products in the CPG industry is still relatively low, so there is a strong incentive for natural brands to invest more. Meanwhile, traditional CPG companies can ride the trend for natural products by pivoting some of their current brands or making acquisitions to enter promising categories quickly. This is a critical endeavor, given the declining unit sales of conventional consumer goods. Finally, the venture capital and private equity communities can find plenty of growth opportunities by assessing the trends in early-adopter metro areas. We expect the natural-products segment to continue to steal the limelight—because that’s where the growth is.


