If you had a hat filled with names of machinery and industrial automation companies, it’s unlikely that you could pick one with shareholder returns above the overall market. Still, some companies have done better.
Strong returns have accrued to machinery and industrial automation companies that have built significant revenue streams around services or that have staked out positions in the digitally enabled future. Strong returns have also accrued to the companies that have set themselves apart through operating model discipline.
These companies provide a rough formula for success in an industry that has had its struggles. Thirteen of the machinery companies we analyzed had negative TSRs from 2014 through 2018. And the industry as a whole is ranked 26th of 33 industries in TSR, according to Boston Consulting Group’s value creators study .
Most top performers have shown a superior ability to adapt, moving a little faster or more deftly than their rivals.
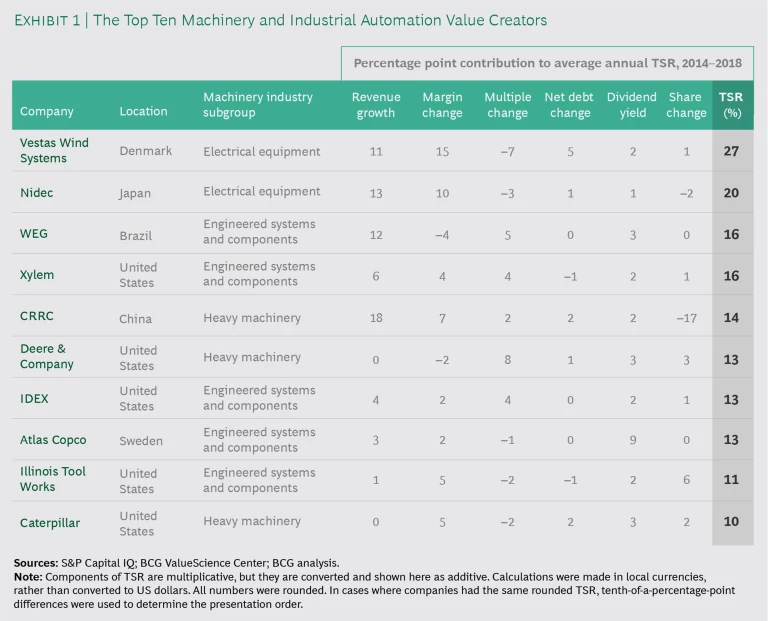
In this first value creators report about the machinery and industrial automation industry, we devote most of our attention to the winners. About one-quarter of the companies in our sample delivered five-year average annual TSRs of 10% or higher. (See Exhibit 1.) These results put them in the first or second quartile of returns for all industries. A few of these top performers have the good fortune of operating in fast-growing markets, while others have benefited from some kind of one-time event. But most have simply shown a superior ability to adapt, moving a little faster or more deftly than their rivals.
A Large, Diverse Industry
Machinery and industrial automation is a diverse industry, comprising manufacturers of multimillion-dollar autonomous mining trucks, specialized electrical components, and industrial pumps, valves, and bearings, among other products. BCG’s sample of 57 companies (referred to subsequently as machinery companies) had a total market value of $1.1 trillion as of year-end 2018, and they fit into four industry subgroups:
- Heavy Machinery. The companies in this subgroup manufacture large machines that have a commercial or industrial purpose. In recent years, the heavy machinery subgroup has augmented its mechanical orientation with a focus on digital enablement.
- Electrical Equipment. These companies make electrical components, including sensors, central processing units, and switches. The components help automate mechanical tasks in a variety of industrial and commercial settings, often in products manufactured by other industry subgroups.
- Engineered Systems and Components. The companies in this subgroup make products that generally represent key engineered components in larger systems, such as turbines, pumps, bearings, and flow control mechanisms. These products are critical to the performance of those systems.
- Industrials. These companies operate in more than one subgroup, and some operate in all three. Examples include GE and Siemens. All but one of the industrial conglomerates in our sample had more than $10 billion in revenue in 2018.
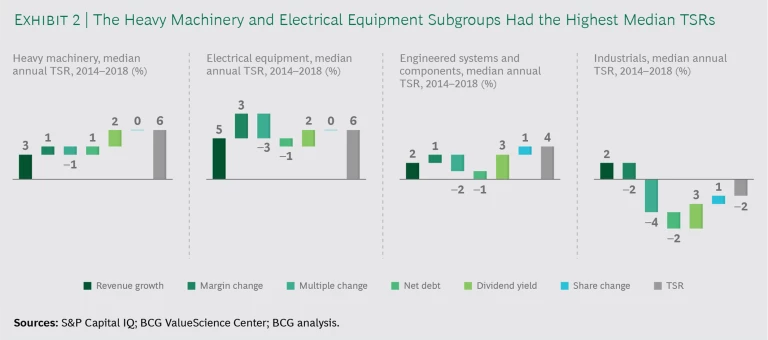
Heavy machinery companies, which have a five-year median annual TSR of 6%, are the best-performing subgroup in our study. (See “How We Calculate and Report TSR.”) These companies have done a good job of growing their services revenue. This is an important adaptation in an industry in which new equipment orders tend to match the economic cycles of end markets.
HOW WE CALCULATE AND REPORT TSR
HOW WE CALCULATE AND REPORT TSR
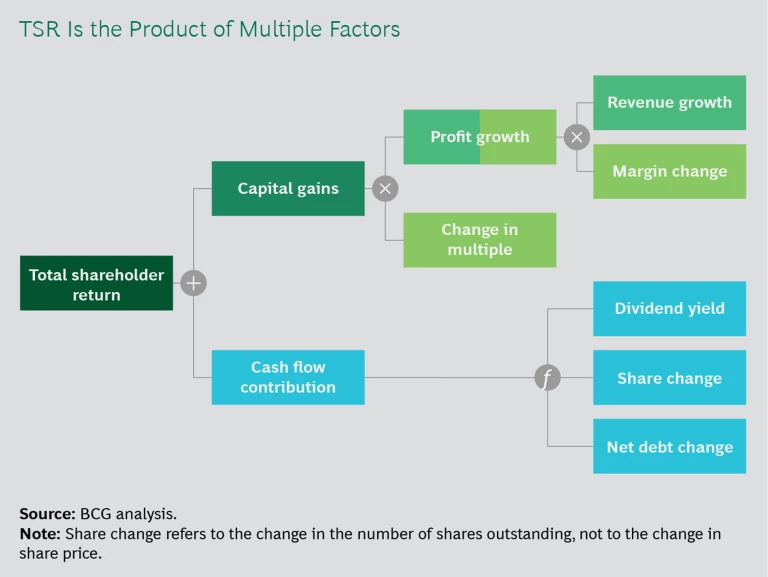
Total shareholder return, which accounts for the change in share price and any other effects on shareholders’ net wealth in a given period, is the product of multiple factors. BCG’s methodology for calculating TSR uses the combination of revenue (that is, sales) growth and change in margins as an indicator of a company’s improvement in fundamental value. (See the exhibit.) It then uses the change in the company’s valuation multiple to calculate the impact of investor expectations on TSR. Together, those two factors determine the change in a company’s market capitalization. Finally, the model also tracks the distribution of free cash flow to investors and debt holders—in the form of dividends, share repurchases, and repayments of debt—in order to determine the contribution of free-cash-flow payouts to a company’s TSR.
All those factors interact—sometimes in unexpected ways. A company may increase its earnings per share through an acquisition but create no TSR if the acquisition erodes its gross margins. In addition, some forms of cash contribution (for example, dividends) have a more positive impact on a company’s valuation than others (for example, share buybacks).
In this report, the TSRs used for groups and for comparative purposes are all medians. The TSRs associated with individual companies are straight calculations of those companies’ capital gains and cash flows, rounded to the nearest percentage point.
TSR is a useful way to assess value creation, but it is inherently backward-looking. As such, it is not a reliable predictor of future returns.
There are a variety of reasons for strong performances in the heavy machinery subgroup. For example, CRRC, the Chinese railcar manufacturer, was successfully launched and integrated as the world’s largest rail conglomerate through the combination of legacy manufacturers CSR and CNR in 2015; CRRC’s five-year average annual TSR of 14% reflects its new dominant position in the world’s largest market. And Caterpillar’s five-year average annual TSR of 10% reflects its improved profitability from operating model and digital upgrades.
Another strong-performing subgroup is electrical equipment. The companies in this category have a five-year median annual TSR that is almost as good as that of the heavy machinery subgroup (both are rounded to 6%). Electrical equipment companies had the highest revenue growth and the most improved profit margins, compared with companies in the other subgroups. (See Exhibit 2.) These strong results were propelled partly by the electrification trend in the machinery industry, which has traditionally relied more on hydraulics and pneumatics. Some electrical equipment companies are also benefiting from their exposure to fast-growing end markets, including renewable energy.
In third place, from a TSR perspective, is the engineered systems and components subgroup. The companies in this category have a five-year median annual TSR of 4%. The strong performers include the Swedish manufacturer Atlas Copco, with a five-year average annual TSR of 13%; this company created some downside protection for its earnings by building up its services revenue. Atlas Copco is also one of the companies in our study that differentiated itself through operating model discipline.
The engineered systems and components subgroup includes some companies that have staked out a position in high-growth segments. One such company is WEG of Brazil, an industrial automation manufacturer that has diversified into wind energy. Most companies in the subgroup, however, lack exposure to high-growth markets. In addition, these companies have been unable to achieve even the 3% annual revenue growth that is the average for the machinery industry. The engineered systems and components subgroup has a strikingly high proportion of companies (38%) with zero or negative five-year average annual TSRs, and the subgroup is behind (or merely at parity with) the industry as a whole for almost every component of TSR.
To be sure, there are a fair number of privately held companies in the engineered systems and components subgroup that have faster revenue growth and stronger fundamentals. Those companies are outside the scope of this study, however. (See “Who’s in Our Sample.”)
WHO’S IN OUR SAMPLE
WHO’S IN OUR SAMPLE
BCG’s machinery sample comprises publicly held companies that had market capitalizations of at least $5 billion as of January 1, 2014, which is the beginning of the five-year period that we analyzed. The sample omits diversified players (such as IHI) that operate in multiple industries, rather than in machinery and industrial automation only. Moreover, machinery companies that primarily serve the automotive space, such as NSK and Jtekt, are grouped differently by BCG.
The handful of companies that are in the industrials subgroup have the lowest five-year median annual TSR: –2%. The struggles that these companies have had are evident in the fact that all but one saw their profit margins decline from 2014 through 2018. The exception is Sweden’s Sandvik, whose 10% annual TSR was driven primarily by increasing its EBITDA margin from 14% to 22% over the period.
The Challenge of Cyclicality
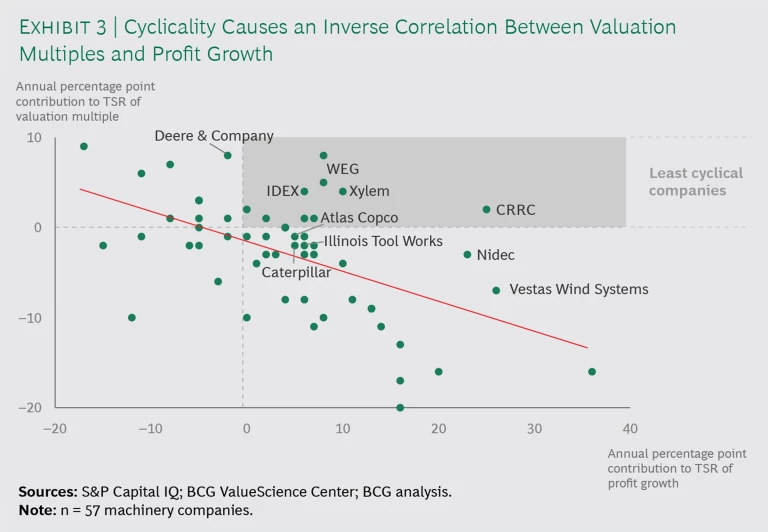
Machinery companies’ profits tend to rise and fall with economic cycles. Investors understand these cycles and factor them into their valuations. (See Exhibit 3.) Specifically, investors reduce their valuation multiples of machinery companies during expansion cycles (anticipating that cash flows will decline when the cycle turns) and increase valuation multiples during contraction cycles. The result is a strong inverse correlation between the value a company creates from profit growth and the value it creates from improvements in its price-to-earnings multiple.
This cyclicality puts machinery companies at a disadvantage, compared with less-cyclical, higher-growth companies. But some machinery companies buck the trend: their valuation multiples don’t erode during periods of rising profits. These above-the-cycle companies have strategies—including electrification, energy efficiency, and digital—that investors believe will lead to even stronger profits in the future. Not surprisingly, many of these companies are among the top ten TSR performers.
Three Paths to Success
Machinery companies whose TSRs are above the average for their subgroup generally stand out in at least one of three areas: services innovation, digitization, or operating model discipline.
Services Innovation. Perhaps the most direct route to higher returns for machinery companies is to grow their services revenue. However, not every kind of machinery company is well positioned to create a revenue stream around services. In particular, manufacturers that produce components and therefore don’t have a direct relationship with the end customer may not have a straightforward path to generating services revenue.
For the machinery companies that manufacture and sell final products to the end customer, however, the services opportunity is sizable. These companies have an installed base of dozens, hundreds, or even thousands of products at customer sites. The equipment may last for years or decades, and each product represents a chance for the manufacturer to provide valuable aftermarket services.
The services opportunity is sizable for companies that manufacture and sell final products to the end customer.
The services that machinery companies provide can take a number of forms—with some services being more common in certain subgroups than others. Most machinery companies start by focusing on equipment, providing replacement parts and the associated maintenance, repair, and operations labor. Having a robust replacement parts business is very desirable for a machinery company because of the attractive margins on such parts, especially if the parts are produced by the company itself.
Other machinery companies offer services that cover the full life cycle of equipment, from commissioning to end of life. Some of the most recent and popular services use new technologies to guarantee machine uptime or to improve operator productivity.
Few machinery companies are getting more of a lift from their services push than Vestas Wind Systems. The Danish maker of wind turbines has the highest five-year average annual TSR of any company in our study and has a services business that is almost three times as profitable as its equipment business. The services business—which consists of maintenance partnering, parts and repair offerings, fleet-optimization solutions, and data and consultancy services—is also more predictable than the company’s equipment sales business and has a higher backlog. (Vestas is a rare machinery company that gets a boost from the end markets it serves. See “The Benefits of Serving Fast-Growing Markets.”)
THE BENEFITS OF SERVING FAST-GROWING MARKETS
THE BENEFITS OF SERVING FAST-GROWING MARKETS
Most machinery companies operate in regions with many entrenched competitors and sell products that have existed, in one form or another, for decades. However, there are a few notable exceptions in our study.
For instance, Vestas Wind Systems and WEG, which are among the machinery companies with the highest revenue growth and TSR, make products for renewable-energy applications. Given that global demand for wind power is expected to grow by 30% over the next eight years, these companies’ opportunities should continue to be abundant.
Nor is renewable energy the only market that is providing fuel to a company in our sample. The cloud computing boom has worked to the advantage of Nidec, providing a ready market for the company’s high-performance cooling systems. The result is a five-year average annual TSR of 20%. And the push for safer, more efficient, and more environmentally friendly water management on the part of municipalities and businesses is helping Xylem grow its revenue at an above-average rate—contributing 6 percentage points annually to its TSR over the past five years.
Caterpillar, which has the tenth-highest TSR in our study, is another example of a machinery company benefiting from services. Caterpillar’s services—which are intended to differentiate its customer experience from that of its competitors—cover the full life cycle of its products. Some services are provided under standard and extended warranties that begin at the point of sale; other services include fleet management and optimization software. To enable its services, Caterpillar has invested heavily in digital tools and connected assets. These investments are fueling the company’s plan to double its services revenue from $14 billion in 2016 to $28 billion in 2026; currently, it has roughly 1 million connected assets in the field.
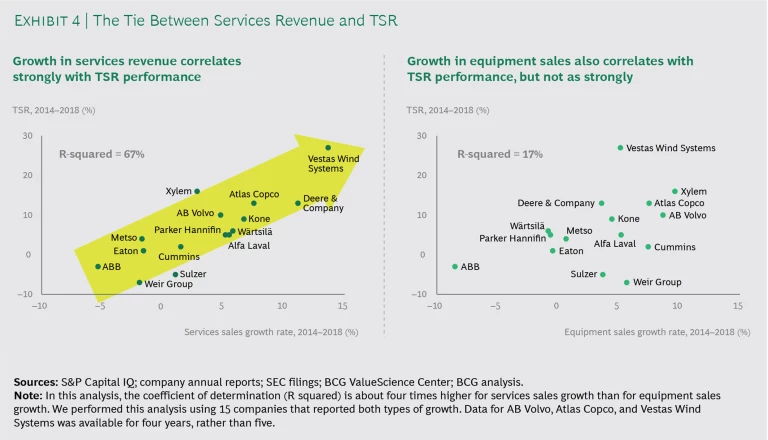
Besides generating profits, services also counter the cyclicality in sales that every machinery company faces. Inevitably, there are peaks and troughs in customers’ capital spending that machinery companies rely on as OEMs. But there is much less cyclicality in services spending. For the 15 companies in our study where the analysis was possible, the TSR benefit of having a good services strategy—and a fast-growing services business—was unmistakable. (See Exhibit 4.)
Digitization. Some companies have made significant strides in digitizing their operations or their products. Companies that deploy digital internally can improve demand forecasting, sales management, and financial reporting. Companies that deploy digital externally—for the customer’s benefit—can get a direct top-line benefit.
The advantage of having a digitally enabled product portfolio is demonstrated by Xylem, the fourth company on our list of best performers, with a five-year average annual TSR of 16%. Over the past few years, this US company (which was part of ITT until it was spun off in 2011) has made a succession of acquisitions in water control systems and digital technology that have strengthened its position in smart water management and delivery. Xylem’s revenue growth accounted for an average of 6 percentage points of annual TSR from 2014 through 2018, and its profit margin growth accounted for an average of 4 percentage points per year.
The impact of digital technology is most notable in the forward-looking valuation of machinery companies—that is, in their price-to-earnings multiples. The multiple premium, in most cases, reflects a view about the future impact of these investments, rather than reflecting any already-captured performance gain.
Consider the example of Deere & Company, which has a five-year average annual TSR of 13%. The maker of tractors and other heavy machinery has positioned itself as a leader in precision agriculture—the use of technology and data to ensure that crops and soil get exactly what they need for optimal health and productivity. From the day in 2017 that Deere announced its intention to buy Blue River Technology—a cornerstone of its precision agriculture strategy—through the end of 2018, Deere’s shares rose at three times the rate of the S&P 500. In addition to having the sixth-highest TSR in our sample, Deere’s annual TSR impact from multiple change is second best among the companies in our study.
Operating Model Discipline. The first part of adhering to a strong operating model is having a consistent approach to competition. This means that a company should make conscious decisions about its businesses and capabilities in order to build a portfolio around businesses that “win” in similar ways .
For example, a machinery company may elect to compete by manufacturing very large pieces of equipment intended to last for 20 to 50 years. Such businesses win only if they have specific capabilities, including global scale, direct-to-customer sales models, and highly responsive service infrastructures. This is the formula that accounted for many of GE’s most successful products during its decades of successful value creation.
The second part of adhering to a strong operating model is having a high-performance operating system. Such systems assume an annual process of target- and goal-setting and then cascading those goals throughout the organization. The goals should include a set of metrics that helps every worker understand what’s expected. In certain companies, the goal-setting process can be facilitated by tools, including x-matrices.
A company using a consistent competitive approach and a high-performance operating system is IDEX, which has a five-year average annual TSR of 13%. To run its different fluidics businesses, IDEX uses what it calls an 80-20 model to help its executive team, managers, and staff focus on a manageable set of priorities and on the capabilities needed to support those priorities. In essence, IDEX’s 80-20 playbook ensures that the people overseeing IDEX’s fluid and metering technologies approach their work in a way that would be familiar to those overseeing the company’s fire and safety systems.
The impact of digital technology is most notable in the price-to-earnings multiples of machinery companies.
Companies with high-performance operating systems create clear lines of accountability and make sure that there are consequences for poor performance, such as compensation adjustments or even job loss. Accountability is the responsibility of senior leadership, however, all too often it is neglected because of its unpleasantness.
Nidec is a good example of a company that drives true accountability in its operating system. With a focus on making electric motors, it succeeds by having capabilities that enable it to have an indirect sales channel and that support incremental innovation for new applications. The company has a remarkable recent record of sales growth—with sales growth accounting for 13 percentage points of annual TSR from 2014 through 2018, the second highest in our study. But that growth rate wouldn’t count for much if Nidec wasn’t also paying attention to its bottom line. The company’s profit-margin expansion contributed an average of 10 percentage points of TSR over the past five years, thanks in part to its robust accountability measures, including weekly reports submitted by managers to business unit heads. The 46-year-old company is one of only six machinery companies in our sample whose 5- and 20-year average annual TSRs are above 10%.
Companies with high-performance operating systems create clear lines of accountability and make sure there are consequences for poor performance.
The three success factors are not mutually exclusive. Indeed, for many machinery companies, it’s their digital investments that make their service innovations possible. And operating model discipline is generally an independent activity; it doesn’t impinge on the other two. Put simply, the three success factors can be mutually reinforcing, and many high-performing machinery companies focus on them simultaneously.
This is not to say that there’s an overall blueprint for success in machinery. The industry is too diverse to allow for that. Instead, each machinery company must consider its own characteristics, positions in the value chain, and competitive situations in order to determine how services innovation, digitization, and operating model improvements may help it. The machinery companies that do the best job of solving this complex equation will be the ones that thrive in the future.
