For investors swimming in an ocean of liquidity, getting a handle on the dynamics behind global investment flows is critical to wisely deploying their capital. To assist, BCG examined the trends that were driving private equity (PE) investment , corporate M&A , and greenfield foreign direct investment (FDI) in the years just before the pandemic. We also looked at the post-COVID-19 trends that are taking shape.
The emerging geopolitical, economic, and technological contexts for global capital flows are vastly different from what they were for precrisis flows—and yet familiar. The pandemic has amplified trends that were already underway, including the rising importance of PE investment, the regionalization of investments, and the focus on technology.
A Slowdown Before the Pandemic
Even before the pandemic, the growth rate of global investments had cooled. From 2016 through 2019, PE and M&A investments as well as greenfield FDIs grew at only 2% per year. Part of the explanation for the slow growth was geopolitical tensions and a nascent economic decoupling between nations and their regions. These factors particularly affected corporate M&A—which accounted for the largest share (64%) of global investment flows in 2019—and greenfield FDIs.
Geopolitical tensions and a nascent economic decoupling between nations and their regions affected growth before the pandemic.
To illustrate, intraregional investment flows increased by 5% per year, but inter-regional flows dropped by 4% per year from 2016 through 2019. Enhanced screening by the Committee on Foreign Investment in the United States chilled dealmaking on the US-China front. And fewer Chinese M&A transactions occurred in Europe because governments tightened their oversight, particularly of technology acquisitions. Meanwhile, the breakdown in talks between the US and the EU over the proposed Transatlantic Trade and Investment Partnership resulted in a tit-for-tat tariff exchange.
Then came the pandemic, abruptly disrupting investment flows. Although the value of PE investments and corporate M&A have largely recovered from the lows reached in the first half of 2020, greenfield FDIs are still down significantly, and many investors are left to ponder the future. To get a more complete understanding, we undertook a deep analysis of these three sources of capital.
PE Proves Robust and Resilient
In the years leading up to the pandemic, wealthy investors flocked to PE funds, thanks to their track record of outperforming the public markets. PE firms achieved a 17% CAGR for assets under management from 2016 through 2019, and their stores of dry powder reached an all-time high of about $1.5 trillion in 2020. During the period from 2016 through 2019, the proportion of capital committed to PE funds by investors in Asia and the rest of the world increased, while the share invested by North American investors decreased slightly, according to Preqin. Even so, North American and European investors still accounted for the bulk of capital invested in PE funds in 2019 (50% and 32%, respectively).
As PE firms thrived, they began to exert influence across the globe more forcefully. Analyzing data from Pitchbook Data, we found that from 2016 through 2019, PE firms invested capital at a CAGR of about 18%, with the value of global deals reaching a record of $595 billion in 2018; 2019 was not far behind at $586
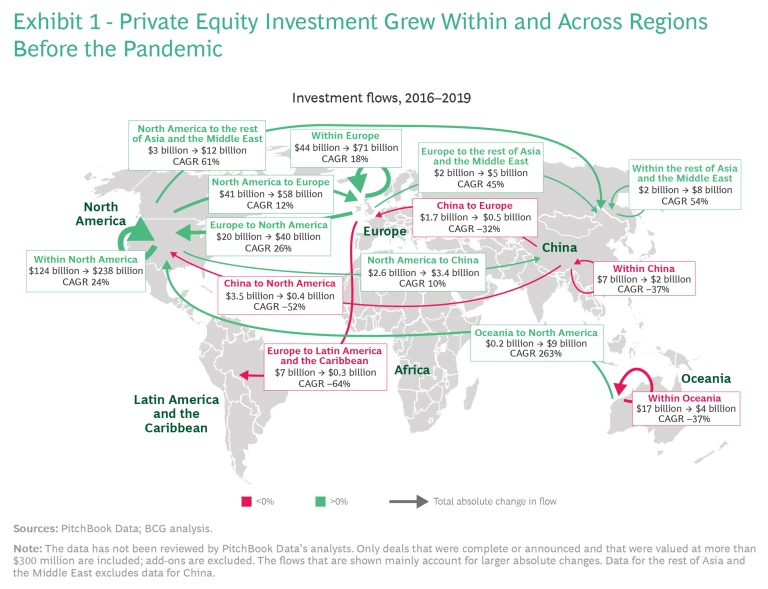
Despite geopolitical tensions, PE investment grew within and across many regions from 2016 through 2019. (See Exhibit 1.) However, not surprisingly, the pandemic brought an abrupt halt to PE activity in the first half of 2020, with the total value of all deals by PE investors falling by about 50% in the second quarter, compared with the total value a year earlier. But the industry came roaring back in the second half, with deal value in the fourth quarter exceeding 2019’s level for the same period. The enormous flexibility that PE firms have to deploy capital allowed them to stop investing quickly and then jump back in when opportunities appeared.
The pandemic accelerated some PE trends already underway, notably investments in telecommunications and networking, IT services, and pharmaceuticals. Other industries, however, struggled to attract PE investments. Energy, for example, endured a 47% drop in total deal value by PE investors. We expect PE firms to maintain their momentum going forward, given the amount of dry powder that they have, as well as their ability to act quickly to snap up attractively priced assets, such as those from divestitures.
Corporate M&A Looks to Reverse a Decline
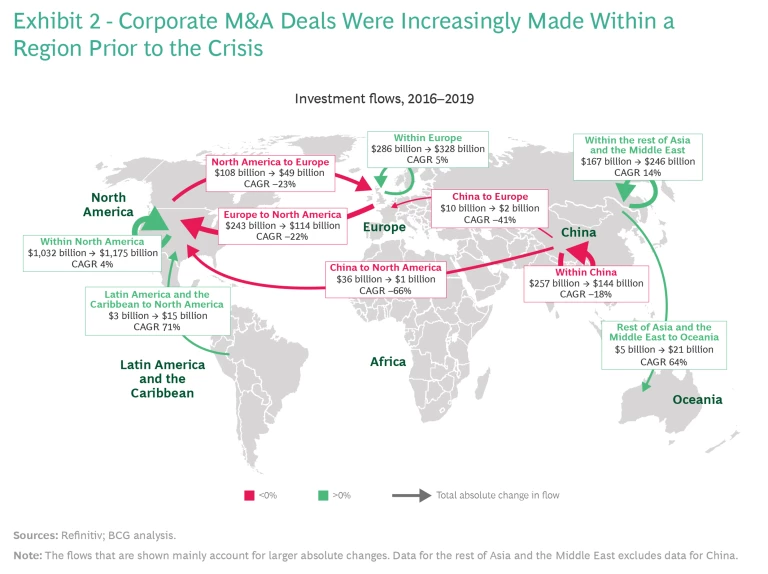
Corporate M&A growth (not including PE M&A) declined over the past decade, stagnating at about –1% CAGR from 2016 through 2019 and totaling about $2.4 trillion in 2019, based on BCG’s analysis of Refinitiv’s data. One reason, as noted earlier, was geopolitical tensions and some economic decoupling. Corporate M&A deals were increasingly made close to home, with domestic flows rising in North America, Europe, and the rest of Asia (excluding China) and the Middle East. (See Exhibit 2.) But these factors are not the only reasons for the stagnation of M&A. It had more competition from PE funds, and alternative types of deals (such as joint ventures, strategic alliances, and corporate venturing) had become more popular.
As did PE investments, corporate M&A came to a standstill in the first half of 2020 because companies postponed or canceled deals outright. It was a decline that was comparable to the depths of the financial crisis. But then, as was the case with PE investments, activity in the second half accelerated. Our analysis of Refinitiv’s data showed that the total deal value in the final two quarters of 2020 outpaced the total deal value in the last half of 2019; telecommunications, high tech, and consumer goods were the most active areas. Although the total value of deals in 2020 was down by about 10%, compared with 2019’s total value, investments increased in Europe (largely driven by investments from North America) and China.
Several factors are likely to account for the second-half surge, including the fulfillment of postponed deals, more divestitures from distressed companies, and lower valuations that quickly attracted interest.
Greenfield FDIs Face a Long Climb Back
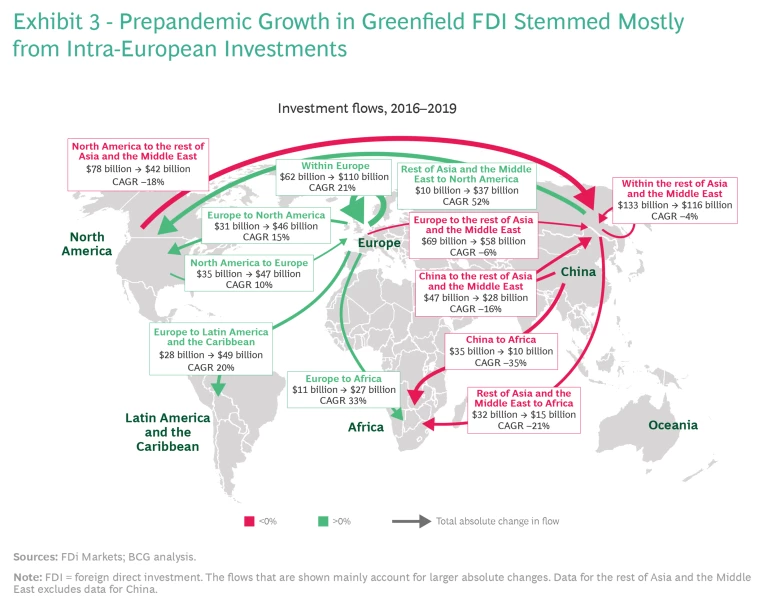
The growth for greenfield FDIs (not including M&A) was at historically low levels before the pandemic hit—a 2% CAGR from 2016 through 2019—and FDIs totaled $811 billion in 2019, on the basis of BCG’s analysis of data provided by fDi Markets. As with corporate M&A, geopolitical tensions and economic decoupling definitely affected FDI. In fact, investment flows from China and North America (areas that have historically originated the most greenfield FDIs) saw negative growth. (See Exhibit 3.) The little growth that did occur came mostly from intra-European investments and mainly in Eastern European nations. However, some growth also resulted from European countries’ increased investment in other regions.
Digitization and the shift from manufacturing toward services, as well as new sources of competitive advantage (for example, skilled labor and market proximity), have shaped greenfield FDIs since 2015. Also, environmental, social, and corporate governance factors have begun to guide more investment decisions. For example, while the largest shares of FDIs from 2016 through 2019 were still in coal, oil and gas, real estate, and renewable energy, only renewable energy grew during that period. The pandemic accelerated this trend, and given how much it has changed habits and demand, we expect that FDI flows will be further reshaped.
We expect that a prepandemic shift combined with changes during the crisis will further reshape FDI flows.
Of the three types of capital flows, greenfield FDIs saw the most precipitous drop in 2020 as a result of the pandemic, falling approximately 35%. That impact was not felt evenly. Africa and Latin America took a disproportionate blow because their economies have a relatively higher dependence on some industries hard hit by the pandemic, such as hotels and tourism. Meanwhile, FDIs in the communications, semiconductors, and biotechnology industries managed positive growth in 2020.
Because it takes time for investors to regain confidence, greenfield FDI has historically taken longer to rebound than GDP and trade, so we expect a slow recovery for FDIs. The pace of the comeback will also depend on how quickly governments take actions that could benefit FDIs, such as ensuring parity for foreign firms, attracting companies that are facing supply chain disruptions in other countries, focusing on areas that will boost economic growth, building capabilities to court foreign investment, and relaxing trade and investment policies.
The contours of the post-COVID-19 world are starting to emerge. Some trends from before the pandemic—such as the increasing influence of PE investment, the regionalization of investments, and the focus on technology—will naturally continue and even accelerate. But the pandemic is also driving radical changes in consumer behavior and other areas that will significantly impact how global capital will flow into various industries around the world.


